Houses for sale & to rent in Ludford, Louth
House Prices in Ludford
Properties in Ludford have an average house price of £373,833.00 and had 30 Property Transactions within the last 3 years¹.
Ludford is an area in Louth, Lincolnshire with 355 households², where the most expensive property was sold for £900,000.00.
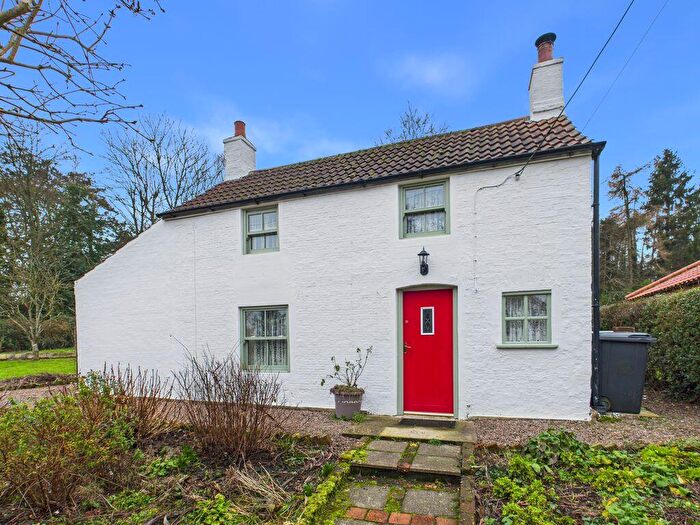
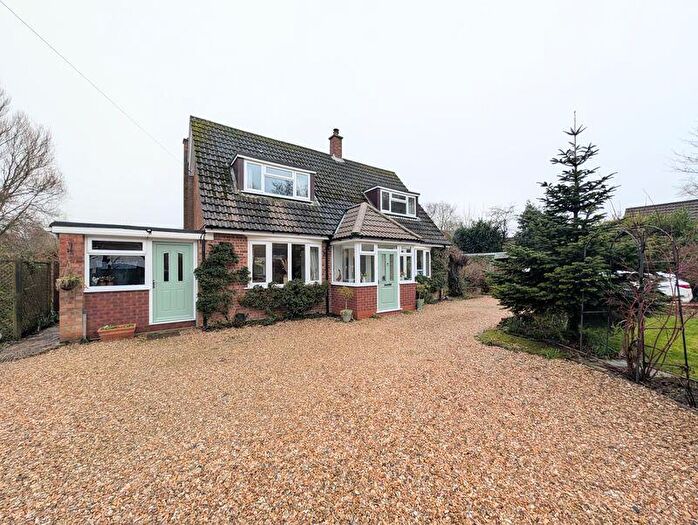
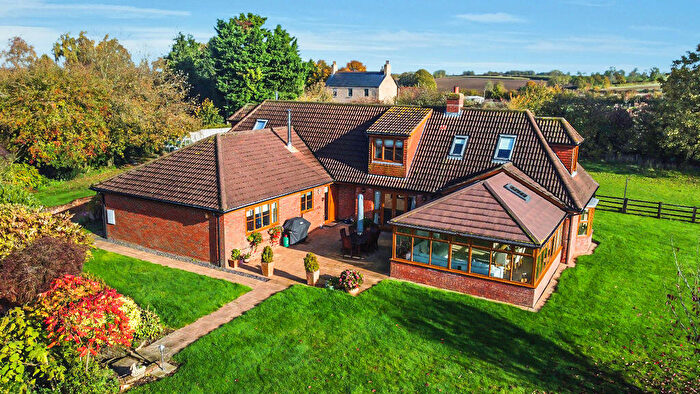
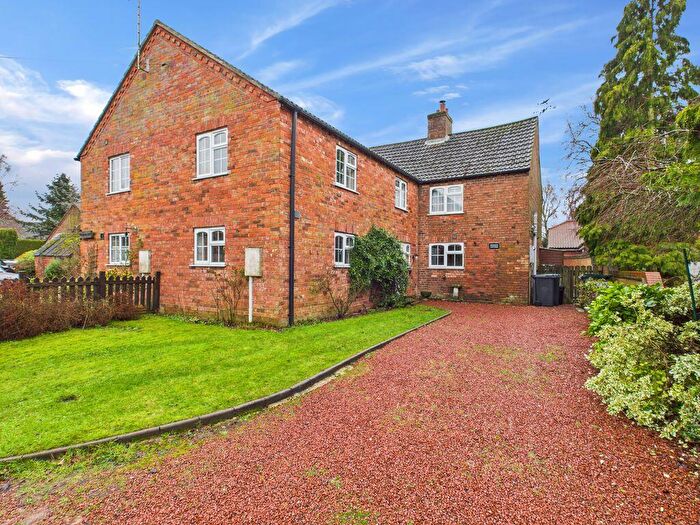
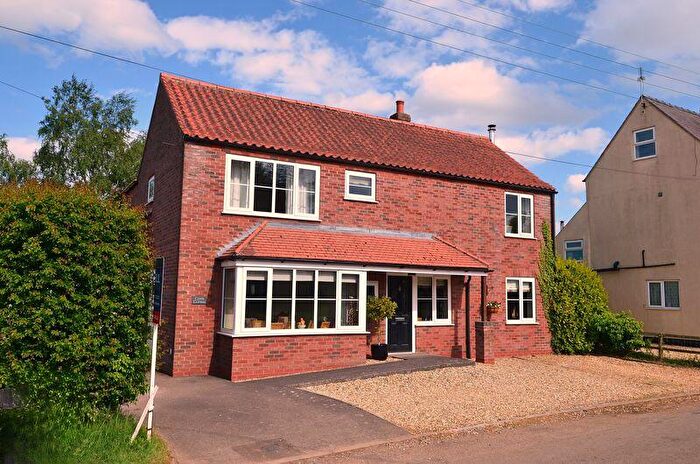
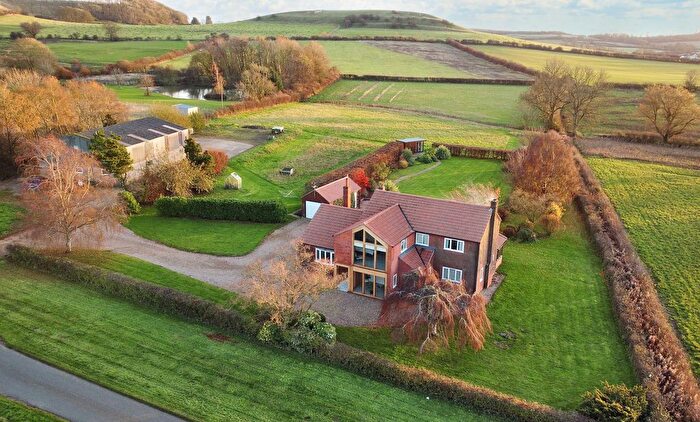
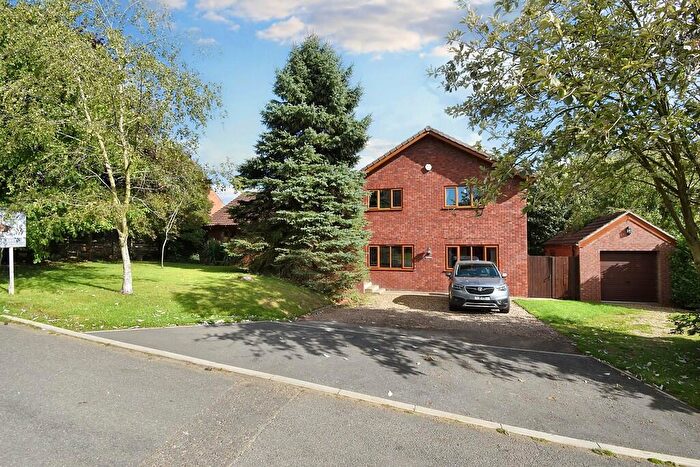
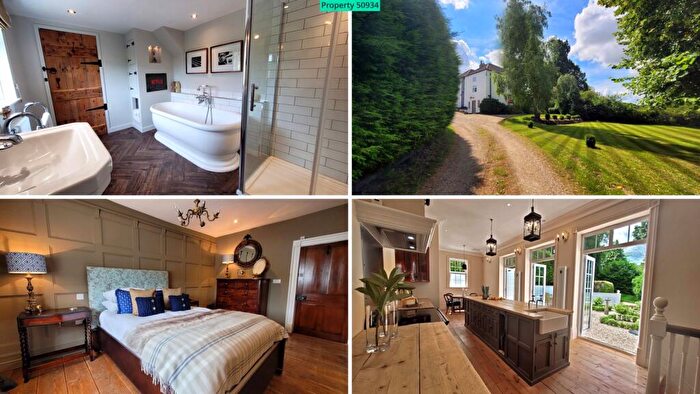
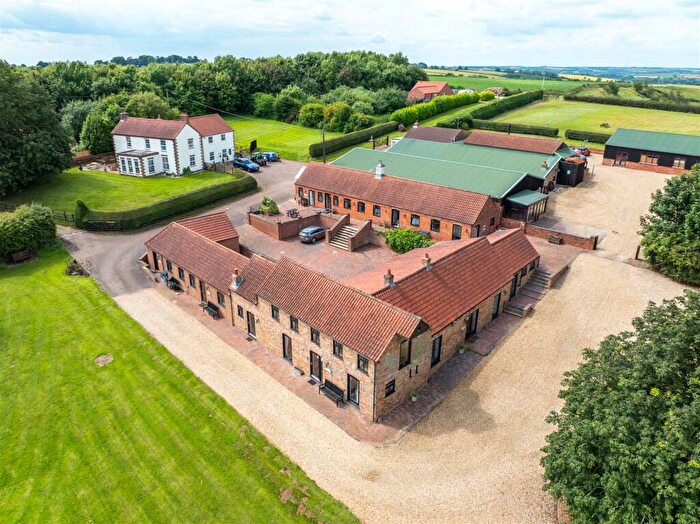
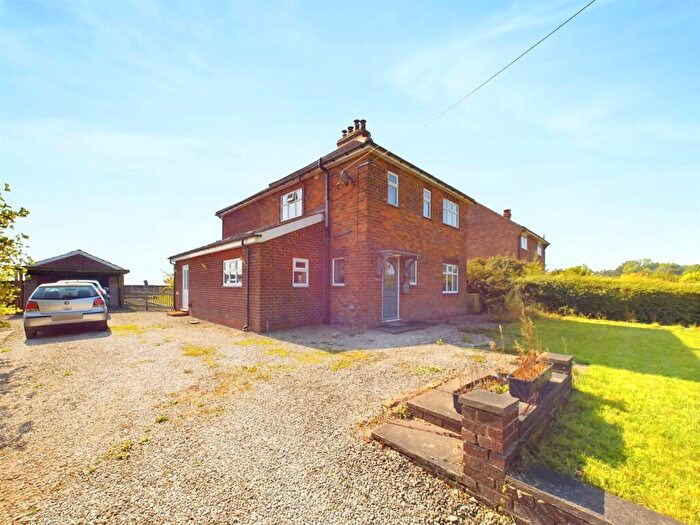
Properties for sale in Ludford
Roads and Postcodes in Ludford
Navigate through our locations to find the location of your next house in Ludford, Louth for sale or to rent.
| Streets | Postcodes |
|---|---|
| Asterby End | LN11 9UF |
| Asterby Lane | LN11 9UE |
| Butt Lane | LN11 9UP |
| Chapel Lane | LN11 9TN LN11 9XR |
| Church Close | LN11 9TL |
| Church Lane | LN11 9XL |
| Enfield Road | LN11 9TW |
| Ford Way | LN11 9WD |
| Glebe Close | LN11 9TS |
| Goulceby Lane | LN11 9UX |
| Greenacres | LN11 9TT |
| Hollengs Lane | LN11 9TH |
| Horncastle Road | LN11 9WB |
| Ings Lane | LN11 9XT |
| Main Road | LN11 9TJ LN11 9UT |
| Meadowcroft | LN11 9TP |
| Mill Lane | LN11 9XP |
| Mill Road | LN11 9TF |
| New Main Road | LN11 9XH LN11 9XQ |
| Old Main Road | LN11 9XG LN11 9XJ |
| Rowgate Hill | LN11 9XU |
| School Lane | LN11 9TQ |
| Shop Lane | LN11 9UW |
| Simons Close | LN11 9TX |
| South Street | LN11 9XF |
| Station Road | LN11 9TR |
| Top Lane | LN11 9TZ LN11 9UB |
| Watery Lane | LN11 9UR |
| LN11 0RA LN11 0RB LN11 9RA LN11 9RH LN11 9RQ |
Transport near Ludford
-
Market Rasen Station
-
Metheringham Station
-
Grimsby Town Station
-
Cleethorpes Station
-
Grimsby Docks Station
-
Great Coates Station
-
Lincoln Central Station
-
New Clee Station
-
Thorpe Culvert Station
-
Healing Station
- FAQ
- Price Paid By Year
- Property Type Price
Frequently asked questions about Ludford
What is the average price for a property for sale in Ludford?
The average price for a property for sale in Ludford is £373,833. This amount is 49% higher than the average price in Louth. There are 147 property listings for sale in Ludford.
What streets have the most expensive properties for sale in Ludford?
The streets with the most expensive properties for sale in Ludford are Rowgate Hill at an average of £745,000, Horncastle Road at an average of £607,500 and Watery Lane at an average of £490,000.
What streets have the most affordable properties for sale in Ludford?
The streets with the most affordable properties for sale in Ludford are Meadowcroft at an average of £165,000, Greenacres at an average of £225,000 and Main Road at an average of £228,500.
Which train stations are available in or near Ludford?
Some of the train stations available in or near Ludford are Market Rasen, Metheringham and Grimsby Town.
Property Price Paid in Ludford by Year
The average sold property price by year was:
| Year | Average Sold Price | Price Change |
Sold Properties
|
|---|---|---|---|
| 2025 | £336,272 | -5% |
11 Properties |
| 2024 | £353,272 | -28% |
11 Properties |
| 2023 | £453,750 | 20% |
8 Properties |
| 2022 | £361,500 | 8% |
10 Properties |
| 2021 | £331,617 | 20% |
17 Properties |
| 2020 | £264,532 | -12% |
14 Properties |
| 2019 | £295,855 | 6% |
19 Properties |
| 2018 | £279,416 | 19% |
12 Properties |
| 2017 | £226,968 | -7% |
16 Properties |
| 2016 | £242,871 | -8% |
16 Properties |
| 2015 | £262,590 | 19% |
11 Properties |
| 2014 | £212,281 | -11% |
16 Properties |
| 2013 | £235,572 | 13% |
13 Properties |
| 2012 | £204,063 | 3% |
16 Properties |
| 2011 | £198,785 | -2% |
7 Properties |
| 2010 | £202,704 | 24% |
12 Properties |
| 2009 | £153,922 | -31% |
9 Properties |
| 2008 | £202,215 | -8% |
10 Properties |
| 2007 | £218,710 | 8% |
14 Properties |
| 2006 | £200,944 | 18% |
18 Properties |
| 2005 | £165,260 | -20% |
15 Properties |
| 2004 | £198,993 | 29% |
17 Properties |
| 2003 | £142,125 | -11% |
16 Properties |
| 2002 | £157,678 | 32% |
19 Properties |
| 2001 | £106,723 | 16% |
14 Properties |
| 2000 | £89,142 | 14% |
21 Properties |
| 1999 | £77,025 | 18% |
18 Properties |
| 1998 | £63,152 | -3% |
21 Properties |
| 1997 | £65,302 | 2% |
19 Properties |
| 1996 | £63,976 | 20% |
17 Properties |
| 1995 | £51,500 | - |
11 Properties |
Property Price per Property Type in Ludford
Here you can find historic sold price data in order to help with your property search.
The average Property Paid Price for specific property types in the last three years are:
| Property Type | Average Sold Price | Sold Properties |
|---|---|---|
| Semi Detached House | £242,000.00 | 5 Semi Detached Houses |
| Detached House | £410,000.00 | 24 Detached Houses |
| Terraced House | £165,000.00 | 1 Terraced House |

