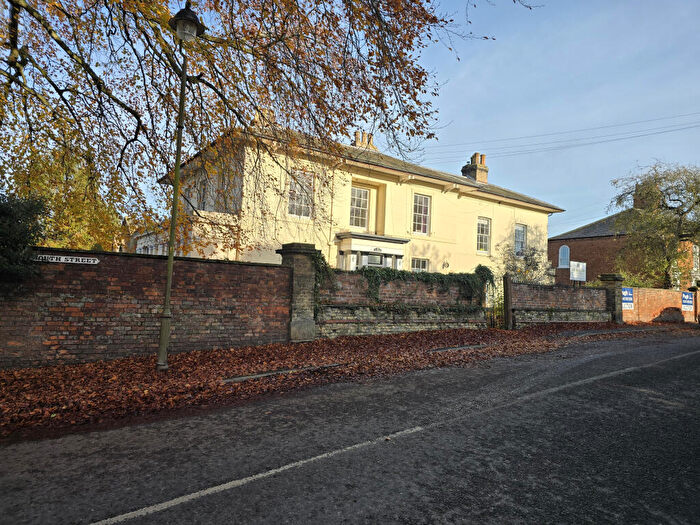
Houses for sale & to rent in St Marys, Louth
House Prices in St Marys
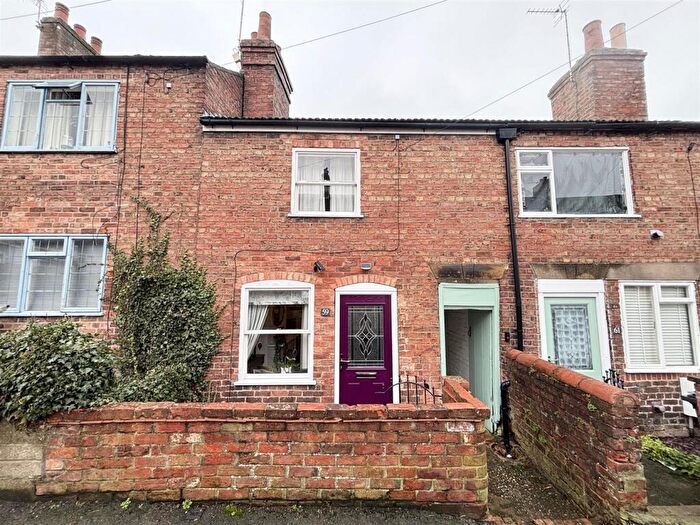
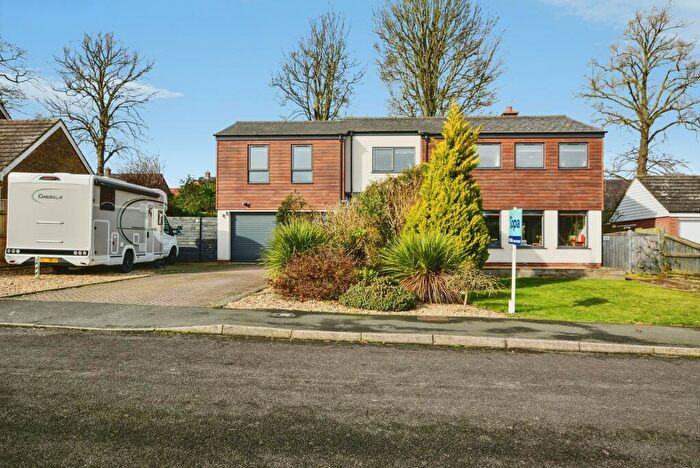
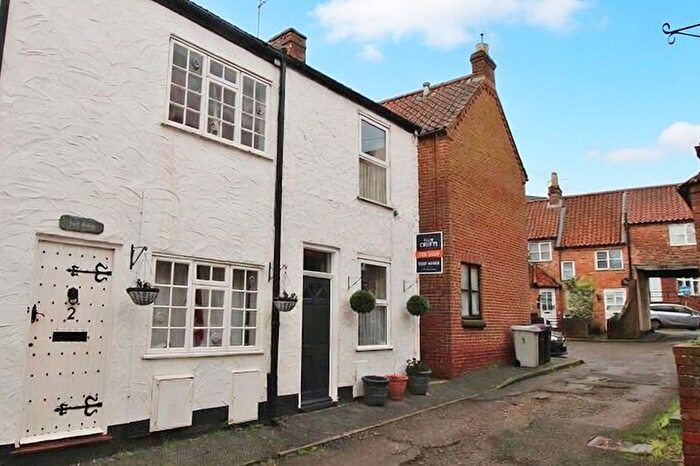
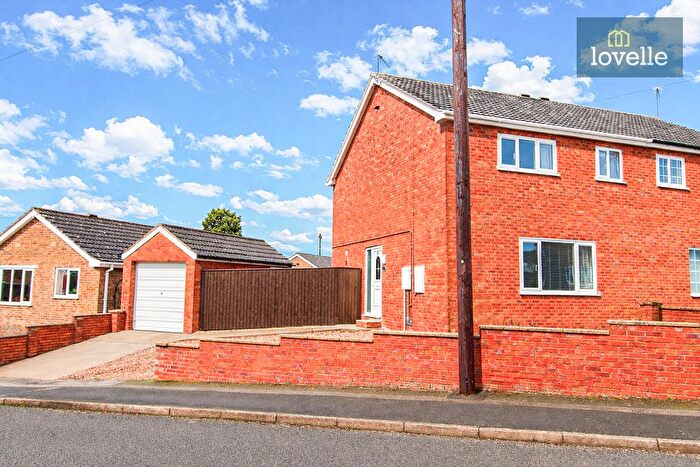
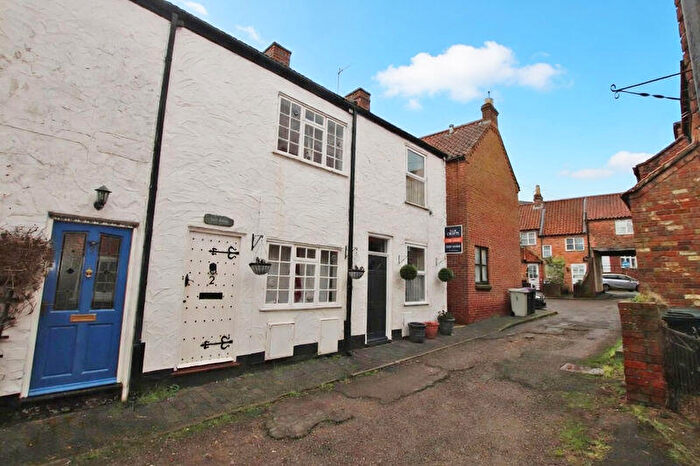
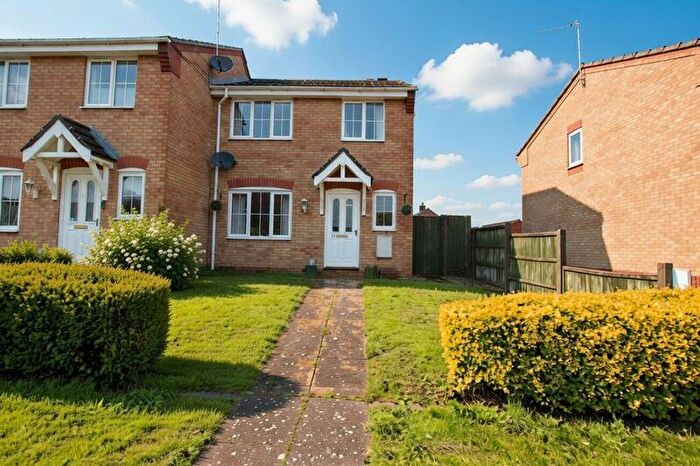
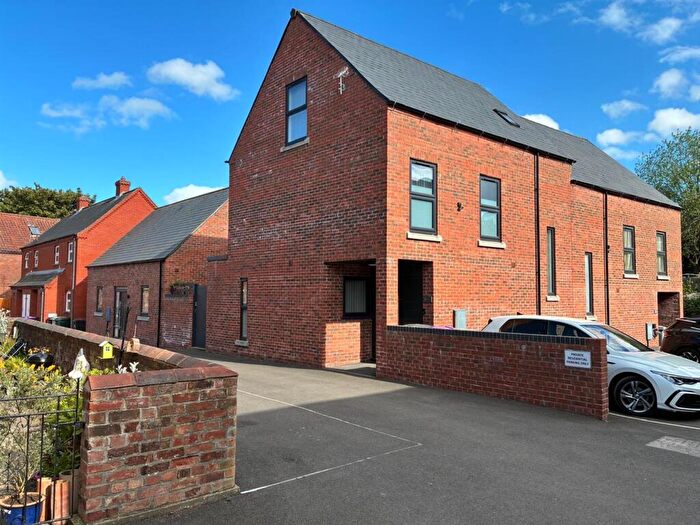
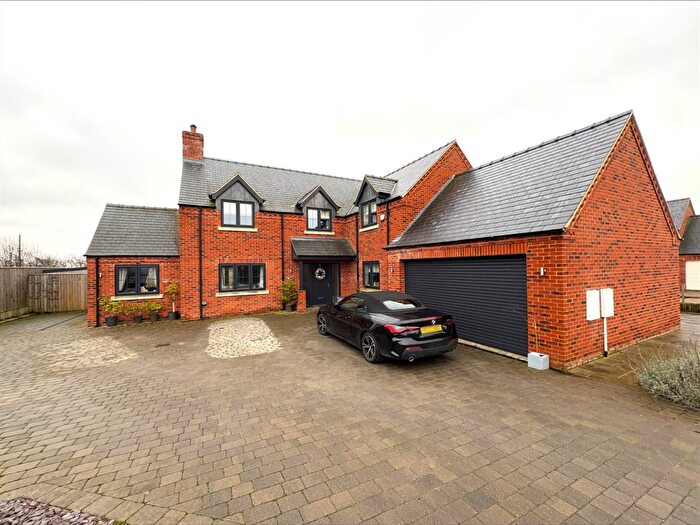
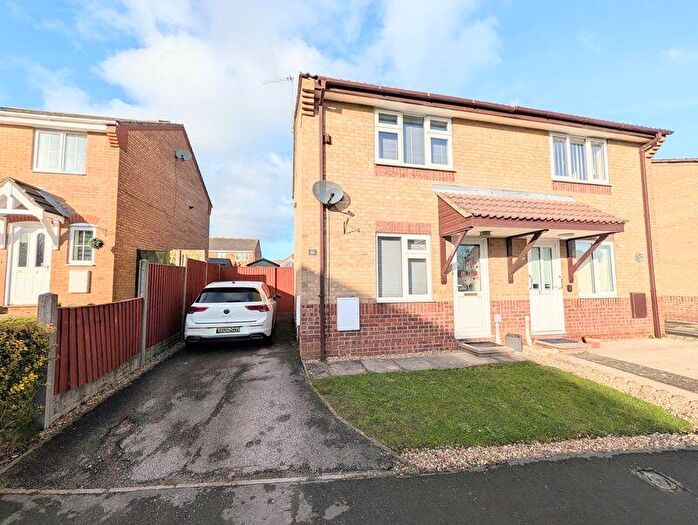
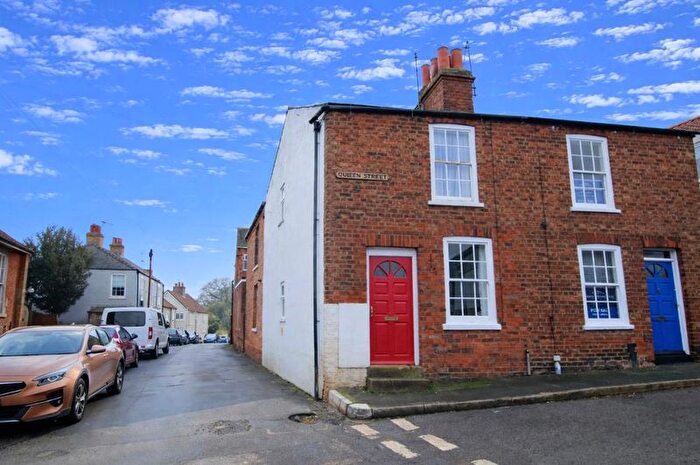
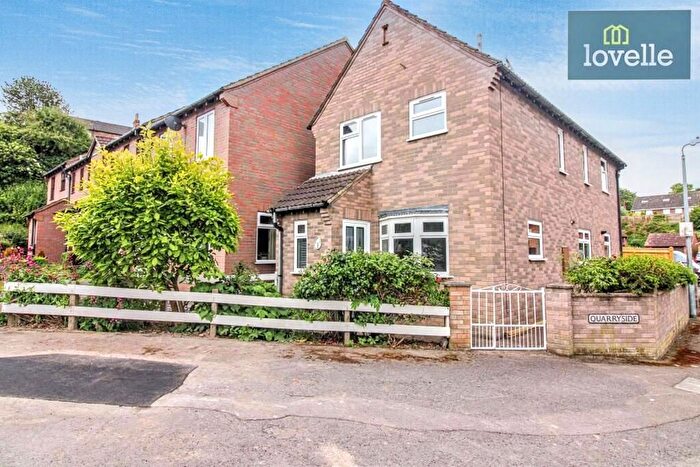
Properties in St Marys have an average house price of £283,322.31 and had 65 Property Transactions within the last 3 years¹.
St Marys is an area in Louth, Lincolnshire with 965 households², where the most expensive property was sold for £1,100,000.00.
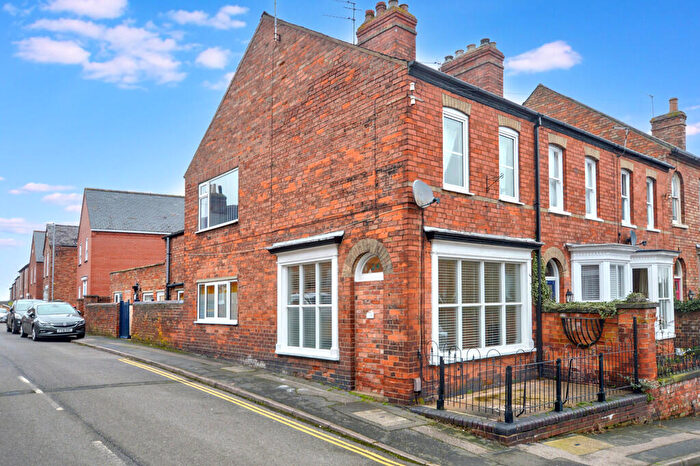
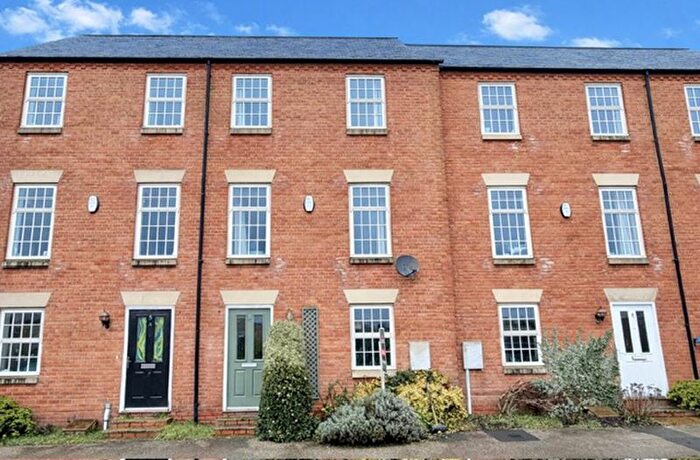
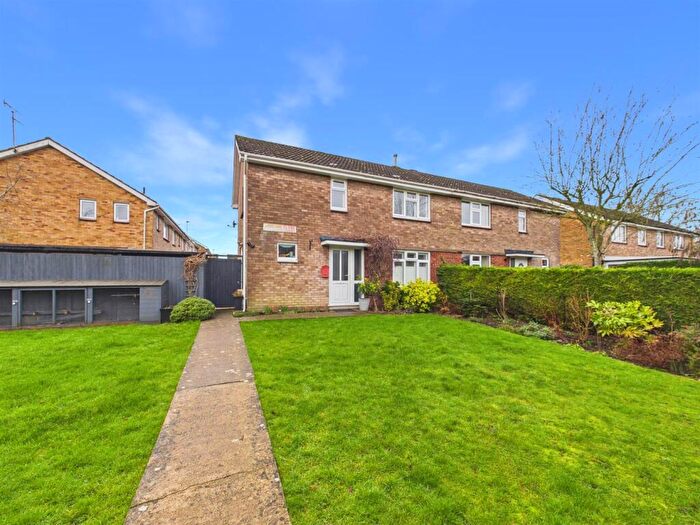
Properties for sale in St Marys
Roads and Postcodes in St Marys
Navigate through our locations to find the location of your next house in St Marys, Louth for sale or to rent.
| Streets | Postcodes |
|---|---|
| Adrian Close | LN11 9EP |
| Albany Close | LN11 8EA |
| Albany Place | LN11 8EY |
| Albany Road | LN11 8ET |
| Bartongate | LN11 8EU |
| Bexon Court | LN11 9LX |
| Blue Stone Rise | LN11 9XZ |
| Breakneck Lane | LN11 9YP |
| Brookside Close | LN11 8EX |
| Church Close | LN11 9LR |
| Crowtree Hill | LN11 9AZ |
| Crowtree Lane | LN11 0QW LN11 9LL LN11 9LN LN11 9LJ |
| Edward Street | LN11 9LA |
| George Street | LN11 9JU LN11 9LT |
| Gospelgate | LN11 9JX LN11 9JZ LN11 9JY |
| Hill Terrace | LN11 9HY |
| Horncastle Road | LN11 9LB LN11 9LD LN11 9LH LN11 9QT |
| Hunter Place | LN11 9LG |
| Irish Hill | LN11 9YL |
| Julian Bower | LN11 9QN |
| Kenwick Pastures | LN11 8EE |
| Kenwick Road | LN11 8EG LN11 8EN |
| Kenwick View | LN11 8GN |
| Linda Crescent | LN11 9LQ |
| Linden Walk | LN11 9HT LN11 9HU |
| Little Crowtree Lane | LN11 0QP |
| Little South Street | LN11 9JR |
| London Road | LN11 8QQ LN11 9QP |
| Love Lane | LN11 9LP |
| Meadow Close | LN11 9EB |
| Meridian View | LN11 9XX |
| Newmarket | LN11 9EN LN11 9EQ |
| Primrose Hollow | LN11 9JB |
| Quarry Road | LN11 9HX |
| Quarryside | LN11 9JE |
| Roman Way | LN11 9FJ |
| Saxon Way | LN11 9FH |
| School House Lane | LN11 9AQ |
| Seymour Avenue | LN11 9EW |
| Shaws Mews | LN11 9DQ |
| Somersby Court | LN11 9NN |
| South Street | LN11 9JS LN11 9JT LN11 9JW |
| Southfield Drive | LN11 9ED |
| Southfield Houses | LN11 8NN |
| Spital Hill | LN11 9JP |
| St James View | LN11 9XY |
| Sudbury Place | LN11 9YA |
| Tennyson Road | LN11 9HZ |
| Tudor Drive | LN11 9EE |
| Upgate | LN11 9ET LN11 9EX LN11 9HF LN11 9HG LN11 9JN LN11 9QW |
| Vanessa Road | LN11 9LE LN11 9LF |
| Westgate | LN11 9YE LN11 9YJ LN11 9YN LN11 9YQ LN11 9LW |
Transport near St Marys
-
Market Rasen Station
-
Cleethorpes Station
-
Grimsby Town Station
-
New Clee Station
-
Grimsby Docks Station
- FAQ
- Price Paid By Year
- Property Type Price
Frequently asked questions about St Marys
What is the average price for a property for sale in St Marys?
The average price for a property for sale in St Marys is £283,322. This amount is 13% higher than the average price in Louth. There are 1,349 property listings for sale in St Marys.
What streets have the most expensive properties for sale in St Marys?
The streets with the most expensive properties for sale in St Marys are Julian Bower at an average of £720,000, Primrose Hollow at an average of £595,000 and Spital Hill at an average of £525,000.
What streets have the most affordable properties for sale in St Marys?
The streets with the most affordable properties for sale in St Marys are Little South Street at an average of £119,750, Tennyson Road at an average of £138,333 and Adrian Close at an average of £140,000.
Which train stations are available in or near St Marys?
Some of the train stations available in or near St Marys are Market Rasen, Cleethorpes and Grimsby Town.
Property Price Paid in St Marys by Year
The average sold property price by year was:
| Year | Average Sold Price | Price Change |
Sold Properties
|
|---|---|---|---|
| 2025 | £294,708.33 | 21% |
12 Properties |
| 2024 | £233,660 | -56% |
34 Properties |
| 2023 | £365,000 | -4% |
19 Properties |
| 2022 | £381,388.46 | 15% |
39 Properties |
| 2021 | £323,454.92 | 41% |
61 Properties |
| 2020 | £190,730.97 | -23% |
31 Properties |
| 2019 | £234,435.59 | 8% |
49 Properties |
| 2018 | £215,243.22 | 10% |
45 Properties |
| 2017 | £192,668.18 | 1% |
44 Properties |
| 2016 | £190,426 | 2% |
46 Properties |
| 2015 | £185,739 | -16% |
40 Properties |
| 2014 | £215,680 | 21% |
49 Properties |
| 2013 | £170,996 | 12% |
31 Properties |
| 2012 | £151,243 | -2% |
21 Properties |
| 2011 | £153,648 | -6% |
37 Properties |
| 2010 | £162,906 | -10% |
32 Properties |
| 2009 | £179,741.21 | 5% |
33 Properties |
| 2008 | £170,715 | -4% |
32 Properties |
| 2007 | £177,631 | 1% |
57 Properties |
| 2006 | £176,548 | -2% |
53 Properties |
| 2005 | £180,865 | 3% |
45 Properties |
| 2004 | £175,369 | 21% |
39 Properties |
| 2003 | £138,223 | 34% |
39 Properties |
| 2002 | £91,155 | 12% |
58 Properties |
| 2001 | £79,996 | 13% |
49 Properties |
| 2000 | £69,928 | -2% |
40 Properties |
| 1999 | £71,548 | 2% |
70 Properties |
| 1998 | £69,776.42 | 16% |
53 Properties |
| 1997 | £58,654 | 8% |
81 Properties |
| 1996 | £53,861 | -2% |
50 Properties |
| 1995 | £54,775 | - |
41 Properties |
Property Price per Property Type in St Marys
Here you can find historic sold price data in order to help with your property search.
The average Property Paid Price for specific property types in the last three years are:
| Property Type | Average Sold Price | Sold Properties |
|---|---|---|
| Semi Detached House | £203,718.00 | 16 Semi Detached Houses |
| Detached House | £387,463.79 | 29 Detached Houses |
| Terraced House | £200,138.00 | 18 Terraced Houses |
| Flat | £158,750.00 | 2 Flats |

