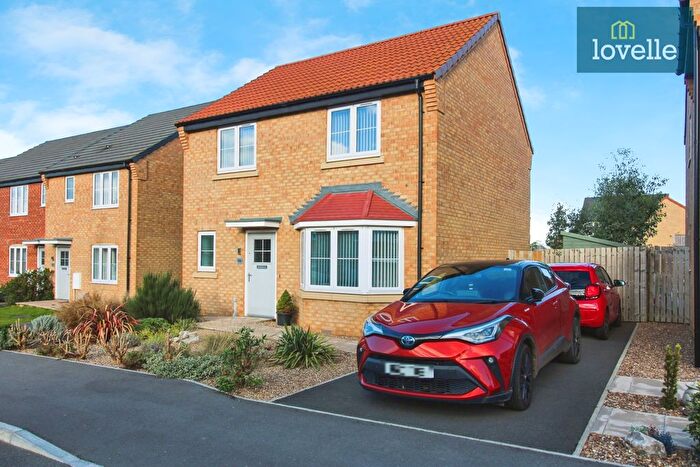
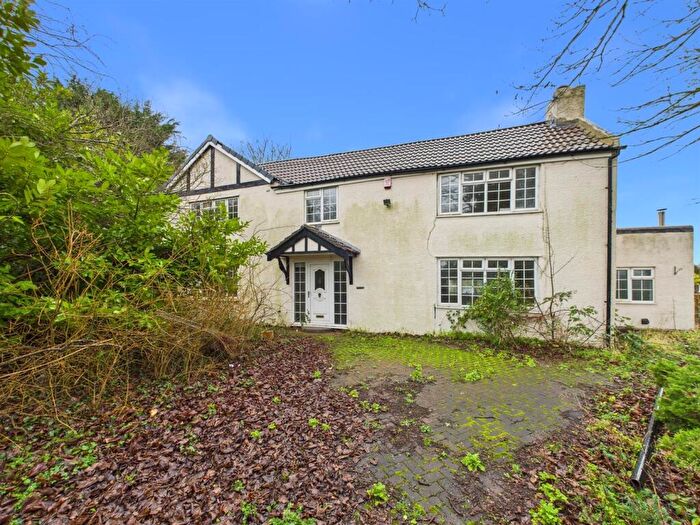
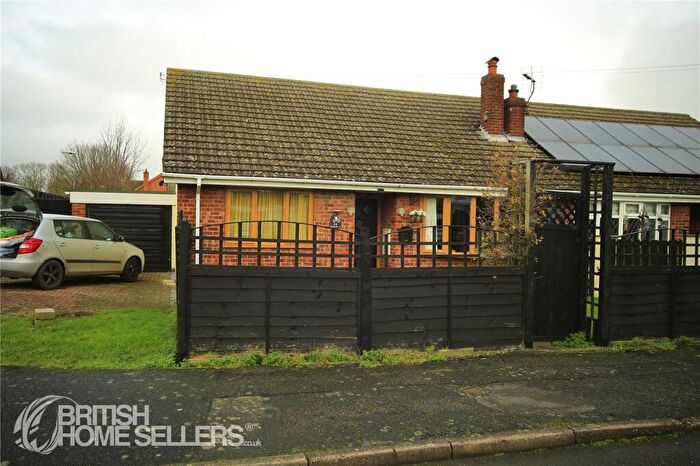
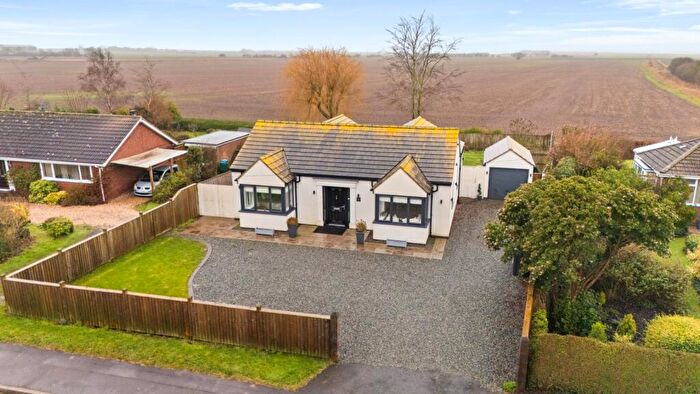
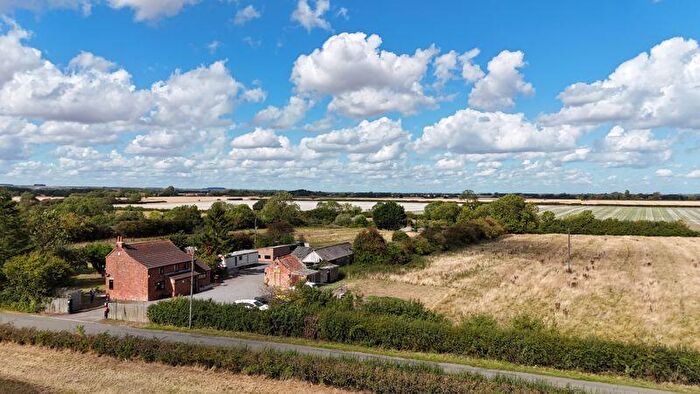
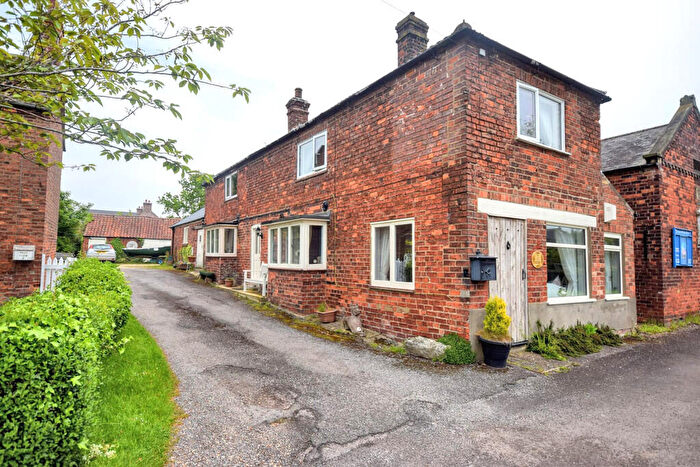
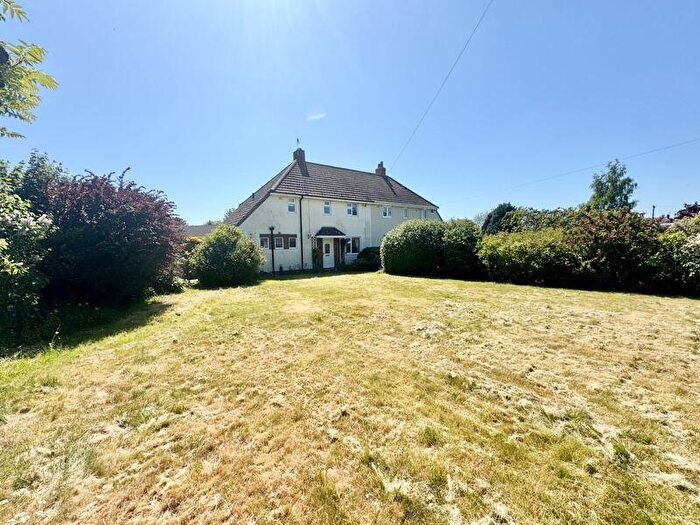
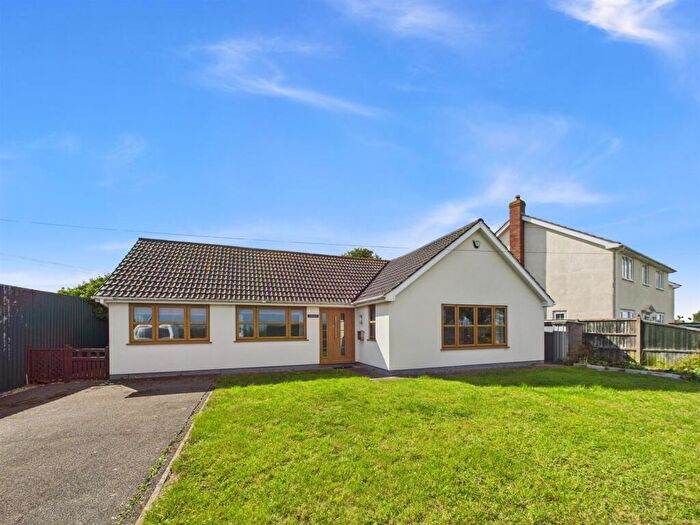
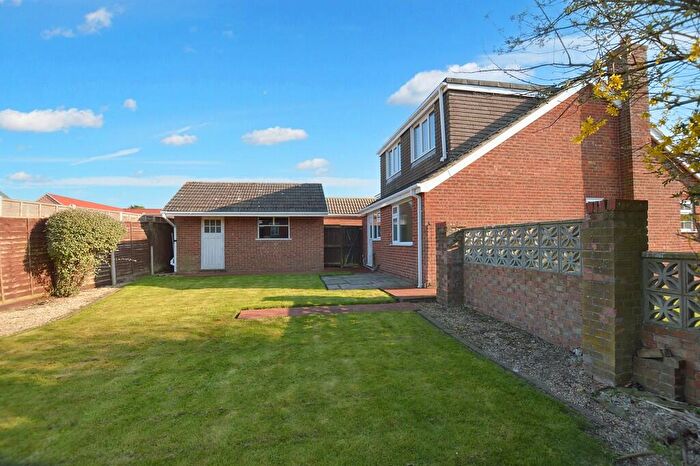
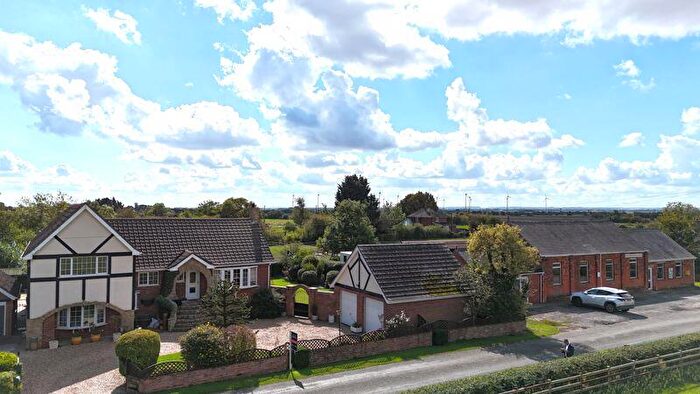
Houses for sale & to rent in Marshchapel, Louth
House Prices in Marshchapel
Properties in Marshchapel have an average house price of £313,141.00 and had 44 Property Transactions within the last 3 years¹.
Marshchapel is an area in Louth, Lincolnshire with 605 households², where the most expensive property was sold for £875,000.00.
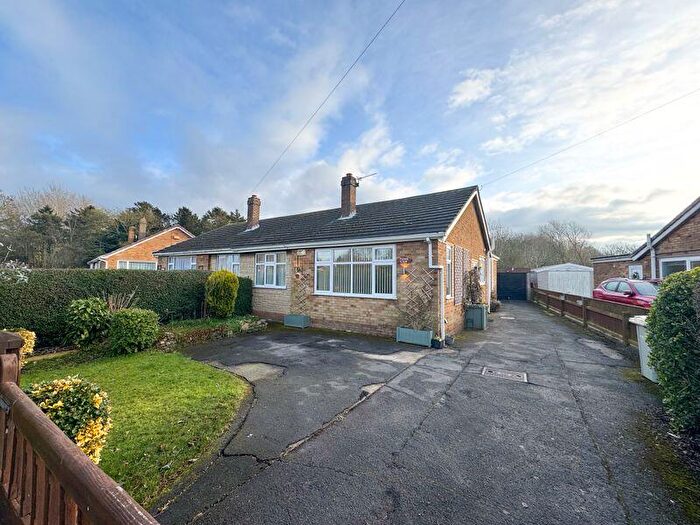
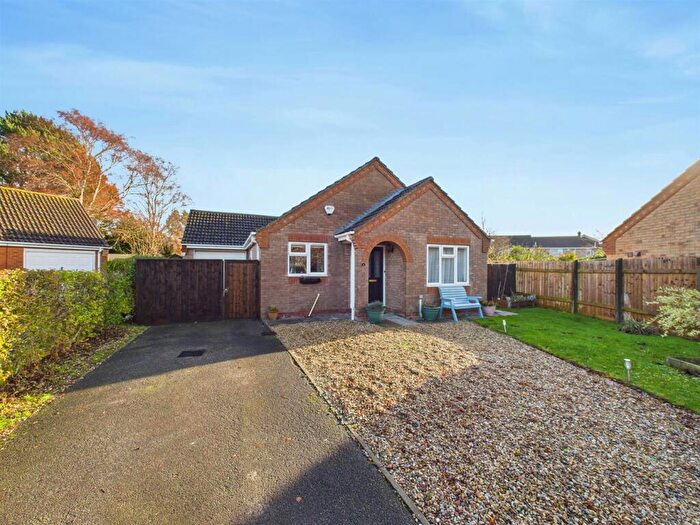
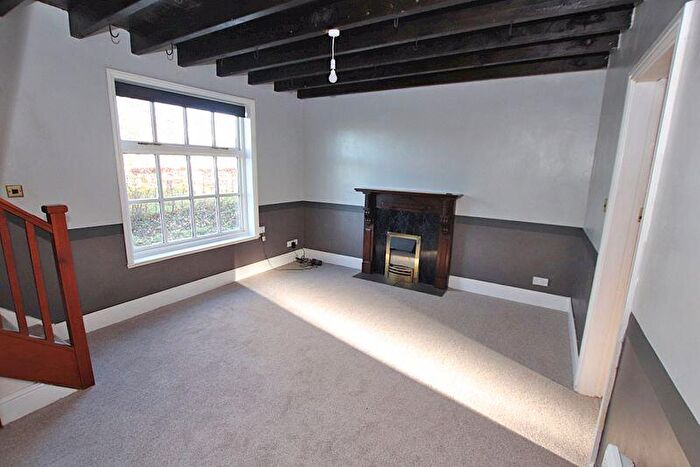
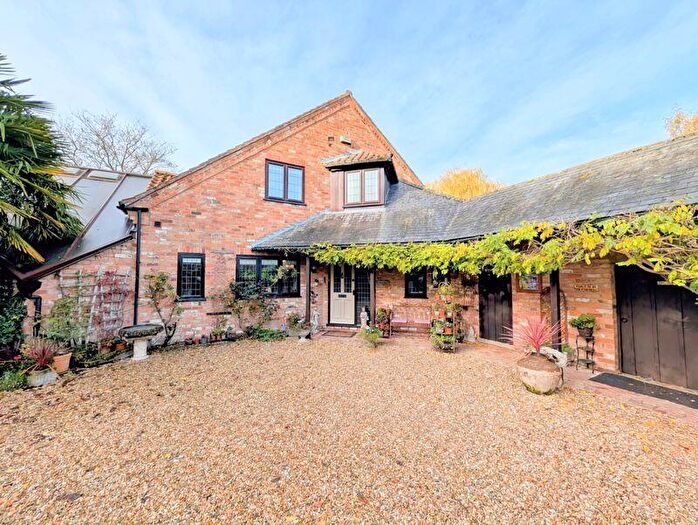
Properties for sale in Marshchapel
Roads and Postcodes in Marshchapel
Navigate through our locations to find the location of your next house in Marshchapel, Louth for sale or to rent.
| Streets | Postcodes |
|---|---|
| Austen Fen | LN11 0NX |
| Beirgate | LN11 7BG |
| Birketts Lane | LN11 0FF |
| Brickyard Cottages | LN11 7JZ |
| Buttgate | LN11 7HR LN11 7JW |
| Carters Garth Close | LN11 7HT LN11 7HY |
| Chapel Lane | LN11 7HZ |
| Church Lane | LN11 0PY LN11 0QD LN11 7JR LN11 7LX |
| Coalshore Lane | LN11 7JF |
| Conisholme Road | LN11 7JT |
| Dickens Beck Lane | LN11 0PU |
| Fen Lane | LN11 7JY LN11 7LU |
| Fire Beacon Lane | LN11 0PA |
| Firebeacon Lane | LN11 7BE |
| Grange Lane | LN11 0PD |
| High Bridge Road | LN11 0QB LN11 0QE LN11 0QF |
| High Street | LN11 0QA LN11 7HS LN11 7JA |
| Ings Lane | LN11 0PJ |
| Jacklin Close | LN11 7HA |
| King Street | LN11 0PN |
| Lamberts Row | LN11 0PH |
| Lock Road | LN11 7EU |
| Ludney Lane | LN11 7JX |
| Main Road | LN11 0PF LN11 7HX LN11 7JS LN11 7JU LN11 7LS |
| Marsh Lane | LN11 7JP |
| Mill Lane | LN11 7HU |
| Newbridge Lane | LN11 0PQ |
| North End | LN11 0QH |
| Pinfold | LN11 0QQ |
| Poors End | LN11 7JB |
| Stapes Garth | LN11 7FD |
| Whyalla Close | LN11 7JQ |
| Wragholme Road | LN11 7JD |
| Yarburgh Road | LN11 0PZ LN11 0QG |
| LN11 0PB LN11 0PG LN11 0PL LN11 0PP LN11 0PR LN11 0PW |
Transport near Marshchapel
-
Cleethorpes Station
-
Grimsby Town Station
-
New Clee Station
-
Grimsby Docks Station
-
Great Coates Station
-
Healing Station
-
Stallingborough Station
- FAQ
- Price Paid By Year
- Property Type Price
Frequently asked questions about Marshchapel
What is the average price for a property for sale in Marshchapel?
The average price for a property for sale in Marshchapel is £313,141. This amount is 25% higher than the average price in Louth. There are 378 property listings for sale in Marshchapel.
What streets have the most expensive properties for sale in Marshchapel?
The streets with the most expensive properties for sale in Marshchapel are Newbridge Lane at an average of £617,900, Ludney Lane at an average of £430,000 and Wragholme Road at an average of £351,500.
What streets have the most affordable properties for sale in Marshchapel?
The streets with the most affordable properties for sale in Marshchapel are Brickyard Cottages at an average of £115,000, Lock Road at an average of £135,000 and Poors End at an average of £145,000.
Which train stations are available in or near Marshchapel?
Some of the train stations available in or near Marshchapel are Cleethorpes, Grimsby Town and New Clee.
Property Price Paid in Marshchapel by Year
The average sold property price by year was:
| Year | Average Sold Price | Price Change |
Sold Properties
|
|---|---|---|---|
| 2025 | £242,333 | -39% |
12 Properties |
| 2024 | £337,718 | -1% |
16 Properties |
| 2023 | £341,671 | -1% |
16 Properties |
| 2022 | £346,120 | 13% |
20 Properties |
| 2021 | £300,151 | 12% |
32 Properties |
| 2020 | £263,013 | 11% |
30 Properties |
| 2019 | £234,998 | 13% |
26 Properties |
| 2018 | £204,154 | -4% |
22 Properties |
| 2017 | £213,222 | 0,4% |
27 Properties |
| 2016 | £212,272 | 7% |
20 Properties |
| 2015 | £197,228 | -12% |
31 Properties |
| 2014 | £221,338 | -3% |
25 Properties |
| 2013 | £227,900 | 34% |
15 Properties |
| 2012 | £151,500 | -21% |
17 Properties |
| 2011 | £183,491 | -0,1% |
12 Properties |
| 2010 | £183,627 | -18% |
11 Properties |
| 2009 | £215,843 | 1% |
8 Properties |
| 2008 | £214,053 | 1% |
13 Properties |
| 2007 | £211,257 | 1% |
18 Properties |
| 2006 | £208,139 | -17% |
28 Properties |
| 2005 | £243,636 | 20% |
22 Properties |
| 2004 | £195,920 | 14% |
39 Properties |
| 2003 | £168,296 | 25% |
25 Properties |
| 2002 | £126,828 | 23% |
47 Properties |
| 2001 | £97,234 | 9% |
44 Properties |
| 2000 | £88,583 | 17% |
30 Properties |
| 1999 | £73,866 | 2% |
40 Properties |
| 1998 | £72,401 | 7% |
38 Properties |
| 1997 | £67,135 | -1% |
37 Properties |
| 1996 | £67,845 | -16% |
23 Properties |
| 1995 | £78,932 | - |
16 Properties |
Property Price per Property Type in Marshchapel
Here you can find historic sold price data in order to help with your property search.
The average Property Paid Price for specific property types in the last three years are:
| Property Type | Average Sold Price | Sold Properties |
|---|---|---|
| Semi Detached House | £168,500.00 | 4 Semi Detached Houses |
| Detached House | £365,780.00 | 33 Detached Houses |
| Terraced House | £147,642.00 | 7 Terraced Houses |

