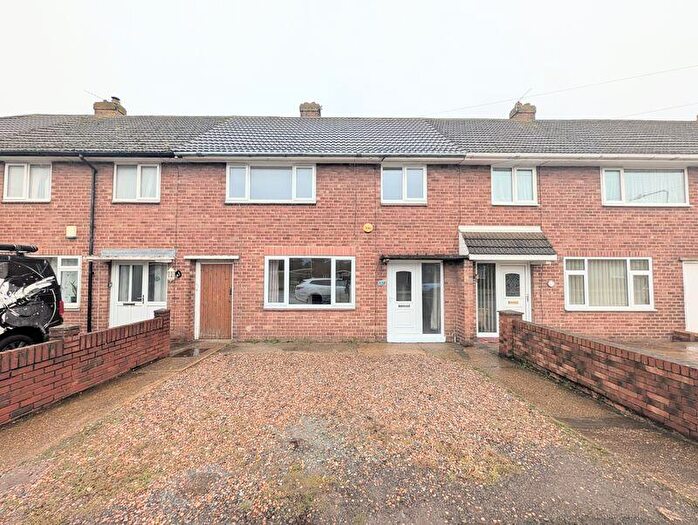
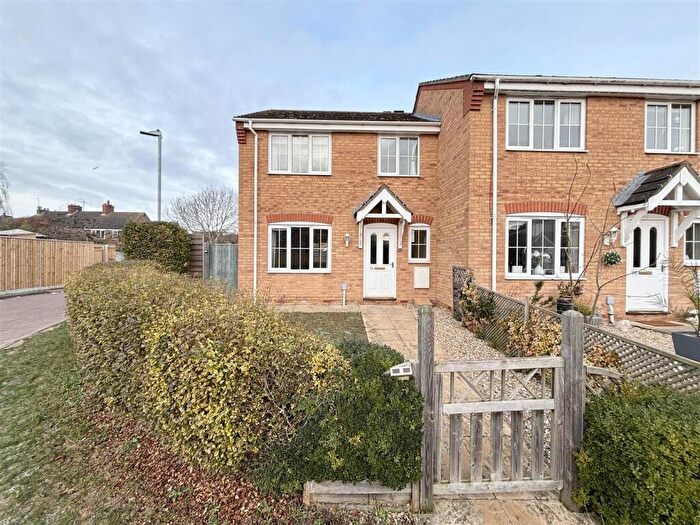
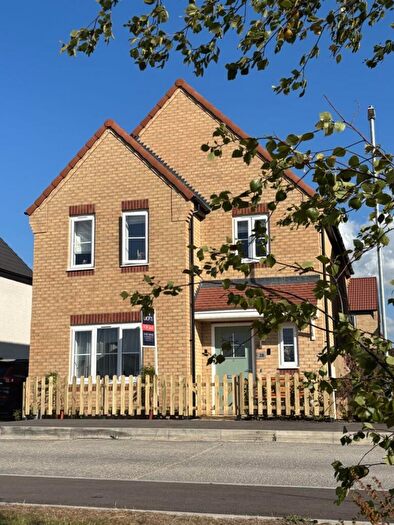
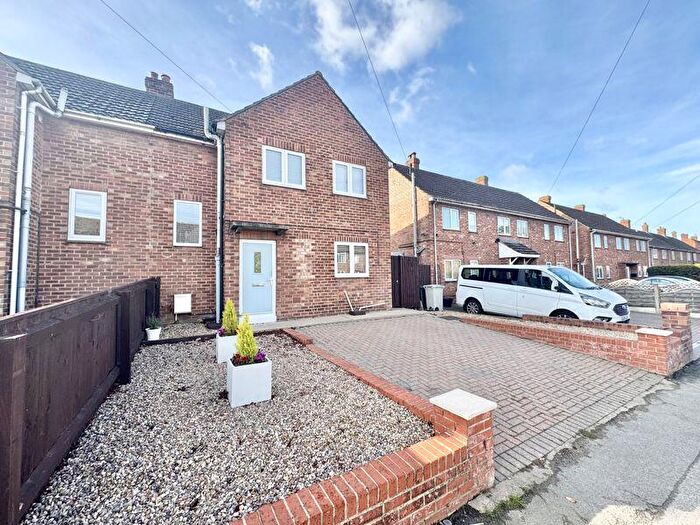
Houses for sale & to rent in St Margarets, Louth
House Prices in St Margarets
Properties in St Margarets have an average house price of £206,908.29 and had 143 Property Transactions within the last 3 years¹.
St Margarets is an area in Louth, Lincolnshire with 1,036 households², where the most expensive property was sold for £474,346.00.
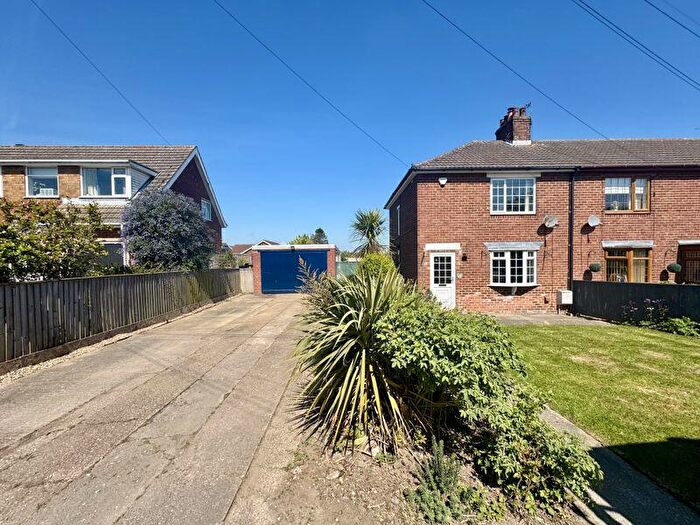
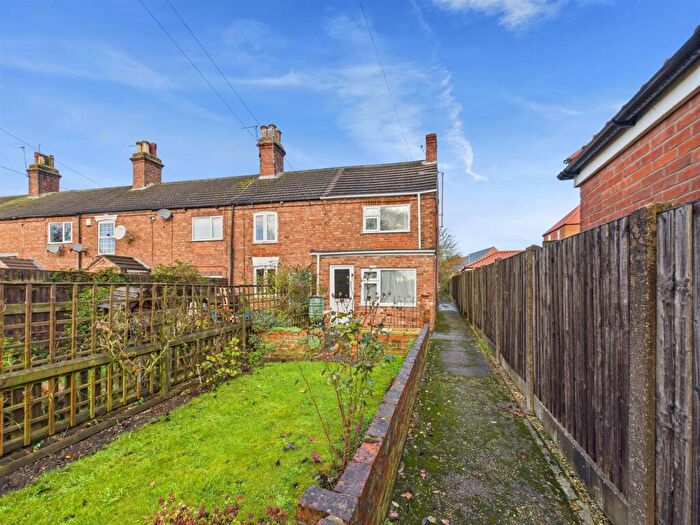
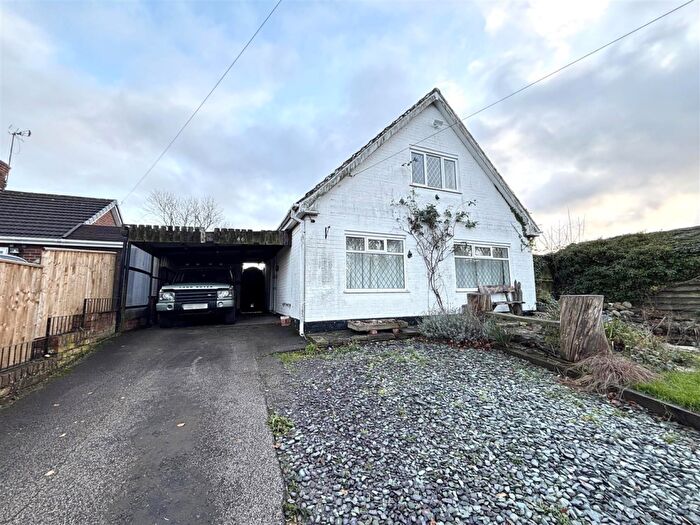
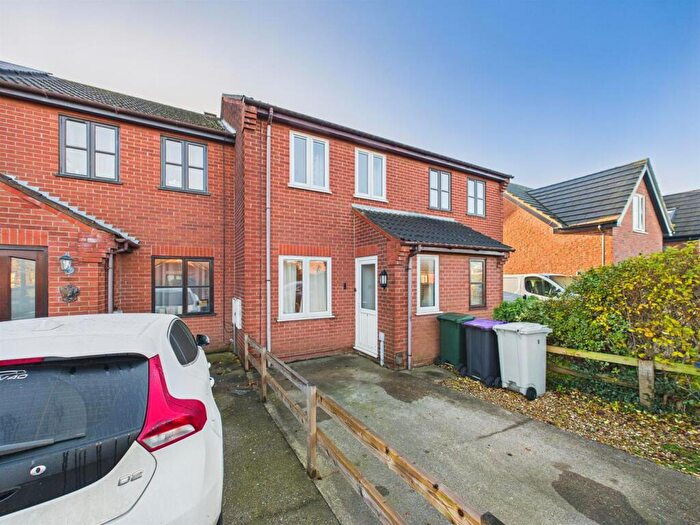
Properties for sale in St Margarets
Roads and Postcodes in St Margarets
Navigate through our locations to find the location of your next house in St Margarets, Louth for sale or to rent.
| Streets | Postcodes |
|---|---|
| Ada Way | LN11 0DH |
| Albatross Way | LN11 0ZF |
| Amanda Drive | LN11 0AZ |
| Anthony Crescent | LN11 0AY |
| Ash Close | LN11 0FL |
| Beech Grove | LN11 0BN |
| Bowers Avenue | LN11 0BQ |
| Brackenborough Court | LN11 0FB |
| Brackenborough Road | LN11 0AE LN11 0AQ |
| Canal Close | LN11 0FH |
| Charles Avenue | LN11 0BG |
| Christopher Close | LN11 0BT |
| Coronation Close | LN11 0FN |
| David Avenue | LN11 0DJ |
| Dove Close | LN11 0BZ |
| Elm Drive | LN11 0DG LN11 0DQ |
| Falcon Avenue | LN11 0ZJ |
| Fulmar Drive | LN11 0ST |
| Grosvenor Crescent | LN11 0BD |
| Grosvenor Road | LN11 0BB LN11 0BE |
| Guillemot Drive | LN11 0ZE |
| Harrier Road | LN11 0ZL |
| Hawksmede Way | LN11 0SR |
| Jenkins Close | LN11 0EE |
| Jubilee Crescent | LN11 0AJ LN11 0AL LN11 0AN LN11 0AW |
| Keddington Crescent | LN11 0AP LN11 0AR |
| Keddington Road | LN11 0AU LN11 0BA LN11 0BL |
| Kestrel Drive | LN11 0GE |
| Lime Grove | LN11 0AT |
| Lock Keepers Way | LN11 0GQ |
| Lyndon Crescent | LN11 0BJ |
| Lyndon Way | LN11 0BH |
| Mallard Ings | LN11 0FD |
| Maple Close | LN11 0DW |
| Martin Close | LN11 0SS |
| Peregrine Way | LN11 0ZH |
| Petrel Drive | LN11 0ZG |
| Plover Grove | LN11 0BW |
| Poplar Grove | LN11 0GU |
| Riverhead | LN11 0DD |
| Riverhead Road | LN11 0DA |
| Riverhead Terrace | LN11 0DB |
| Riverside Rise | LN11 0GN |
| Rookery Close | LN11 0GF |
| Shearwater Close | LN11 0SW |
| Staines Way | LN11 0DE LN11 0DF |
| Stanley Close | LN11 0DS |
| Steeple Close | LN11 0HJ |
| Swallow Drive | LN11 0DN |
| Theodore West Way | LN11 0FA |
| Ticklepenny Walk | LN11 0GG |
| Tuxworth Way | LN11 0GZ |
| Victoria Road | LN11 0BX |
| Waterside | LN11 0US |
| Willow Drive | LN11 0AH |
Transport near St Margarets
-
Cleethorpes Station
-
Grimsby Town Station
-
New Clee Station
-
Grimsby Docks Station
-
Market Rasen Station
-
Great Coates Station
- FAQ
- Price Paid By Year
- Property Type Price
Frequently asked questions about St Margarets
What is the average price for a property for sale in St Margarets?
The average price for a property for sale in St Margarets is £206,908. This amount is 19% lower than the average price in Louth. There are 1,707 property listings for sale in St Margarets.
What streets have the most expensive properties for sale in St Margarets?
The streets with the most expensive properties for sale in St Margarets are Riverside Rise at an average of £395,000, Maple Close at an average of £334,311 and Keddington Road at an average of £306,416.
What streets have the most affordable properties for sale in St Margarets?
The streets with the most affordable properties for sale in St Margarets are Jubilee Crescent at an average of £119,062, Keddington Crescent at an average of £124,000 and Canal Close at an average of £136,090.
Which train stations are available in or near St Margarets?
Some of the train stations available in or near St Margarets are Cleethorpes, Grimsby Town and New Clee.
Property Price Paid in St Margarets by Year
The average sold property price by year was:
| Year | Average Sold Price | Price Change |
Sold Properties
|
|---|---|---|---|
| 2025 | £226,815 | 22% |
33 Properties |
| 2024 | £177,264.06 | -17% |
32 Properties |
| 2023 | £208,037.18 | -2% |
39 Properties |
| 2022 | £211,950.84 | 10% |
49 Properties |
| 2021 | £191,656.41 | 4% |
46 Properties |
| 2020 | £183,926.76 | -1% |
51 Properties |
| 2019 | £185,742.7 | 1% |
80 Properties |
| 2018 | £183,700.91 | -1% |
77 Properties |
| 2017 | £184,849.29 | 13% |
78 Properties |
| 2016 | £160,184.26 | -1% |
54 Properties |
| 2015 | £161,107.32 | 20% |
41 Properties |
| 2014 | £129,217 | -5% |
67 Properties |
| 2013 | £135,336 | -2% |
49 Properties |
| 2012 | £138,239 | -6% |
25 Properties |
| 2011 | £146,361 | -6% |
35 Properties |
| 2010 | £154,903 | 21% |
31 Properties |
| 2009 | £122,162 | -14% |
35 Properties |
| 2008 | £139,516 | -21% |
31 Properties |
| 2007 | £168,654 | 12% |
45 Properties |
| 2006 | £147,583 | 1% |
60 Properties |
| 2005 | £146,466 | 12% |
36 Properties |
| 2004 | £128,567 | 7% |
65 Properties |
| 2003 | £119,777 | 31% |
37 Properties |
| 2002 | £82,478 | -3% |
70 Properties |
| 2001 | £85,338 | 21% |
53 Properties |
| 2000 | £67,326 | 12% |
65 Properties |
| 1999 | £58,955 | 4% |
86 Properties |
| 1998 | £56,366 | 4% |
67 Properties |
| 1997 | £54,165 | 15% |
75 Properties |
| 1996 | £45,888 | -6% |
52 Properties |
| 1995 | £48,628 | - |
41 Properties |
Property Price per Property Type in St Margarets
Here you can find historic sold price data in order to help with your property search.
The average Property Paid Price for specific property types in the last three years are:
| Property Type | Average Sold Price | Sold Properties |
|---|---|---|
| Semi Detached House | £186,427.91 | 43 Semi Detached Houses |
| Detached House | £272,130.22 | 51 Detached Houses |
| Terraced House | £166,058.21 | 42 Terraced Houses |
| Flat | £102,628.00 | 7 Flats |

