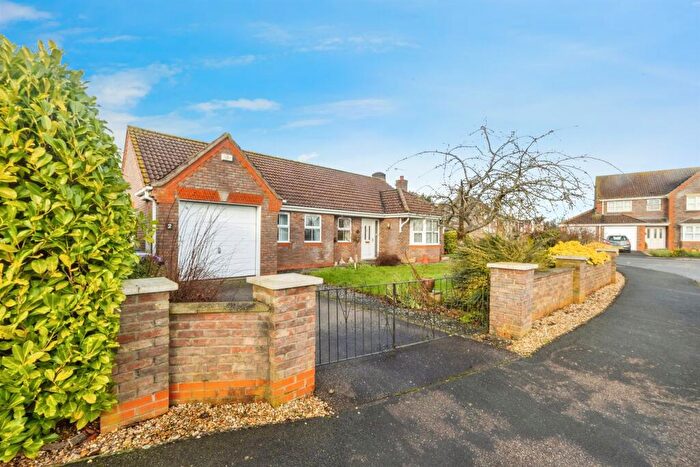
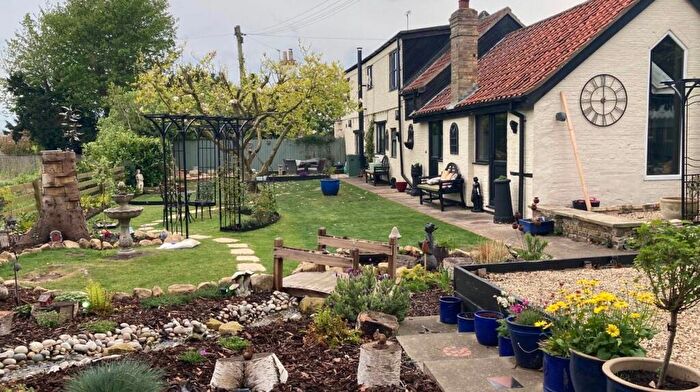
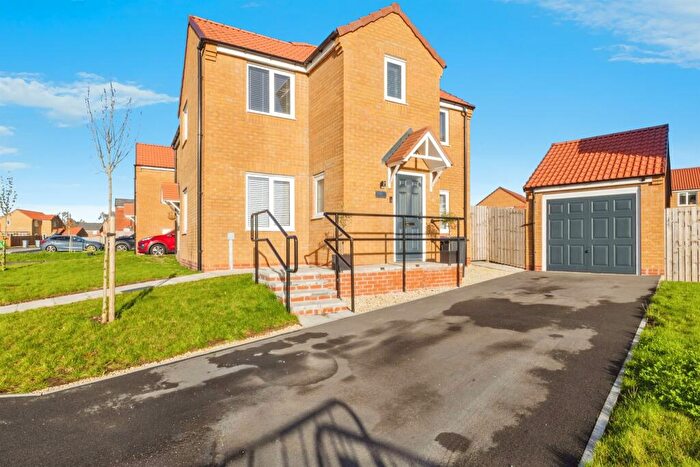
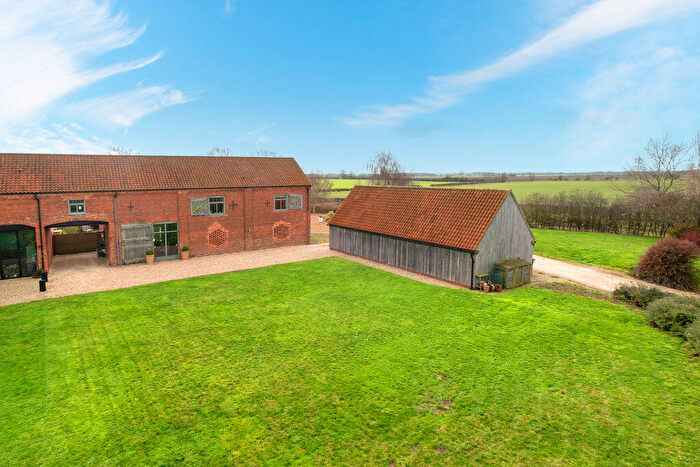
Houses for sale & to rent in Wragby, Market Rasen
House Prices in Wragby
Properties in Wragby have an average house price of £238,970.00 and had 174 Property Transactions within the last 3 years¹.
Wragby is an area in Market Rasen, Lincolnshire with 1,100 households², where the most expensive property was sold for £750,000.00.
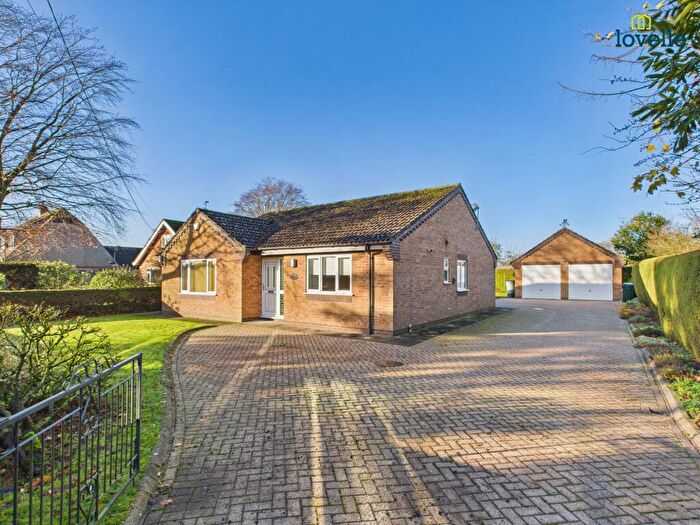
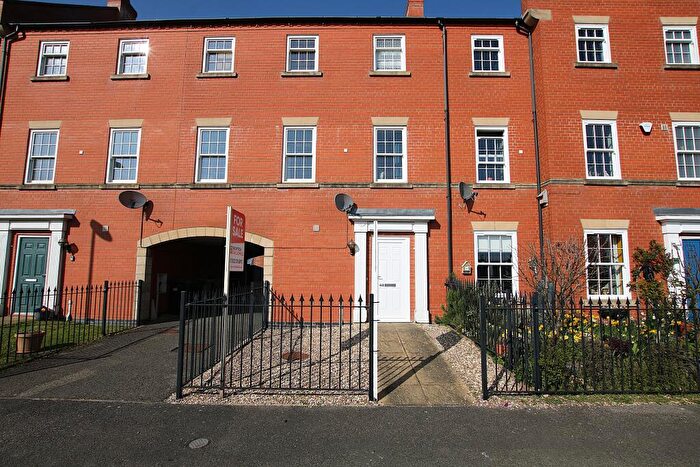
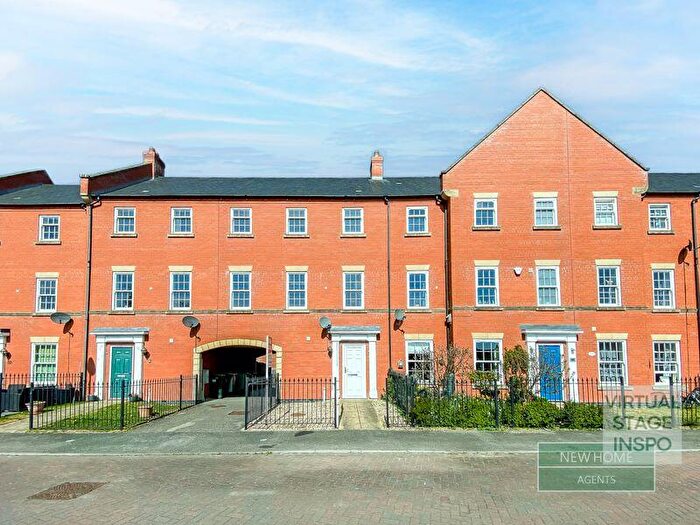
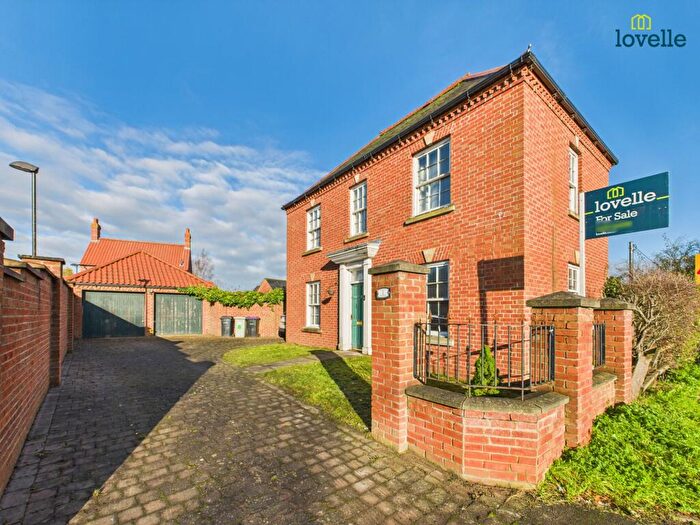
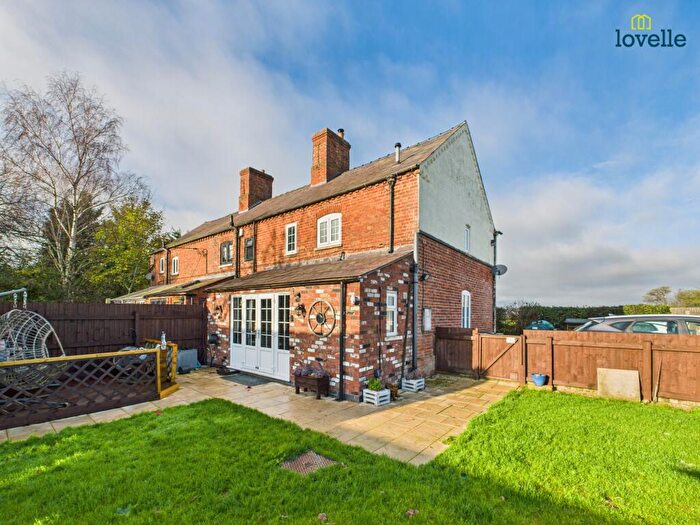
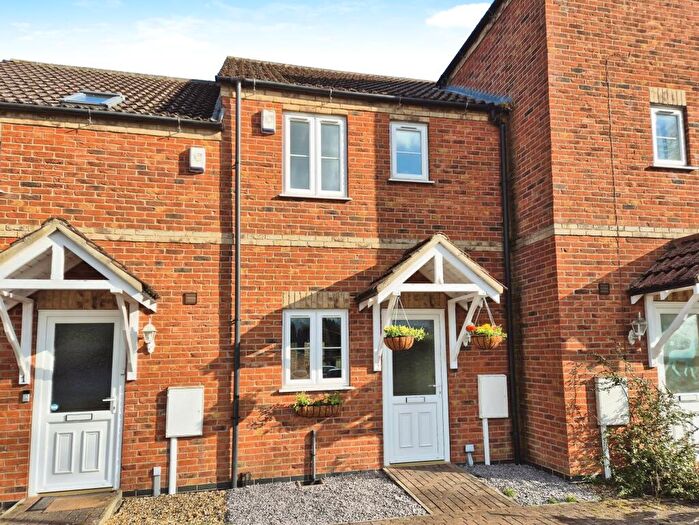
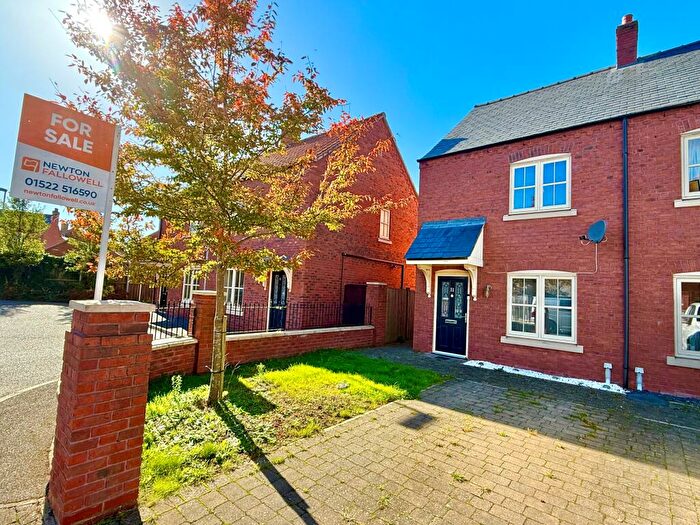
Properties for sale in Wragby
Roads and Postcodes in Wragby
Navigate through our locations to find the location of your next house in Wragby, Market Rasen for sale or to rent.
| Streets | Postcodes |
|---|---|
| Balmoral Close | LN8 5RN |
| Bardney Road | LN8 5QZ |
| Barleycorn Lane | LN8 5AN |
| Bridle Way | LN8 5YB |
| Carpenters Close | LN8 5JT |
| Cemetery Road | LN8 5RE |
| Ferndale Close | LN8 5QW |
| Finch Way | LN8 5BD |
| Goltho Lane | LN8 5JS |
| Hansards Drive | LN8 5PQ |
| Hay Way | LN8 5PP |
| Holmes Way | LN8 5PS |
| Honeysuckle Lane | LN8 5AL |
| Hoop Lane | LN8 5QB |
| Horncastle Road | LN8 5QE LN8 5QG LN8 5RB LN8 5RD |
| Jasmine Way | LN8 5AG |
| Jubilee Drive | LN8 5RH |
| Kilmister Court | LN8 5AF |
| Langton Hill | LN8 5QD |
| Lark Close | LN8 5BB |
| Lincoln Road | LN8 5ND LN8 5RW |
| Louth Road | LN8 5LB LN8 5LF LN8 5PH LN8 5QX LN8 5RX |
| Main Road | LN8 5PY |
| Manor Drive | LN8 5SL |
| Market Place | LN8 5QU |
| Mill View Court | LN8 5RJ |
| Mill View Road | LN8 5RG |
| Millbrook Lane | LN8 5AB |
| New Bodkin | LN8 5SB |
| Newton Close | LN8 5PL LN8 5PN |
| Old Grammar School Way | LN8 5DA |
| Panton Road | LN8 5LG LN8 5RU |
| Poachers Chase | LN8 5NA |
| Prince Charles Avenue | LN8 5RQ |
| Queen Elizabeth Street | LN8 5PG |
| Ropewalk | LN8 5YA |
| Routland Close | LN8 5SN |
| Sandringham Drive | LN8 5RL |
| Sawmill Lane | LN8 5PU |
| Silver Street | LN8 5PJ |
| Smithy Yard | LN8 5PR |
| South View | LN8 5RZ |
| Station Drive | LN8 5YF |
| Station Mews | LN8 5RR |
| Strubby | LN8 5QA |
| Sturton Road | LN8 5QQ |
| Swallow Drive | LN8 5BA |
| The Crescent | LN8 5RF |
| The Oaklands | LN8 5UT |
| The Terrace | LN8 5RA |
| Tiggers Orchard | LN8 5PD |
| Torrington Lane | LN8 5RY LN8 5LE |
| Turnor Close | LN8 5PE |
| Turnor Square | LN8 5QY |
| Victoria Street | LN8 5PF |
| Walk Lane | LN8 5PZ |
| Wheatsheaf Drive | LN8 5AH |
| Willingham Road | LN8 5RP |
| Willow Court | LN8 5PA |
| Wirehill Lane | LN8 5LD |
| Wold View | LN8 5RT |
| Woodland View | LN8 5RS |
| LN8 5LQ LN8 5LS LN8 5LT LN8 5PX LN8 5QL LN8 5SH LN8 5SQ LN8 5QF |
Transport near Wragby
- FAQ
- Price Paid By Year
- Property Type Price
Frequently asked questions about Wragby
What is the average price for a property for sale in Wragby?
The average price for a property for sale in Wragby is £238,970. This amount is 7% lower than the average price in Market Rasen. There are 287 property listings for sale in Wragby.
What streets have the most expensive properties for sale in Wragby?
The streets with the most expensive properties for sale in Wragby are Louth Road at an average of £362,625, The Terrace at an average of £320,000 and Willingham Road at an average of £316,000.
What streets have the most affordable properties for sale in Wragby?
The streets with the most affordable properties for sale in Wragby are Jubilee Drive at an average of £110,000, Smithy Yard at an average of £125,000 and Queen Elizabeth Street at an average of £135,250.
Which train stations are available in or near Wragby?
Some of the train stations available in or near Wragby are Market Rasen, Metheringham and Lincoln Central.
Property Price Paid in Wragby by Year
The average sold property price by year was:
| Year | Average Sold Price | Price Change |
Sold Properties
|
|---|---|---|---|
| 2025 | £241,681 | 3% |
33 Properties |
| 2024 | £233,884 | 4% |
39 Properties |
| 2023 | £224,268 | -14% |
50 Properties |
| 2022 | £255,200 | 8% |
52 Properties |
| 2021 | £235,504 | 17% |
60 Properties |
| 2020 | £195,513 | -6% |
55 Properties |
| 2019 | £206,626 | 17% |
47 Properties |
| 2018 | £171,650 | -6% |
63 Properties |
| 2017 | £182,030 | 16% |
45 Properties |
| 2016 | £152,950 | -8% |
57 Properties |
| 2015 | £164,844 | 3% |
30 Properties |
| 2014 | £159,399 | 6% |
70 Properties |
| 2013 | £149,999 | 1% |
40 Properties |
| 2012 | £148,826 | -2% |
35 Properties |
| 2011 | £151,866 | -11% |
42 Properties |
| 2010 | £167,881 | 19% |
45 Properties |
| 2009 | £136,478 | -15% |
43 Properties |
| 2008 | £156,370 | -5% |
47 Properties |
| 2007 | £164,483 | 10% |
105 Properties |
| 2006 | £147,623 | 11% |
57 Properties |
| 2005 | £131,275 | -9% |
26 Properties |
| 2004 | £143,734 | 18% |
64 Properties |
| 2003 | £117,448 | 12% |
45 Properties |
| 2002 | £103,307 | 11% |
52 Properties |
| 2001 | £91,711 | 29% |
56 Properties |
| 2000 | £64,879 | 23% |
45 Properties |
| 1999 | £50,183 | -17% |
49 Properties |
| 1998 | £58,703 | -14% |
41 Properties |
| 1997 | £67,161 | 5% |
45 Properties |
| 1996 | £63,880 | 9% |
33 Properties |
| 1995 | £58,119 | - |
30 Properties |
Property Price per Property Type in Wragby
Here you can find historic sold price data in order to help with your property search.
The average Property Paid Price for specific property types in the last three years are:
| Property Type | Average Sold Price | Sold Properties |
|---|---|---|
| Semi Detached House | £202,068.00 | 47 Semi Detached Houses |
| Detached House | £302,138.00 | 84 Detached Houses |
| Terraced House | £156,845.00 | 42 Terraced Houses |
| Flat | £116,500.00 | 1 Flat |

