
Houses for sale & to rent in Fiskerton, Market Rasen
House Prices in Fiskerton
Properties in Fiskerton have an average house price of £466,208.00 and had 12 Property Transactions within the last 3 years¹.
Fiskerton is an area in Market Rasen, Lincolnshire with 116 households², where the most expensive property was sold for £1,050,000.00.
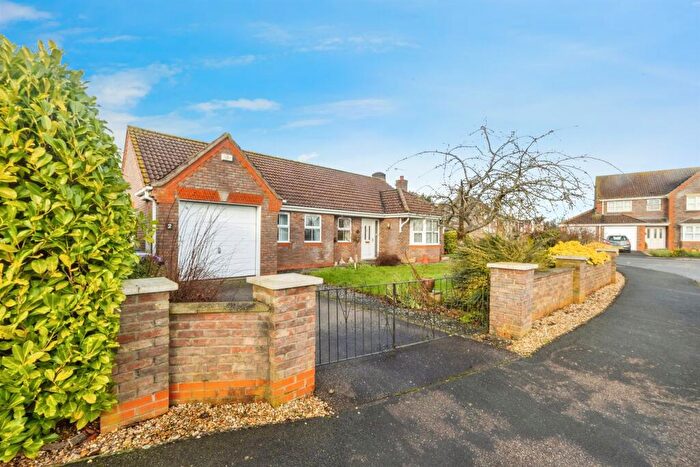
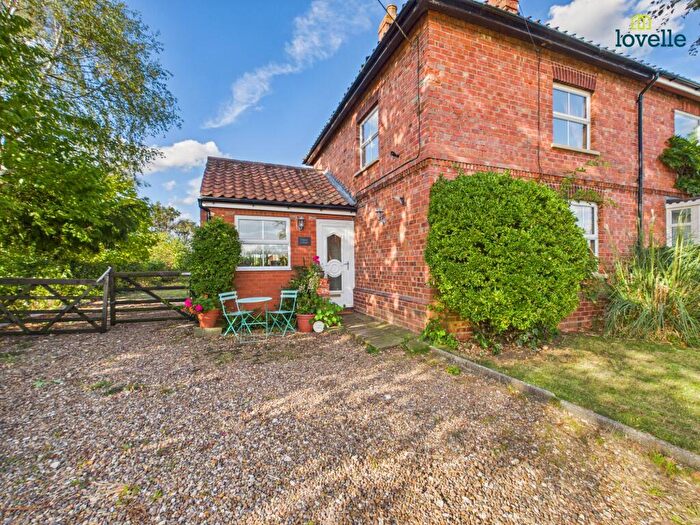
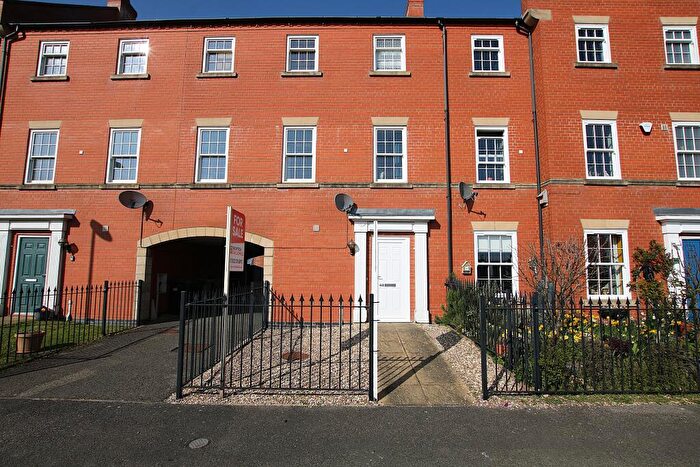
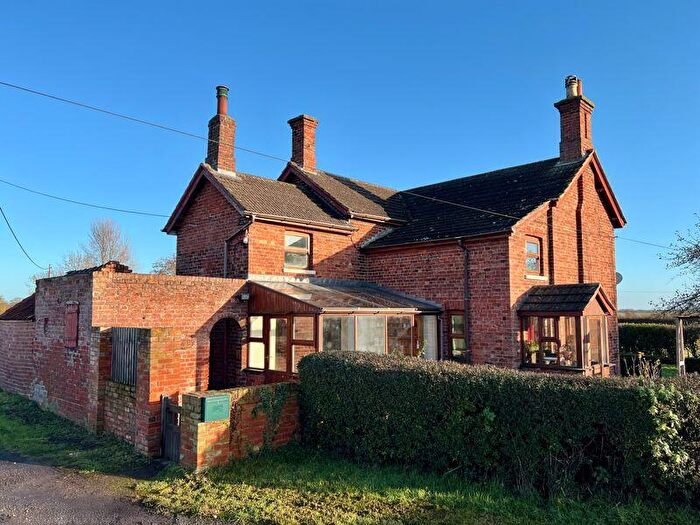
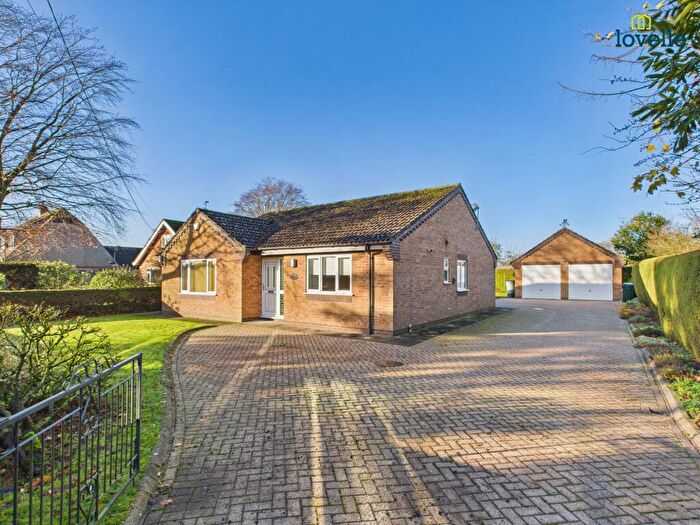
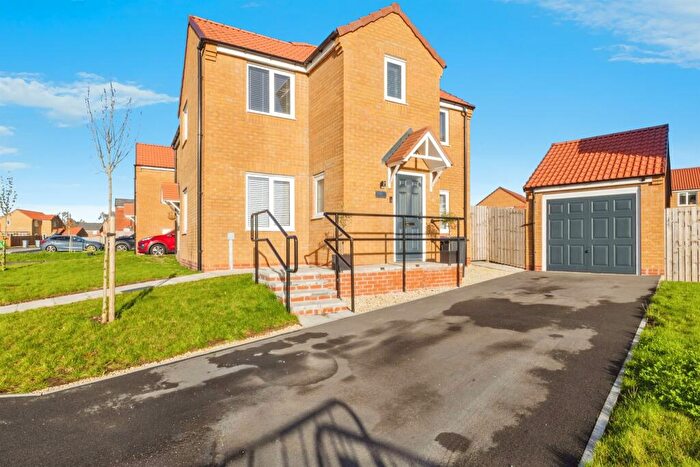
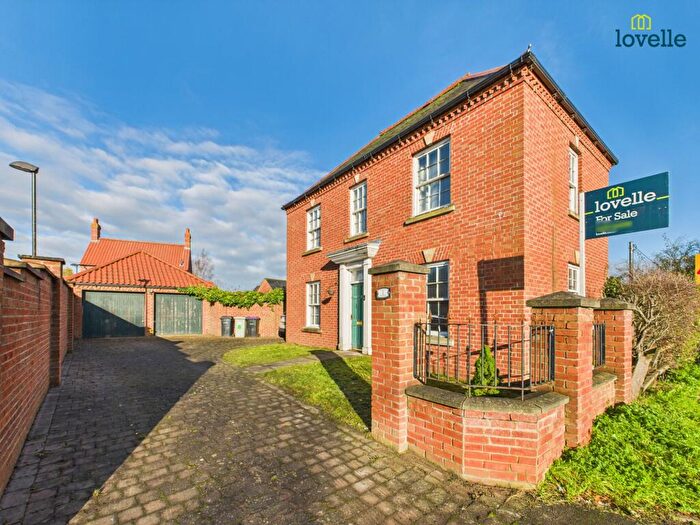
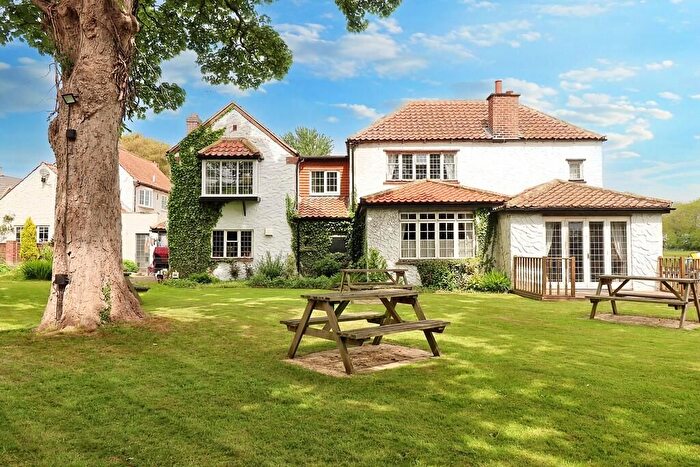
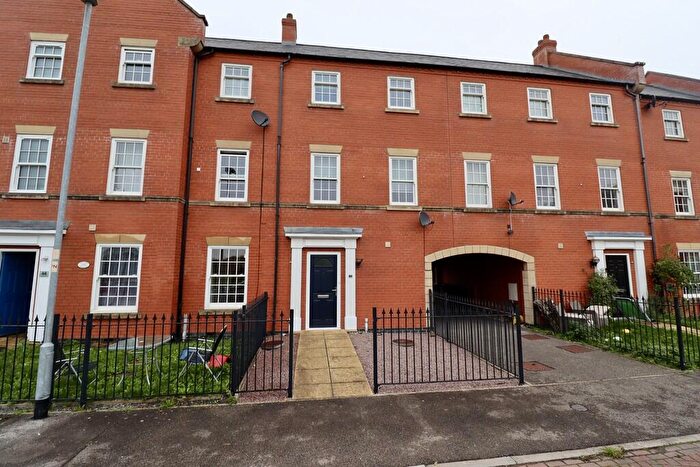
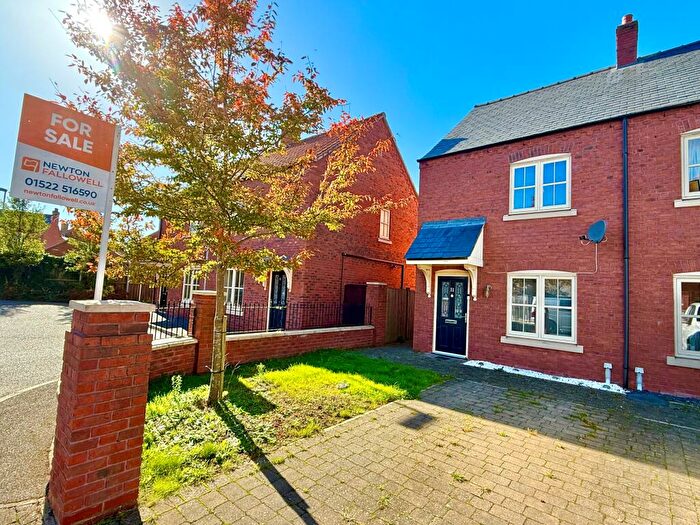
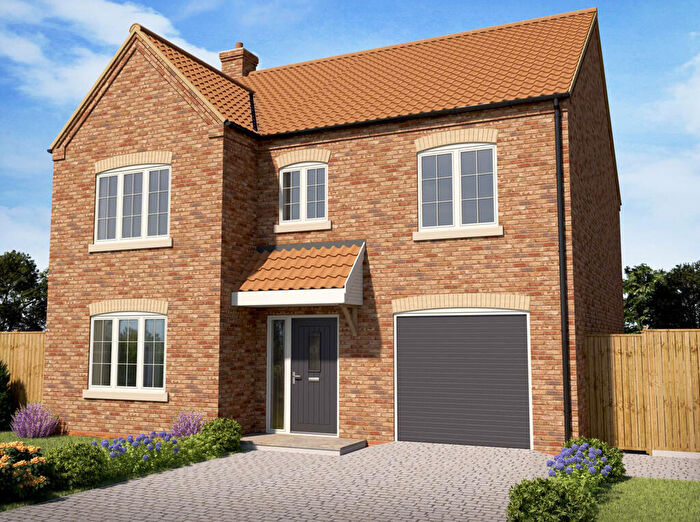
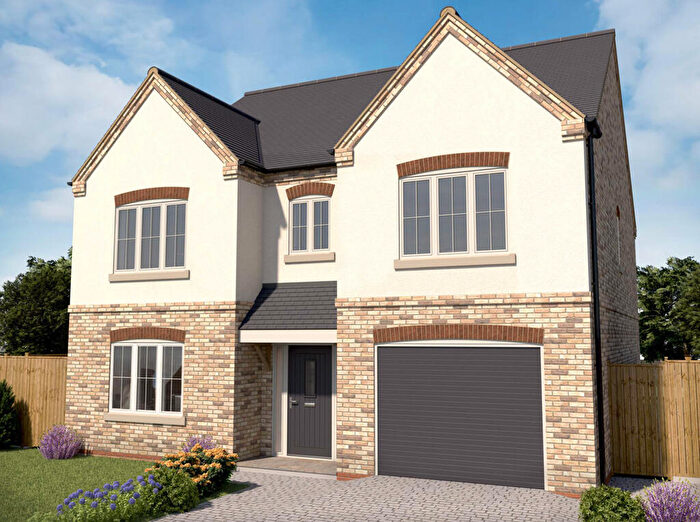
Properties for sale in Fiskerton
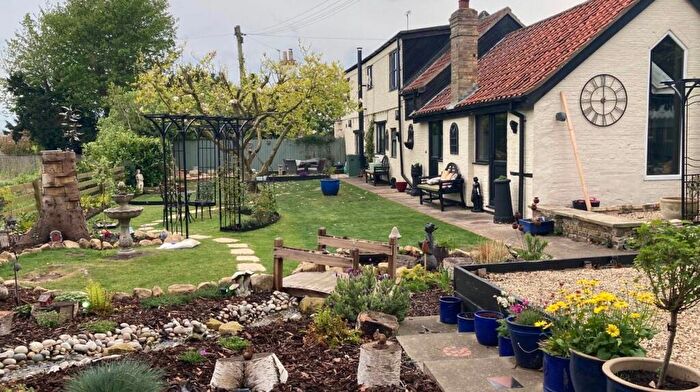
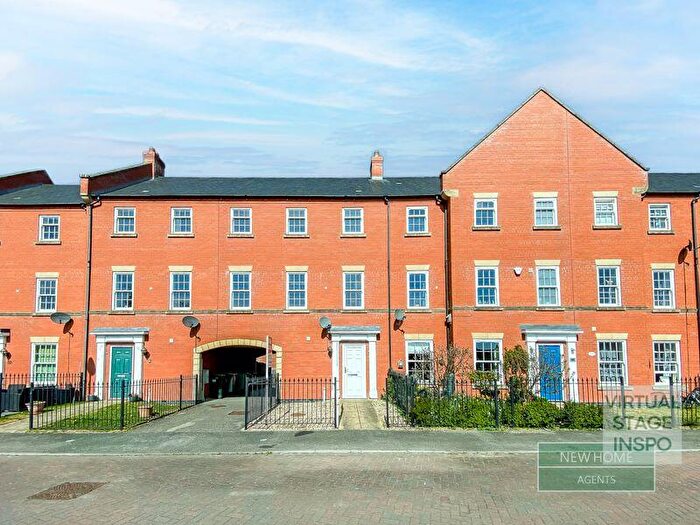
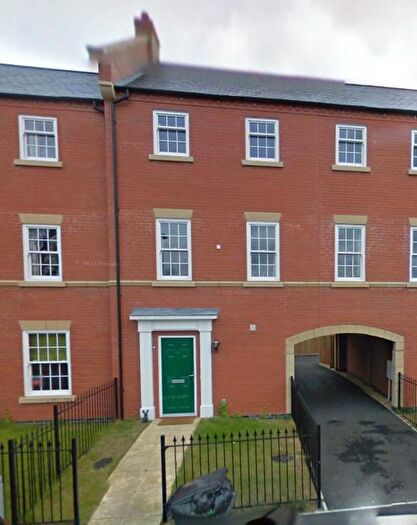
![]()
If you are looking to sell your house, let it out, or receive a property valuation, an expert can help you.
Click the button below to get started.


Roads and Postcodes in Fiskerton
Navigate through our locations to find the location of your next house in Fiskerton, Market Rasen for sale or to rent.
| Streets | Postcodes |
|---|---|
| Bardney Road | LN8 5JE |
| Lincoln Road | LN8 5NF |
| Lissington Road | LN8 5NG |
| Shortwood Lane | LN8 5NR |
| LN8 5JD LN8 5NJ LN8 5NS LN8 5NW LN8 5SG |
Transport near Fiskerton

- FAQ
- Price Paid By Year
- Property Type Price
Frequently asked questions about Fiskerton
What is the average price for a property for sale in Fiskerton?
The average price for a property for sale in Fiskerton is £466,208. This amount is 81% higher than the average price in Market Rasen. There are 234 property listings for sale in Fiskerton.
Which train stations are available in or near Fiskerton?
Some of the train stations available in or near Fiskerton are Market Rasen, Lincoln Central and Metheringham.
Property Price Paid in Fiskerton by Year
The average sold property price by year was:
| Year | Average Sold Price | Price Change |
Sold Properties
|
|---|---|---|---|
| 2025 | £328,166 | -76% |
3 Properties |
| 2024 | £577,500 | 16% |
1 Property |
| 2023 | £486,500 | -10% |
5 Properties |
| 2022 | £533,333 | 41% |
3 Properties |
| 2021 | £315,008 | 3% |
6 Properties |
| 2020 | £306,381 | 30% |
8 Properties |
| 2019 | £213,375 | -43% |
4 Properties |
| 2018 | £306,085 | 31% |
7 Properties |
| 2017 | £210,000 | -20% |
2 Properties |
| 2016 | £251,750 | -24% |
4 Properties |
| 2015 | £313,000 | 3% |
4 Properties |
| 2014 | £302,750 | -2% |
4 Properties |
| 2013 | £308,333 | 10% |
3 Properties |
| 2011 | £279,000 | 53% |
1 Property |
| 2010 | £131,833 | -68% |
6 Properties |
| 2009 | £221,600 | -50% |
5 Properties |
| 2008 | £333,500 | 15% |
2 Properties |
| 2007 | £285,000 | 47% |
2 Properties |
| 2006 | £150,000 | 17% |
1 Property |
| 2005 | £125,000 | -60% |
2 Properties |
| 2004 | £199,650 | -148% |
3 Properties |
| 2003 | £495,000 | 78% |
1 Property |
| 2002 | £110,500 | 9% |
4 Properties |
| 2001 | £100,500 | 50% |
5 Properties |
| 2000 | £50,125 | -66% |
4 Properties |
| 1999 | £83,000 | -40% |
4 Properties |
| 1998 | £116,250 | 18% |
2 Properties |
| 1997 | £95,666 | 42% |
3 Properties |
| 1996 | £55,250 | 12% |
4 Properties |
| 1995 | £48,500 | - |
2 Properties |
Property Price per Property Type in Fiskerton
Here you can find historic sold price data in order to help with your property search.
The average Property Paid Price for specific property types in the last three years are:
| Property Type | Average Sold Price | Sold Properties |
|---|---|---|
| Detached House | £491,090.00 | 11 Detached Houses |
| Terraced House | £192,500.00 | 1 Terraced House |