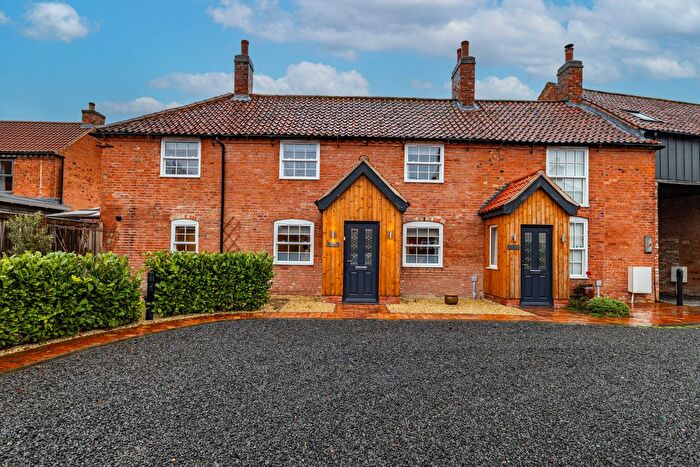
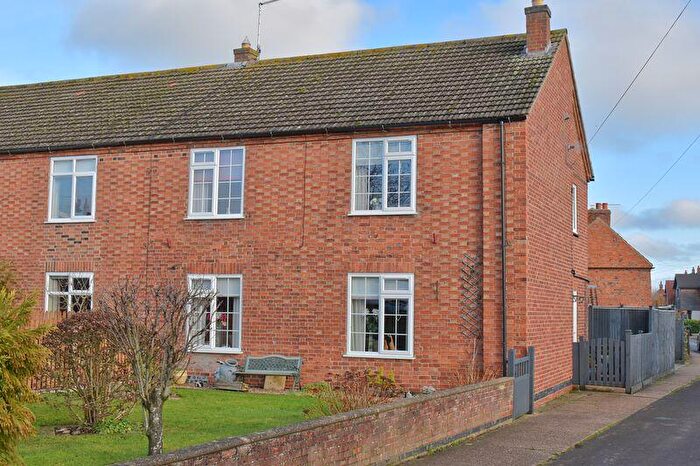
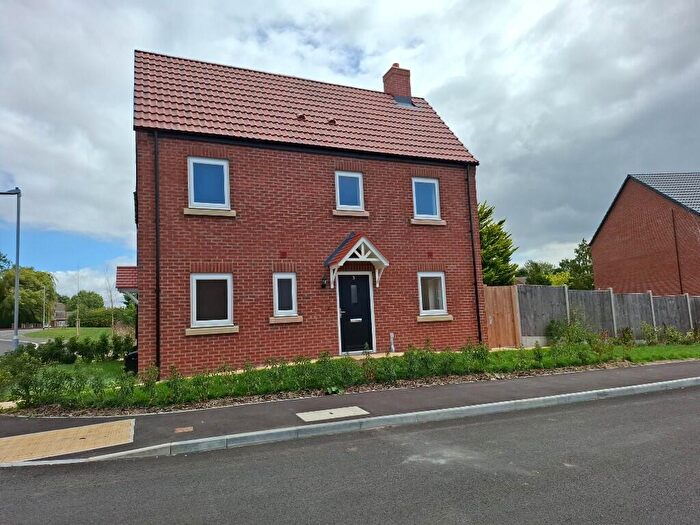
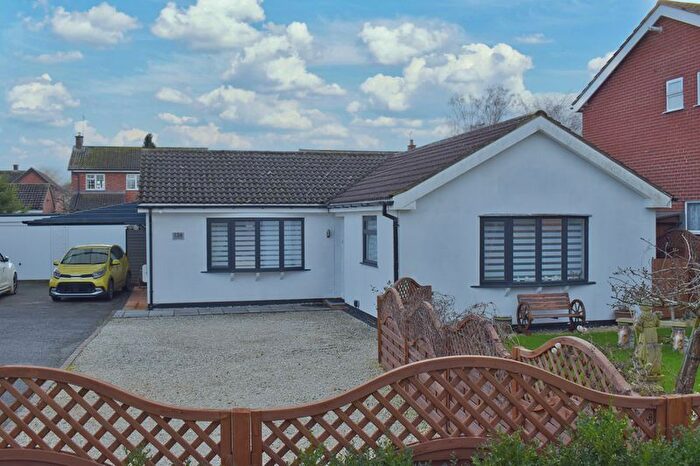
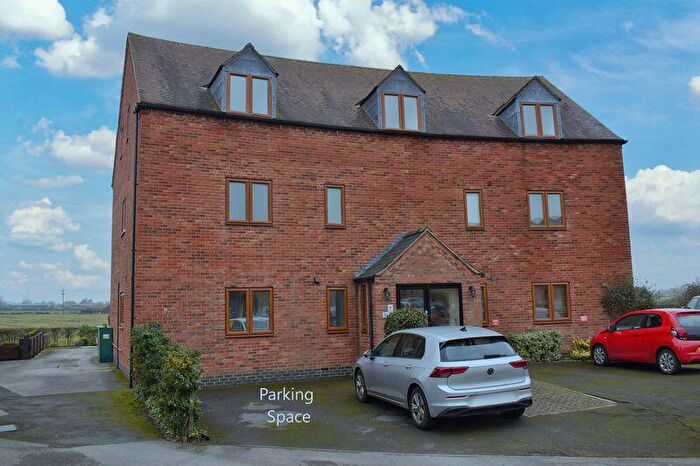
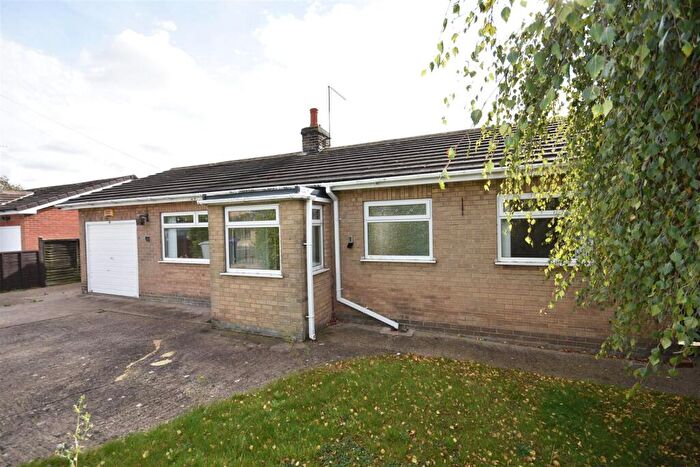
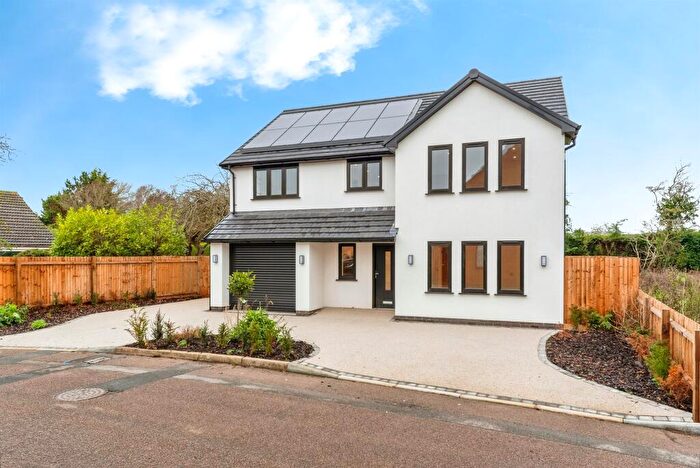
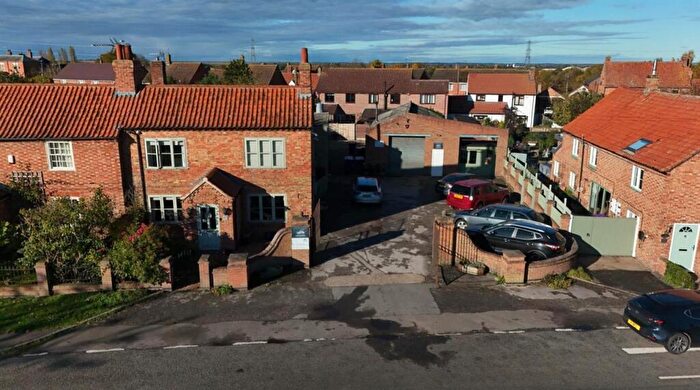
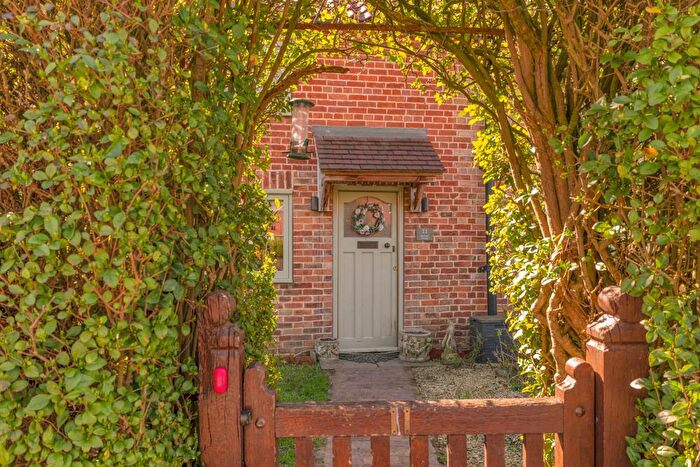
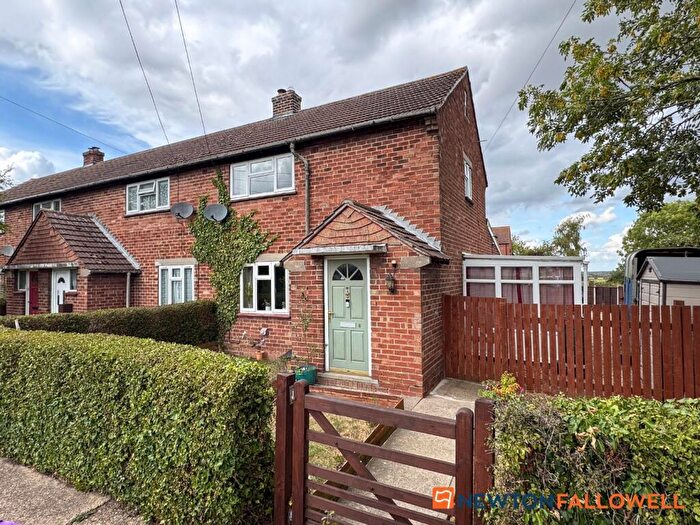
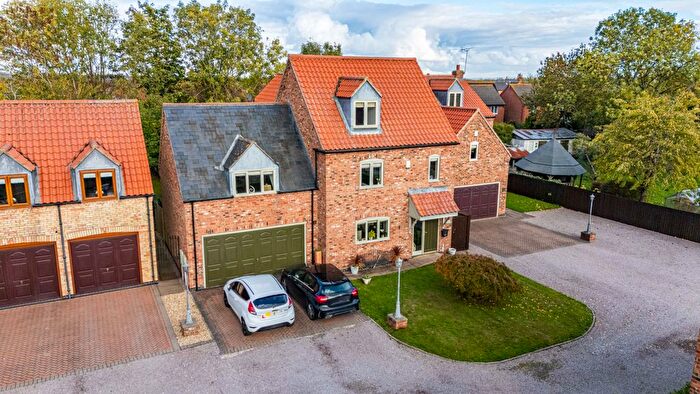
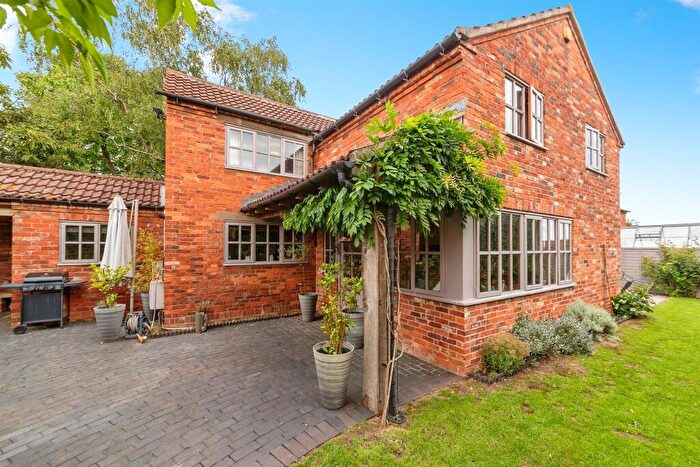
Houses for sale & to rent in Saxonwell, Newark
House Prices in Saxonwell
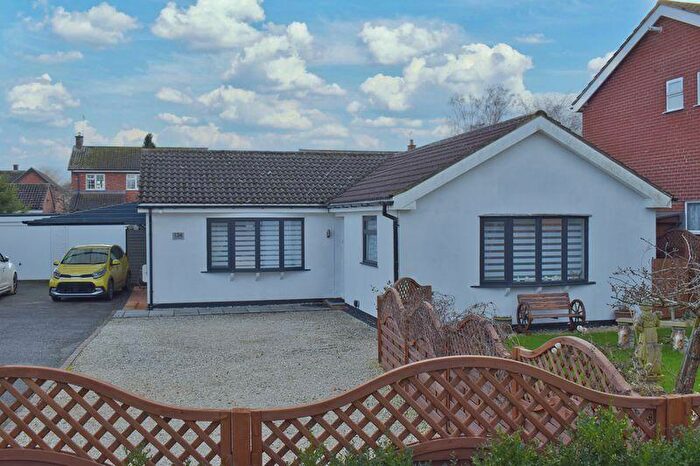
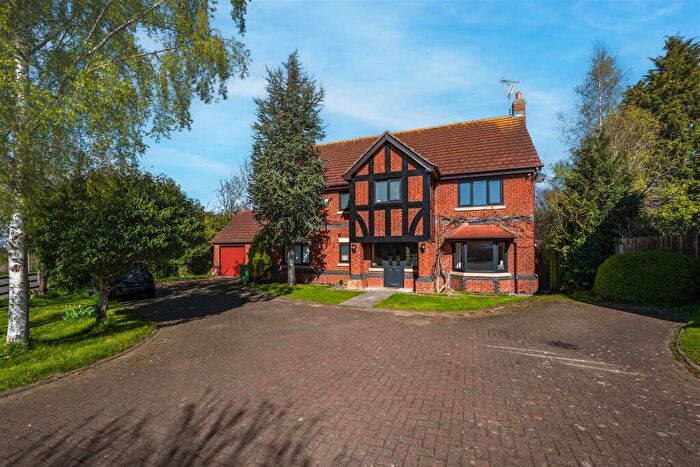
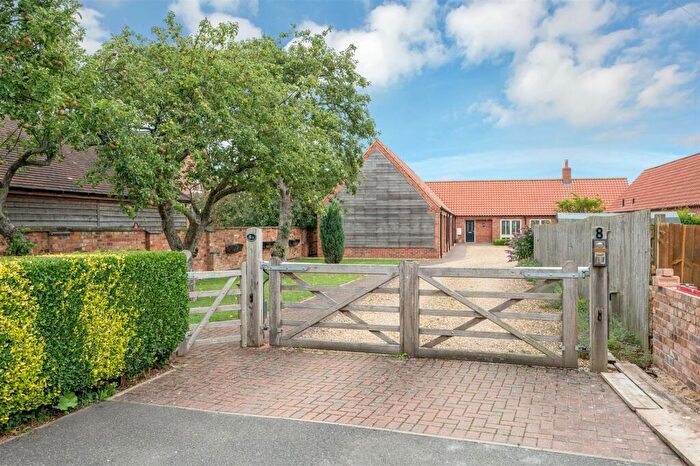
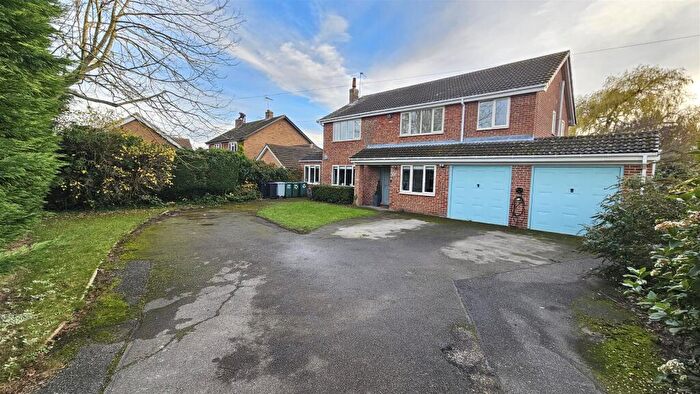
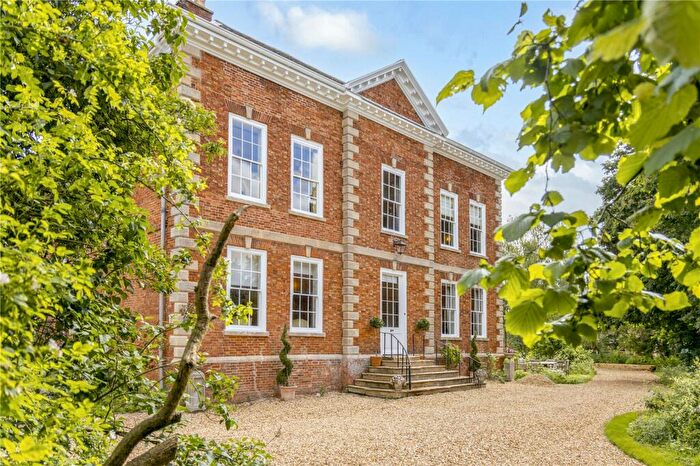
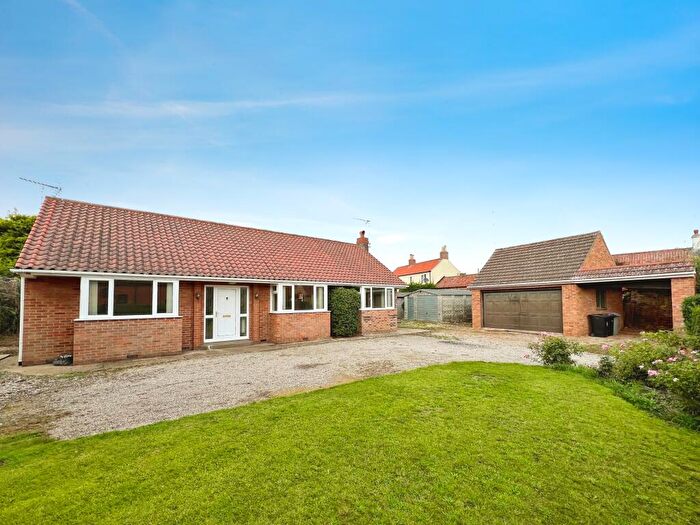
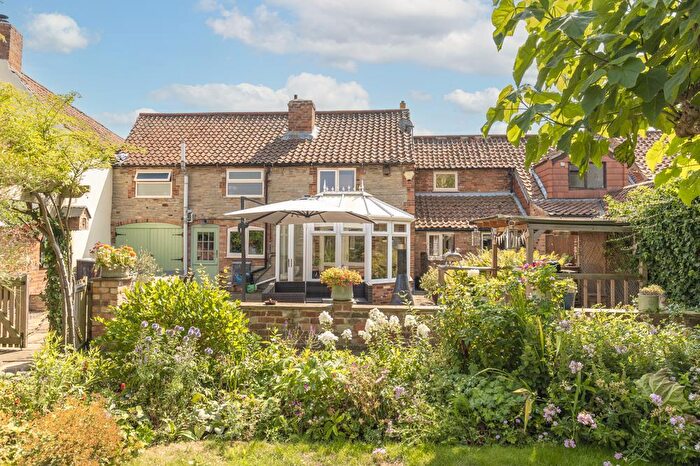
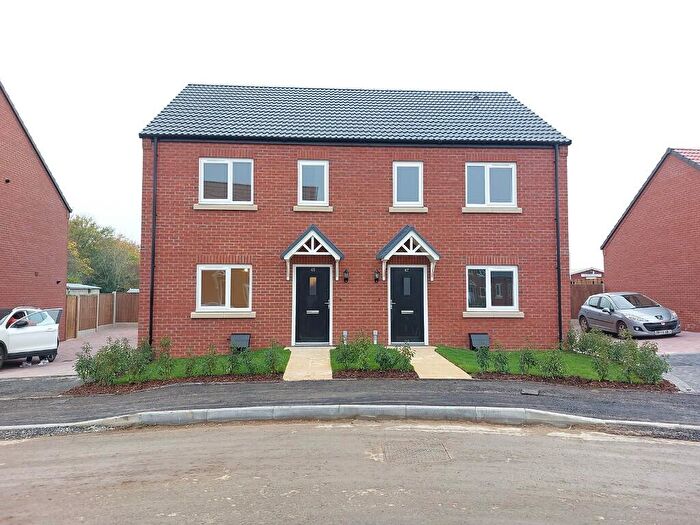
Properties in Saxonwell have an average house price of £453,434.00 and had 103 Property Transactions within the last 3 years¹.
Saxonwell is an area in Newark, Lincolnshire with 965 households², where the most expensive property was sold for £910,000.00.
Properties for sale in Saxonwell
Roads and Postcodes in Saxonwell
Navigate through our locations to find the location of your next house in Saxonwell, Newark for sale or to rent.
| Streets | Postcodes |
|---|---|
| Acklands Lane | NG23 5EW |
| Alexandra Close | NG23 5DH |
| Back Lane | NG23 5DT NG23 5HF |
| Bakers Lane | NG23 5HL |
| Bennington Close | NG23 5HA |
| Bennington Lane | NG23 5HG |
| Carriage Close | NG23 5EF |
| Chetwynd Bungalows | NG23 5HX |
| Church Lane | NG23 5EU NG23 5HN |
| Church Street | NG23 5EN NG23 5ES |
| Claypole Lane | NG23 5HZ |
| Costa Row | NG23 5DY |
| Doddington Lane | NG23 5JB |
| Drury Park | NG23 5EY |
| Dysart Grange | NG23 5GD |
| Elm Close | NG23 5EZ |
| Farbrooke Gardens | NG23 5GE |
| Fen Lane | NG23 5EA NG23 5ED |
| Grange Lane | NG23 5JZ |
| Green Lane | NG23 5HY |
| Hardwick Gardens | NG23 5FY |
| Headland Park | NG23 5FN |
| High Meadow | NG23 5JD |
| Kirtons Lane | NG23 5DX |
| Lilley Street | NG23 5EJ |
| Long Lane | NG23 5HH |
| Main Road | NG23 5DJ NG23 5EH |
| Main Street | NG23 5HU |
| Manor Drive | NG23 5GZ |
| Manor House Lane | NG23 5JA |
| Meadows Close | NG23 5EQ |
| Mills Close | NG23 5ER |
| Newton Park | NG23 5FE |
| Oak Tree Close | NG23 5HB |
| Oliver Road | NG23 5EP |
| Orchard Park | NG23 5DQ |
| Pinfold Court | NG23 5JW |
| Riverview | NG23 5JF |
| Saxonwell Court | NG23 5GG |
| Sewstern Lane | NG23 5EX |
| Sparrow Lane | NG23 5DL |
| Squires View | NG23 5FX |
| Summerfield Close | NG23 5JN |
| Swallows Court | NG23 5FD |
| The Maples | NG23 5FP |
| The Meadows | NG23 5EL |
| The Paddocks | NG23 5DZ |
| The Pastures | NG23 5EG |
| The Peacocks | NG23 5FB |
| Town Street | NG23 5HJ NG23 5HQ |
| Vale View | NG23 5JE |
| Valley Lane | NG23 5EE NG23 5FR |
| Vicarage Lane | NG23 5DN |
| Welbournes Close | NG23 5DR |
| Welbournes Lane | NG23 5DP |
| Westborough Lane | NG23 5HD |
| Wheatsheaf Lane | NG23 5DU |
| Willow Court | NG23 5FT |
| Winters Lane | NG23 5DW |
| Witham Road | NG23 5DS |
| Witham Way | NG23 5GS |
Transport near Saxonwell
-
Bottesford Station
-
Elton and Orston Station
-
Newark North Gate Station
-
Newark Castle Station
-
Aslockton Station
-
Grantham Station
-
Rolleston Station
-
Fiskerton Station
-
Bleasby Station
-
Bingham Station
- FAQ
- Price Paid By Year
- Property Type Price
Frequently asked questions about Saxonwell
What is the average price for a property for sale in Saxonwell?
The average price for a property for sale in Saxonwell is £453,434. This amount is 15% higher than the average price in Newark. There are 343 property listings for sale in Saxonwell.
What streets have the most expensive properties for sale in Saxonwell?
The streets with the most expensive properties for sale in Saxonwell are Long Lane at an average of £843,000, Pinfold Court at an average of £745,000 and Oak Tree Close at an average of £700,000.
What streets have the most affordable properties for sale in Saxonwell?
The streets with the most affordable properties for sale in Saxonwell are Summerfield Close at an average of £227,000, Oliver Road at an average of £280,000 and Mills Close at an average of £285,000.
Which train stations are available in or near Saxonwell?
Some of the train stations available in or near Saxonwell are Bottesford, Elton and Orston and Newark North Gate.
Property Price Paid in Saxonwell by Year
The average sold property price by year was:
| Year | Average Sold Price | Price Change |
Sold Properties
|
|---|---|---|---|
| 2025 | £473,235 | -2% |
34 Properties |
| 2024 | £484,175 | 20% |
40 Properties |
| 2023 | £387,820 | -6% |
29 Properties |
| 2022 | £410,989 | 7% |
47 Properties |
| 2021 | £381,390 | 19% |
66 Properties |
| 2020 | £308,979 | -13% |
41 Properties |
| 2019 | £348,176 | 3% |
34 Properties |
| 2018 | £336,794 | 7% |
39 Properties |
| 2017 | £313,844 | 8% |
29 Properties |
| 2016 | £287,332 | -10% |
42 Properties |
| 2015 | £316,222 | 1% |
49 Properties |
| 2014 | £313,521 | 18% |
52 Properties |
| 2013 | £255,786 | -3% |
52 Properties |
| 2012 | £264,697 | -5% |
35 Properties |
| 2011 | £278,348 | 0,1% |
41 Properties |
| 2010 | £278,010 | 0,3% |
41 Properties |
| 2009 | £277,094 | -23% |
26 Properties |
| 2008 | £340,444 | 19% |
27 Properties |
| 2007 | £275,442 | 7% |
51 Properties |
| 2006 | £255,181 | -1% |
43 Properties |
| 2005 | £257,347 | 11% |
56 Properties |
| 2004 | £228,558 | 17% |
79 Properties |
| 2003 | £190,124 | 19% |
57 Properties |
| 2002 | £153,488 | 3% |
55 Properties |
| 2001 | £148,290 | 27% |
50 Properties |
| 2000 | £108,207 | -1% |
39 Properties |
| 1999 | £109,034 | -0,4% |
48 Properties |
| 1998 | £109,450 | 8% |
33 Properties |
| 1997 | £100,714 | 3% |
42 Properties |
| 1996 | £97,386 | 1% |
50 Properties |
| 1995 | £96,502 | - |
40 Properties |
Property Price per Property Type in Saxonwell
Here you can find historic sold price data in order to help with your property search.
The average Property Paid Price for specific property types in the last three years are:
| Property Type | Average Sold Price | Sold Properties |
|---|---|---|
| Semi Detached House | £281,700.00 | 15 Semi Detached Houses |
| Detached House | £489,421.00 | 85 Detached Houses |
| Terraced House | £292,500.00 | 3 Terraced Houses |

