
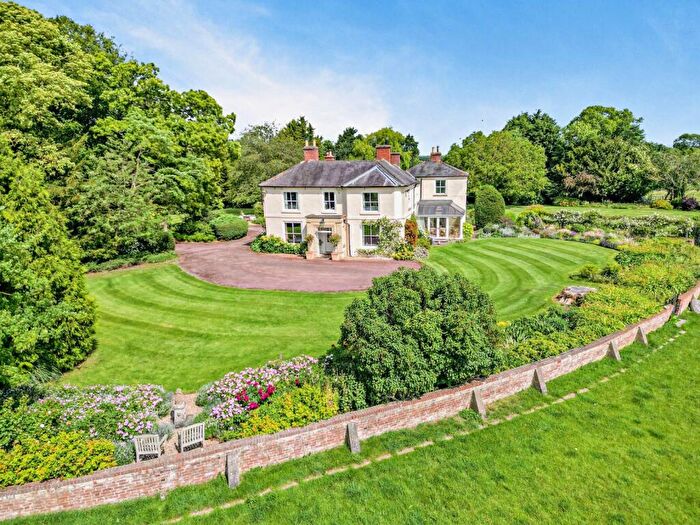
Houses for sale & to rent in Farndon, Nottingham
House Prices in Farndon
Properties in Farndon have an average house price of £590k and had 1 Property Transaction within the last 3 years¹.
Farndon is an area in Nottingham, Nottinghamshire with 59 households², where the most expensive property was sold for £590k.
Properties for sale in Farndon
Previously listed properties in Farndon
Roads and Postcodes in Farndon
Navigate through our locations to find the location of your next house in Farndon, Nottingham for sale or to rent.
Transport near Farndon

- FAQ
- Price Paid By Year
- Property Type Price
Frequently asked questions about Farndon
What is the average price for a property for sale in Farndon?
The average price for a property for sale in Farndon is £590,000. This amount is 109% higher than the average price in Nottingham. There are 2 property listings for sale in Farndon.
Which train stations are available in or near Farndon?
Some of the train stations available in or near Farndon are Bottesford, Elton and Orston and Aslockton.
Property Price Paid in Farndon by Year
The average sold property price by year was:
| Year | Average Sold Price | Price Change |
Sold Properties
|
|---|---|---|---|
| 2026 | £590,000 | 41% |
1 Property |
| 2022 | £345,350 | -63% |
4 Properties |
| 2021 | £563,750 | 52% |
2 Properties |
| 2019 | £272,333 | -35% |
3 Properties |
| 2018 | £367,500 | -9% |
2 Properties |
| 2016 | £400,000 | -25% |
3 Properties |
| 2014 | £500,000 | 32% |
1 Property |
| 2013 | £340,000 | 13% |
1 Property |
| 2012 | £297,500 | -43% |
2 Properties |
| 2011 | £425,000 | 6% |
1 Property |
| 2010 | £400,000 | -43% |
1 Property |
| 2009 | £571,666 | 12% |
3 Properties |
| 2008 | £505,225 | 27% |
2 Properties |
| 2007 | £370,000 | 34% |
2 Properties |
| 2006 | £245,000 | -169% |
1 Property |
| 2005 | £660,000 | 65% |
1 Property |
| 2004 | £233,000 | 14% |
5 Properties |
| 2003 | £200,000 | -50% |
1 Property |
| 2002 | £300,987 | -78% |
4 Properties |
| 2001 | £535,000 | 50% |
1 Property |
| 2000 | £268,750 | 54% |
2 Properties |
| 1999 | £122,850 | -16% |
2 Properties |
| 1998 | £142,475 | 34% |
2 Properties |
| 1997 | £93,833 | 23% |
3 Properties |
| 1996 | £72,425 | 41% |
5 Properties |
| 1995 | £42,500 | - |
2 Properties |
Property Price per Property Type in Farndon
Here you can find historic sold price data in order to help with your property search.
The average Property Paid Price for specific property types in the last three years are:
| Property Type | Average Sold Price | Sold Properties |
|---|---|---|
| Detached House | £590,000.00 | 1 Detached House |