
Houses for sale in Hundleby, Spilsby
House Prices in Hundleby
Properties in Hundleby have an average house price of £338k and had 68 Property Transactions within the last 3 years¹.
Hundleby is an area in Spilsby, Lincolnshire with 579 households², where the most expensive property was sold for £1.2M.
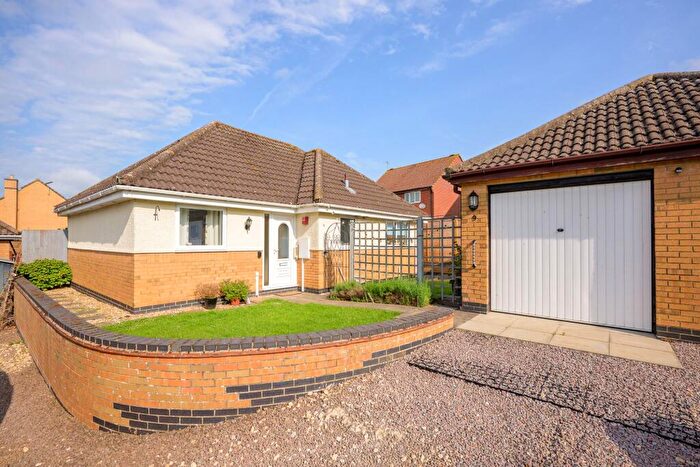
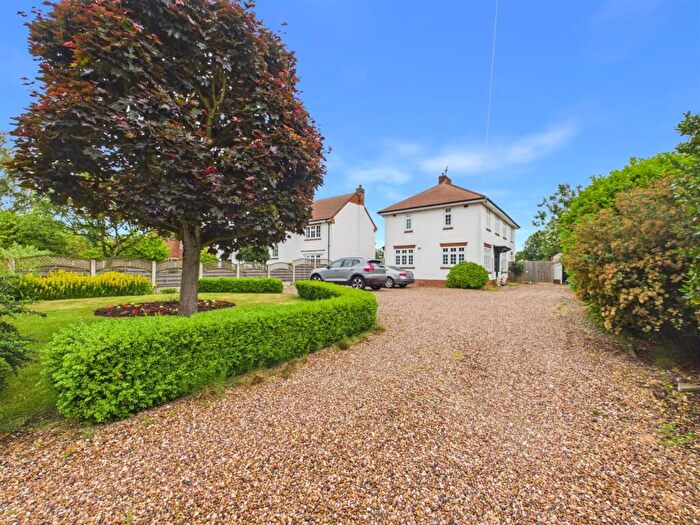
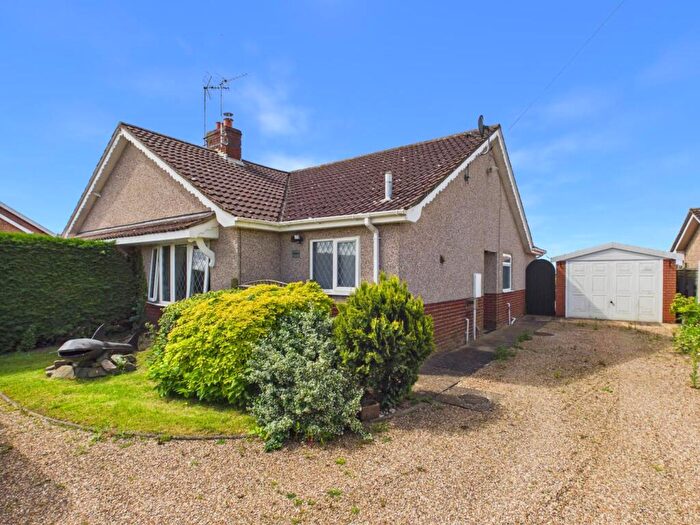
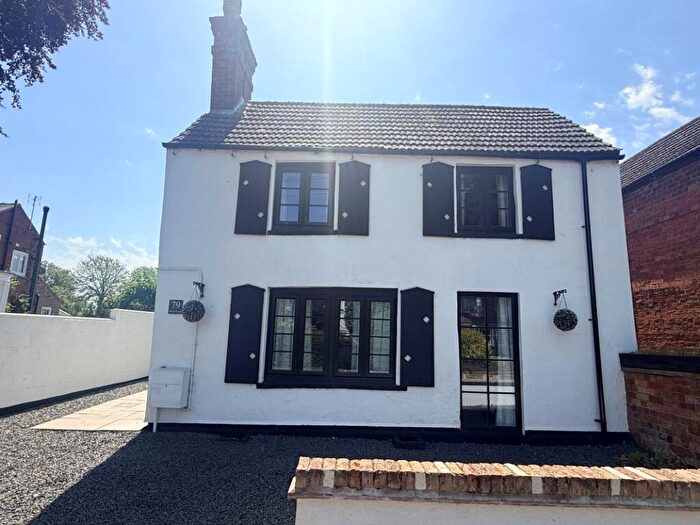
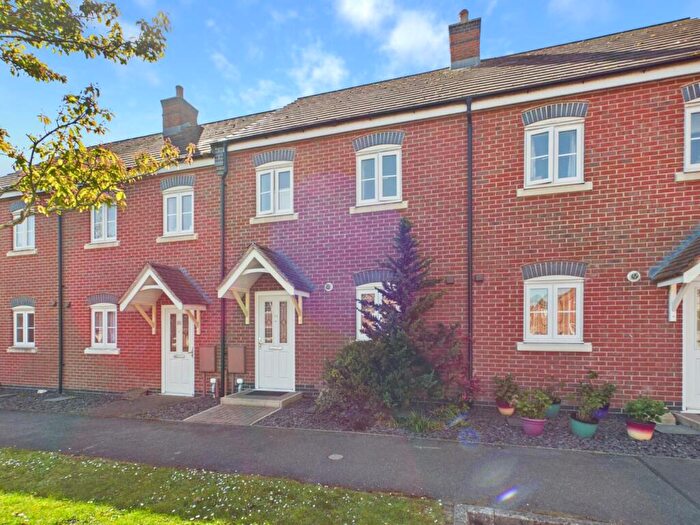
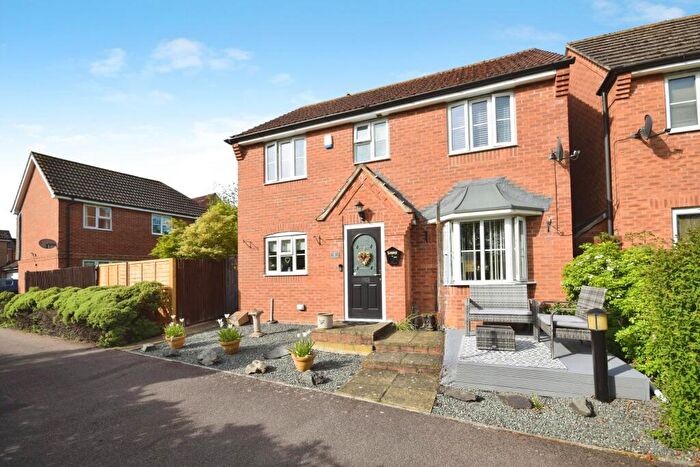
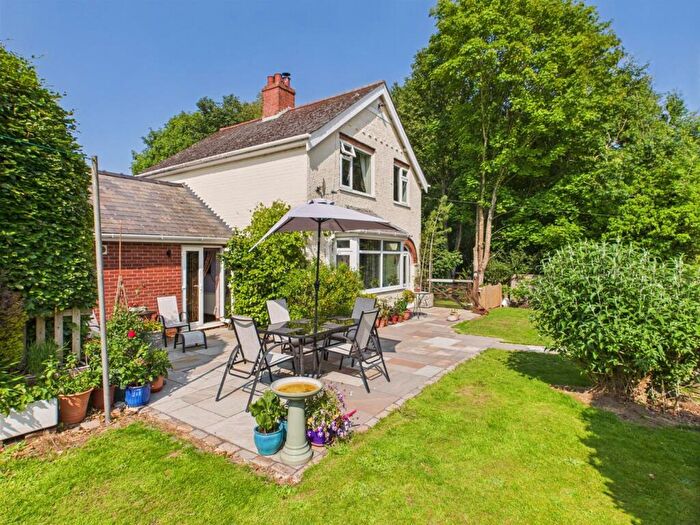
Properties for sale in Hundleby
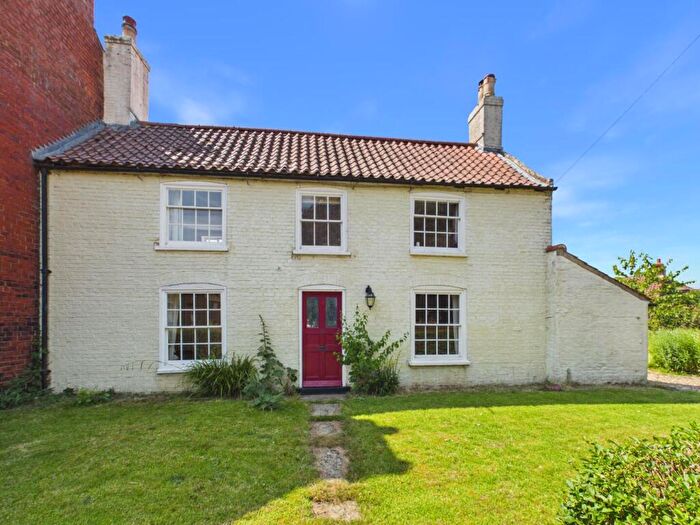

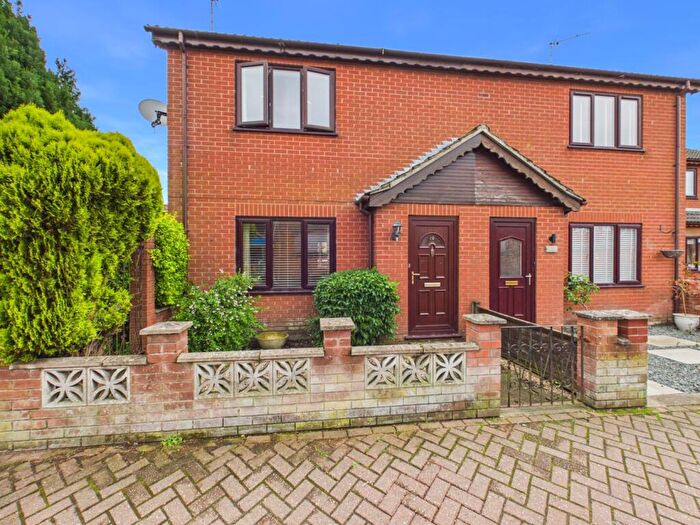
![]()
If you are looking to sell your house, let it out, or receive a property valuation, an expert can help you.
Click the button below to get started.
Roads and Postcodes in Hundleby
Navigate through our locations to find the location of your next house in Hundleby, Spilsby for sale or to rent.
| Streets | Postcodes |
|---|---|
| Alford Road | PE23 4PS |
| Bowmans Ridge | PE23 5NR |
| Brewery Yard | PE23 5LU |
| Brickyard Lane | PE23 5NF PE23 5NG |
| Church Lane | PE23 5NA |
| Dalby Road | PE23 4PH PE23 4PQ |
| Follet Close | PE23 5RR |
| Goose Lane | PE23 4DX |
| Langton Road | PE23 4JN |
| Maddison Lane | PE23 4PX |
| Main Road | PE23 5LS PE23 5LZ PE23 5ND PE23 5NQ |
| North Beck Lane | PE23 5NB |
| Park Avenue | PE23 5LY |
| Partney Road | PE23 4JL PE23 4PL |
| Raithby Hill | PE23 4DJ PE23 4DL |
| Raithby Road | PE23 5NH |
| Sausthorpe Road | PE23 4JJ |
| Scremby Road | PE23 5RN |
| Skegness Road | PE23 4PY |
| Stone Pit Lane | PE23 4QB |
| PE23 4DS PE23 4DT PE23 4DW PE23 4EA PE23 4ED PE23 4EE PE23 4EF PE23 4EJ PE23 4EL PE23 4JS PE23 4JT PE23 4JU PE23 4JX PE23 4JZ PE23 4LB PE23 4NF PE23 4NH PE23 4NL PE23 4NN PE23 4PE PE23 4PF PE23 4PG PE23 4PN PE23 4PW PE23 4QA PE23 4QE PE23 4QF PE23 4QG PE23 5NS PE23 5RJ PE23 5RP PE23 5RQ PE23 5RW |
Property price trends in Hundleby
According to the latest Land Registry data, the average home in Hundleby sold for £340,500 in 2026. That figure comes from 690 sales logged over the past 31 years.
Prices have fallen back over the last three years. Compared with 2023, when the typical sale came in around £399,444, that's a fall of roughly 14.8%.
Looking back five years, average prices are up about 20.7% since 2021, a gain of around £58,407 in cash terms.
Zoom out to the past decade for the fuller picture. Back in 2016, homes here averaged £205,932, so the typical sold price has climbed about 65.3% since then, roughly 5.2% a year. Stretch the view to fifteen years and that annual pace holds at about 5%.
Frequently asked questions about Hundleby
What is the average price for a property for sale in Hundleby?
The average price for a property for sale in Hundleby is £337,875. This amount is 26% higher than the average price in Spilsby. There are 844 property listings for sale in Hundleby.
What streets have the most expensive properties for sale in Hundleby?
The streets with the most expensive properties for sale in Hundleby are Raithby Hill at an average of £605,000, Goose Lane at an average of £525,000 and Bowmans Ridge at an average of £385,000.
What streets have the most affordable properties for sale in Hundleby?
The streets with the most affordable properties for sale in Hundleby are Brickyard Lane at an average of £205,000, Park Avenue at an average of £247,500 and Partney Road at an average of £254,000.
Which train stations are available in or near Hundleby?
Some of the train stations available in or near Hundleby are Thorpe Culvert, Wainfleet and Havenhouse.
Property Price Paid in Hundleby by Year
The average sold property price by year was:
| Year | Average Sold Price | Price Change |
Sold Properties
|
|---|---|---|---|
| 2026 | £340,500 | 6% |
2 Properties |
| 2025 | £320,564 | 5% |
31 Properties |
| 2024 | £303,941 | -31% |
17 Properties |
| 2023 | £399,444 | 33% |
18 Properties |
| 2022 | £266,652 | -6% |
23 Properties |
| 2021 | £282,093 | -0,3% |
36 Properties |
| 2020 | £283,079 | -6% |
12 Properties |
| 2019 | £299,886 | 15% |
22 Properties |
| 2018 | £254,062 | 19% |
26 Properties |
| 2017 | £206,466 | 0,3% |
15 Properties |
Property Price per Property Type in Hundleby
Here you can find historic sold price data in order to help with your property search.
The average Property Paid Price for specific property types in the last three years are:
| Property Type | Average Sold Price | Sold Properties |
|---|---|---|
| Semi Detached House | £198,375.00 | 8 Semi Detached Houses |
| Detached House | £395,294.00 | 51 Detached Houses |
| Terraced House | £139,812.00 | 8 Terraced Houses |
| Flat | £110,000.00 | 1 Flat |
