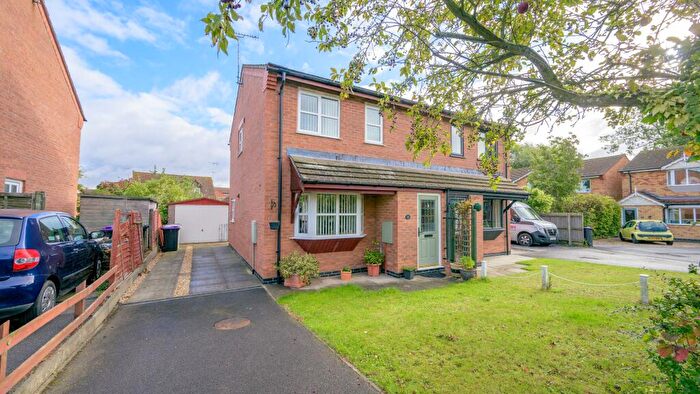
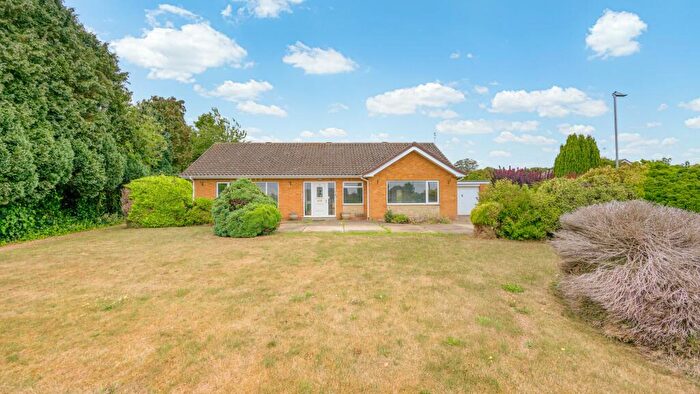
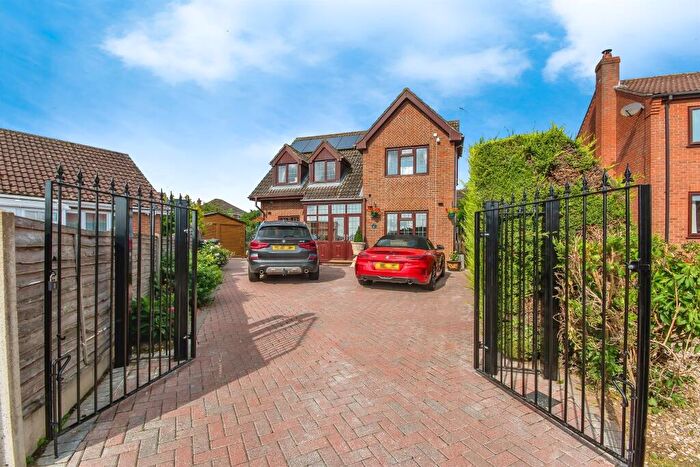
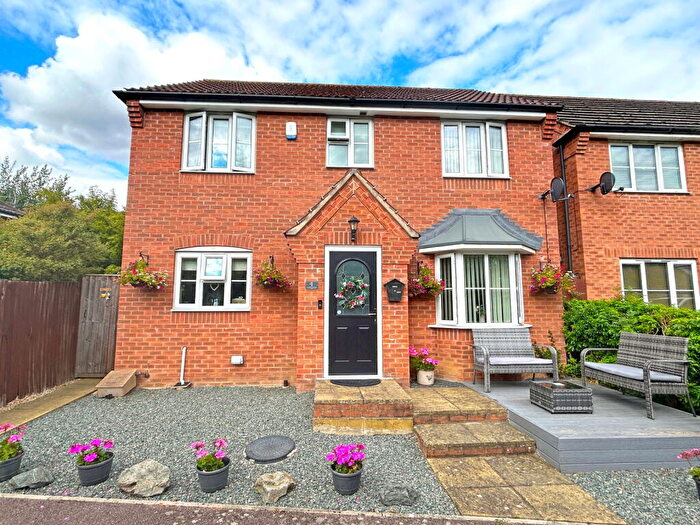
Houses for sale & to rent in Spilsby, Spilsby
House Prices in Spilsby
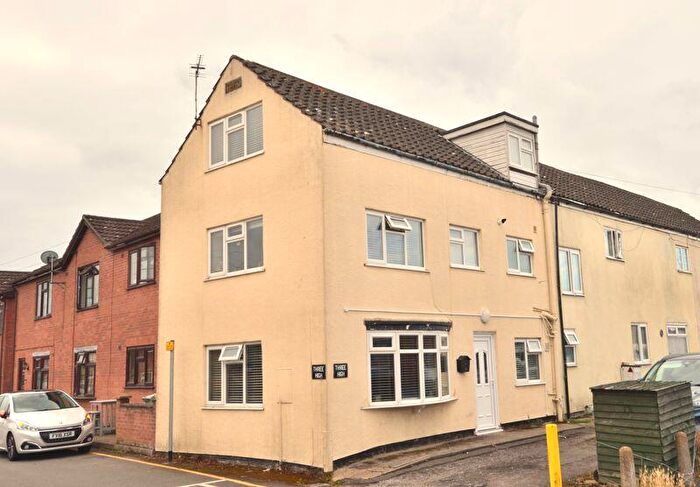
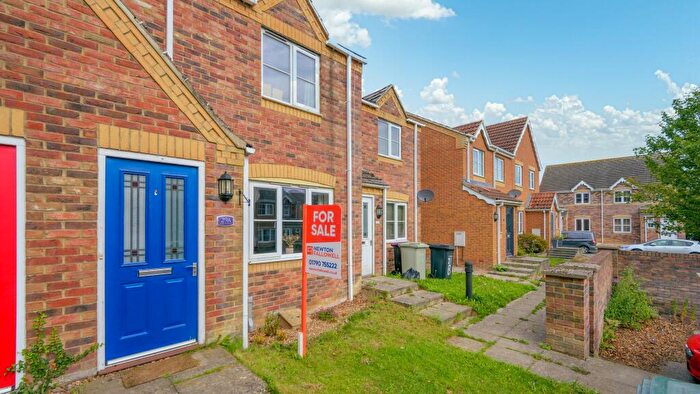
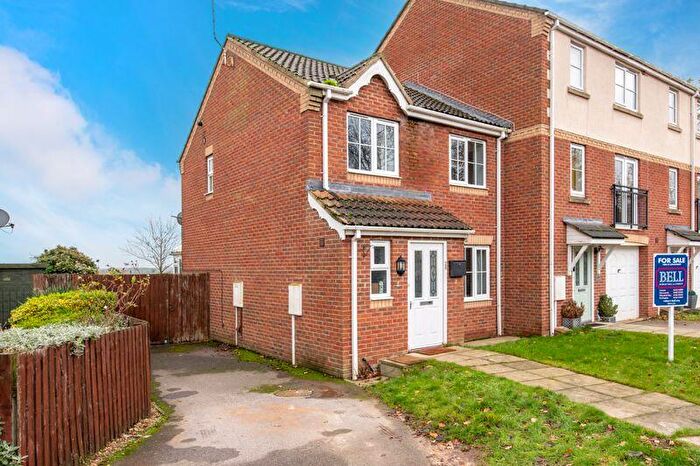
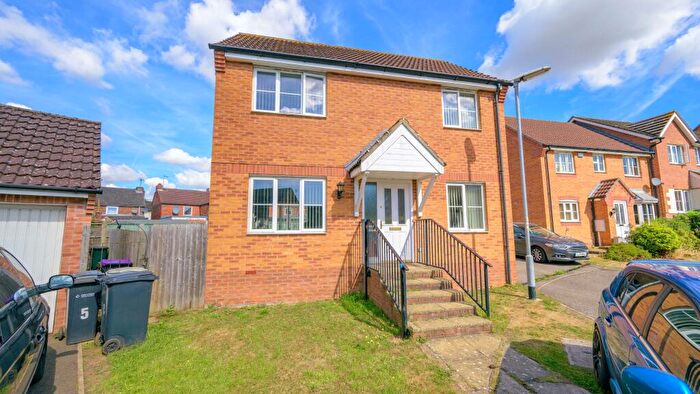
Properties in Spilsby have an average house price of £180,578.00 and had 156 Property Transactions within the last 3 years¹.
Spilsby is an area in Spilsby, Lincolnshire with 1,400 households², where the most expensive property was sold for £595,000.00.
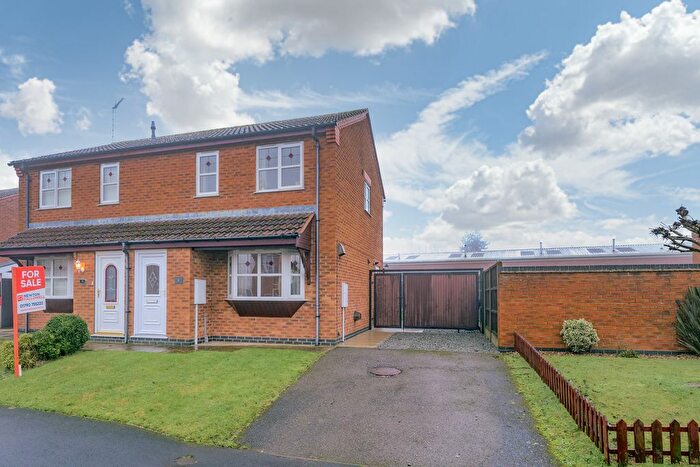
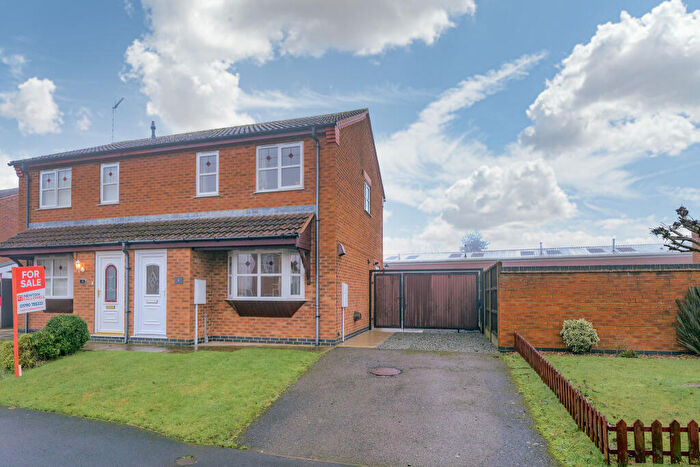
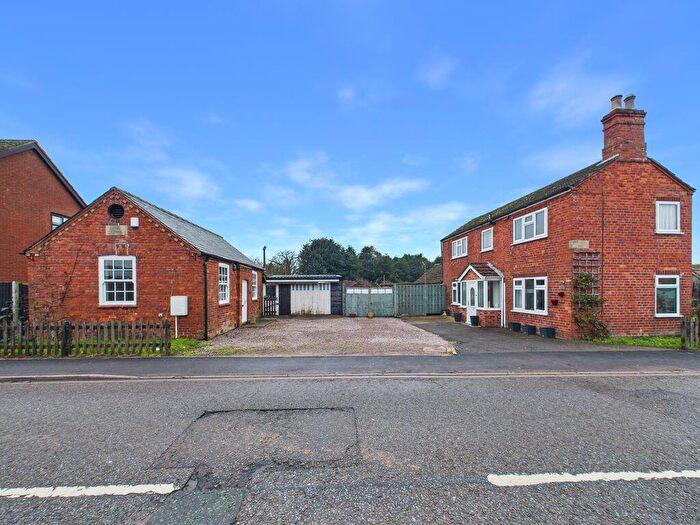
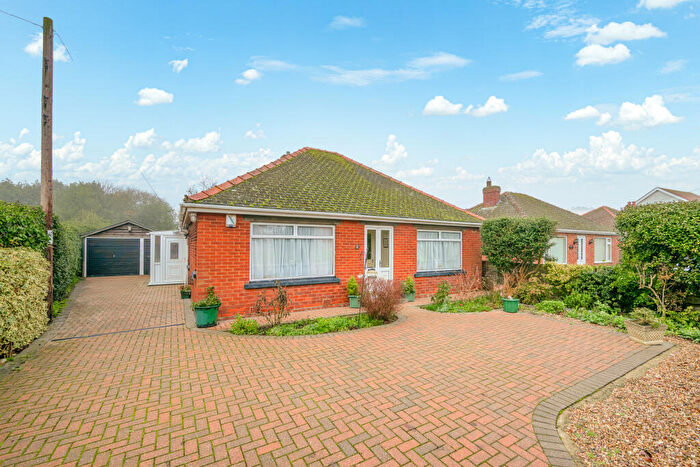
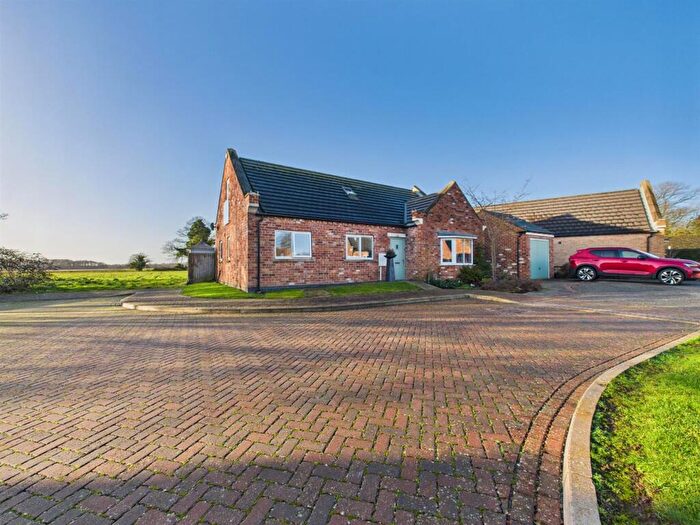
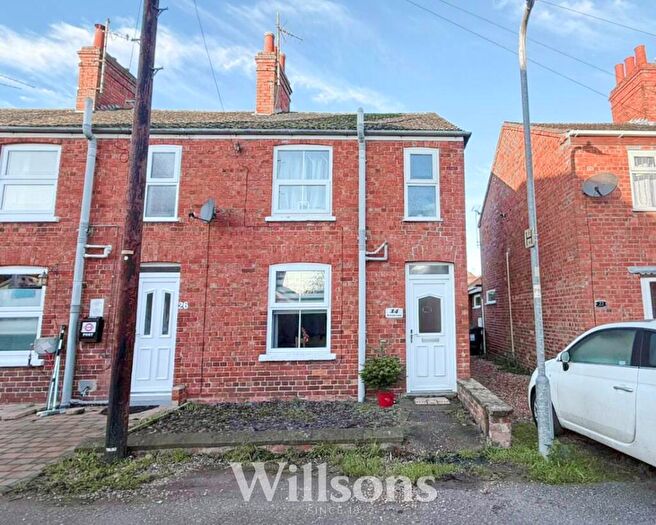
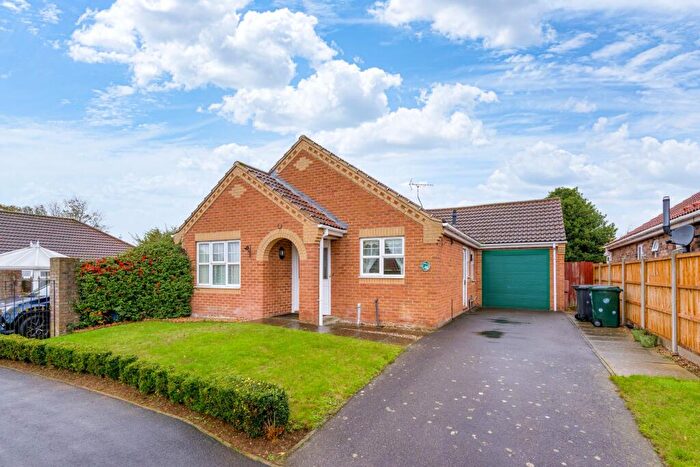
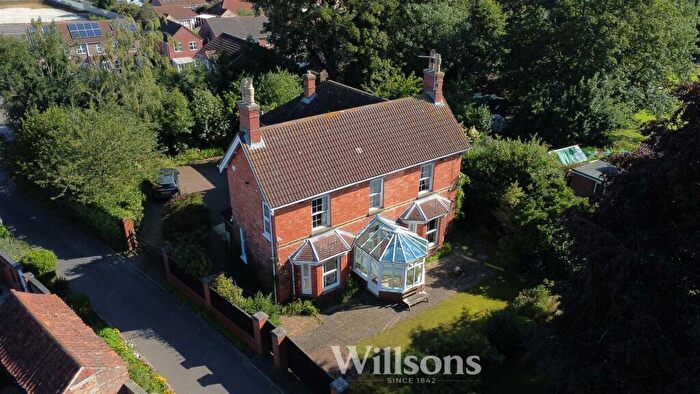
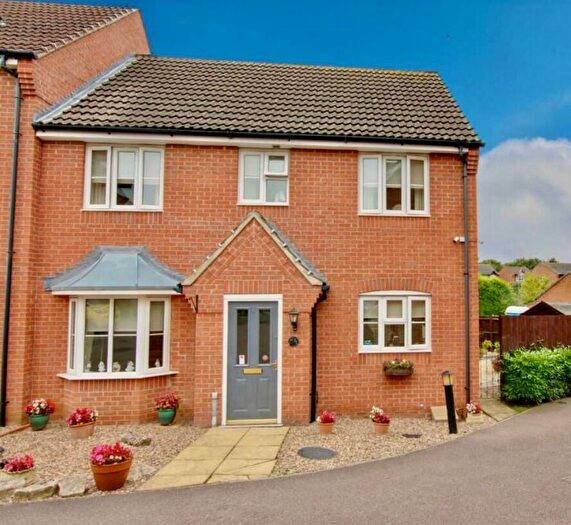
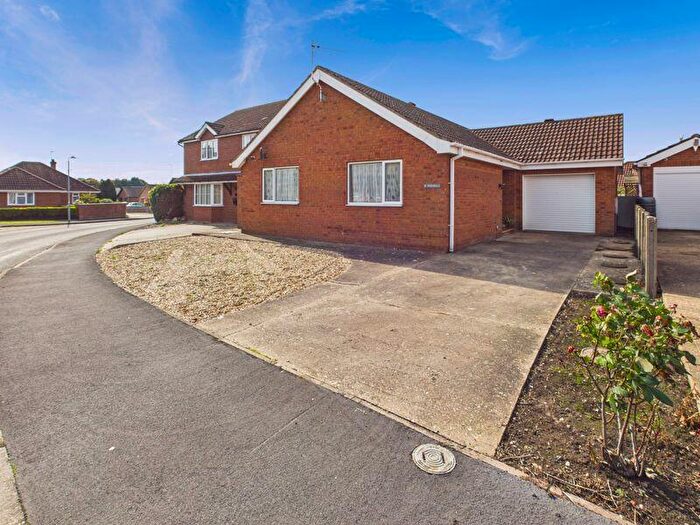
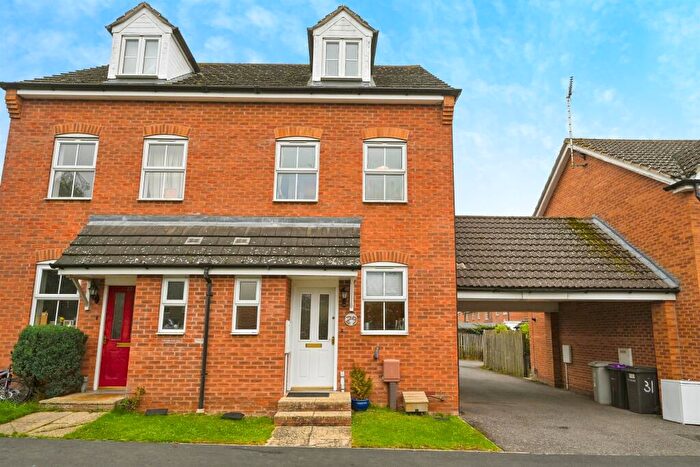
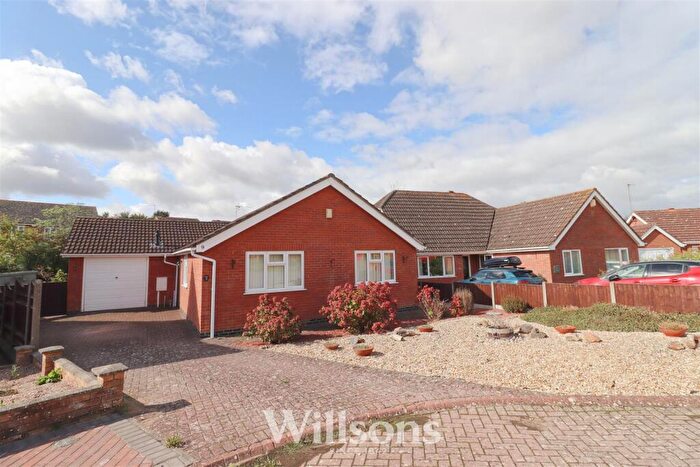
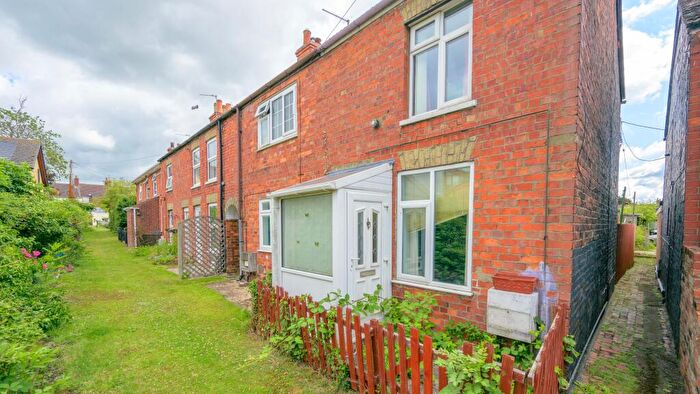
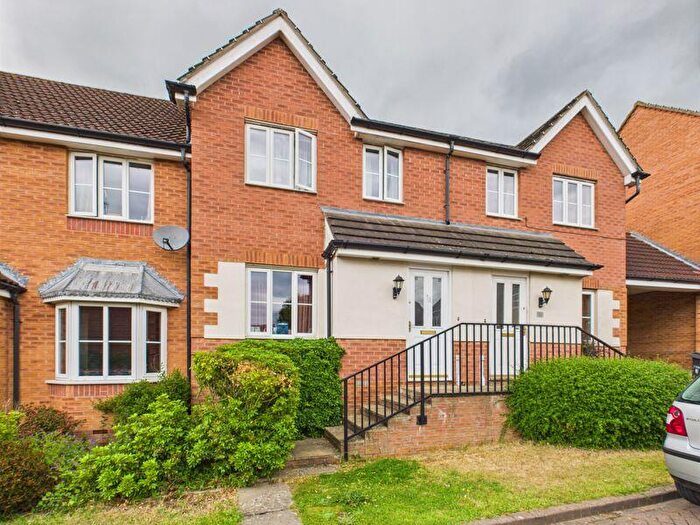
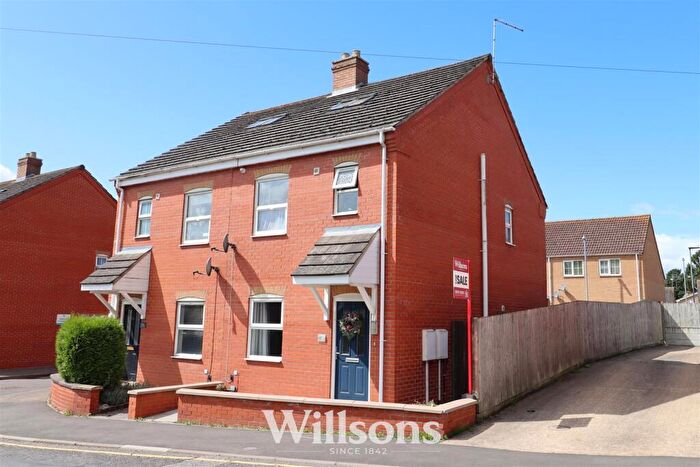
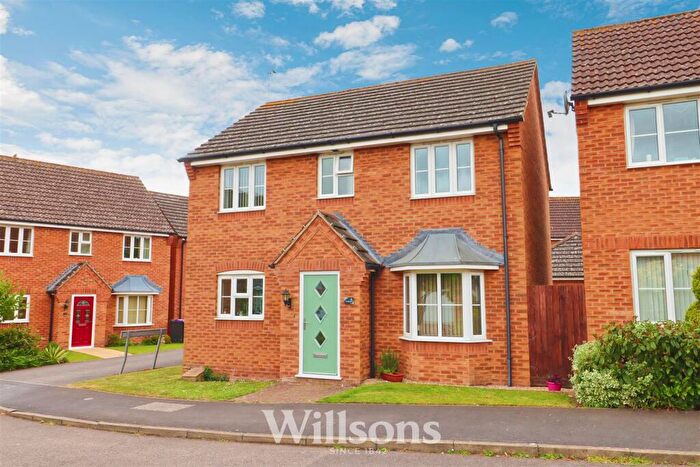
Properties for sale in Spilsby
Roads and Postcodes in Spilsby
Navigate through our locations to find the location of your next house in Spilsby, Spilsby for sale or to rent.
| Streets | Postcodes |
|---|---|
| Alma Place | PE23 5LB |
| Ancaster Avenue | PE23 5HL PE23 5HN PE23 5HP PE23 5HR PE23 5HS PE23 5HT PE23 5HZ |
| Ancaster Walk | PE23 5HW |
| Ashby Meadows | PE23 5DN |
| Ashby Road | PE23 5DH PE23 5DR PE23 5DS PE23 5DW PE23 5DT |
| Barley Close | PE23 5GZ |
| Blacksmiths Lane | PE23 5EZ |
| Boston Road | PE23 5HD PE23 5HG PE23 5HH PE23 5HQ PE23 5AA PE23 5HB |
| Brun Balderston Close | PE23 5RA |
| Church Street | PE23 5DU PE23 5EF PE23 5EG PE23 5DY |
| Cornhill | PE23 5JP |
| Dennett Close | PE23 5JA |
| Erebus Close | PE23 5LJ |
| Eresby Avenue | PE23 5HU |
| Fitzjames Close | PE23 5NL |
| Flinders Dale | PE23 5GF |
| Foxglove Close | PE23 5NJ |
| Franklin Gardens | PE23 5LW |
| Franklin Square | PE23 5JD |
| Franklin Way | PE23 5GG |
| Grace Swan Close | PE23 5LT |
| Granary Close | PE23 5BP |
| Halifax Road | PE23 5GE |
| Halton Road | PE23 5JZ PE23 5LA PE23 5LD PE23 5LF PE23 5NX |
| High Street | PE23 5JH PE23 5JJ PE23 5JL |
| Hundleby Road | PE23 5LP |
| Jacks Lane | PE23 5QT |
| Lady Jane Franklin Drive | PE23 5GB |
| Magellan Drive | PE23 5FB |
| Market Street | PE23 5JT PE23 5JX |
| Masonic Lane | PE23 5LR |
| Nelson Way | PE23 5NE |
| Newtown | PE23 5LE |
| Old Market Avenue | PE23 5HX |
| Old School Mews | PE23 5QU |
| Partney Road | PE23 5EH PE23 5EJ PE23 4PB PE23 5EQ |
| Pooles Lane | PE23 5EU PE23 5EB PE23 5EY |
| Post Office Lane | PE23 5LQ PE23 5LH |
| Queen Street | PE23 5JE PE23 5JQ |
| Raleigh Court | PE23 5JN |
| Resolute Close | PE23 5LL |
| Reynard Street | PE23 5JB |
| Shamfields Road | PE23 5NN |
| Simpson Street | PE23 5LG |
| Spence Street | PE23 5EA |
| Spilsby Meadows | PE23 5GA |
| St James Walk | PE23 5HY |
| Stone Lane | PE23 5JS |
| Talbot Close | PE23 5NW |
| Tasman Road | PE23 5LN |
| Tennyson Way | PE23 5GH |
| The Terrace | PE23 5JR |
| Vale Court | PE23 5HF |
| Vale Road | PE23 5HE |
| Welham Gardens | PE23 5JG |
| Wellington Yard | PE23 5JF |
| West End | PE23 5ED PE23 5ET PE23 5EW |
| West End Crescent | PE23 5EE |
| Willoughby Drive | PE23 5EX |
| Winston Road | PE23 5HJ |
| Woodland View | PE23 5GD |
| Woodlands Avenue | PE23 5EL PE23 5EP PE23 5EN PE23 5ER PE23 5ES |
| Wrights Court | PE23 5GL |
| PE23 5RF PE23 9AS PE23 9AY PE23 9AZ |
Transport near Spilsby
- FAQ
- Price Paid By Year
- Property Type Price
Frequently asked questions about Spilsby
What is the average price for a property for sale in Spilsby?
The average price for a property for sale in Spilsby is £180,578. This amount is 33% lower than the average price in Spilsby. There are 458 property listings for sale in Spilsby.
What streets have the most expensive properties for sale in Spilsby?
The streets with the most expensive properties for sale in Spilsby are Church Street at an average of £595,000, Eresby Avenue at an average of £325,000 and Partney Road at an average of £290,000.
What streets have the most affordable properties for sale in Spilsby?
The streets with the most affordable properties for sale in Spilsby are Brun Balderston Close at an average of £67,750, West End Crescent at an average of £90,000 and Pooles Lane at an average of £97,500.
Which train stations are available in or near Spilsby?
Some of the train stations available in or near Spilsby are Thorpe Culvert, Wainfleet and Havenhouse.
Property Price Paid in Spilsby by Year
The average sold property price by year was:
| Year | Average Sold Price | Price Change |
Sold Properties
|
|---|---|---|---|
| 2025 | £168,938 | -9% |
49 Properties |
| 2024 | £184,543 | -2% |
57 Properties |
| 2023 | £187,465 | 5% |
50 Properties |
| 2022 | £178,352 | 10% |
60 Properties |
| 2021 | £160,691 | -0,1% |
84 Properties |
| 2020 | £160,816 | -2% |
52 Properties |
| 2019 | £164,124 | 15% |
59 Properties |
| 2018 | £140,054 | -6% |
68 Properties |
| 2017 | £148,230 | 9% |
55 Properties |
| 2016 | £135,182 | 5% |
65 Properties |
| 2015 | £128,964 | 1% |
51 Properties |
| 2014 | £127,488 | 10% |
65 Properties |
| 2013 | £115,077 | -8% |
40 Properties |
| 2012 | £124,374 | 6% |
34 Properties |
| 2011 | £117,061 | -19% |
44 Properties |
| 2010 | £139,081 | 14% |
42 Properties |
| 2009 | £120,200 | -19% |
31 Properties |
| 2008 | £143,165 | 7% |
45 Properties |
| 2007 | £133,662 | -7% |
107 Properties |
| 2006 | £142,447 | 5% |
140 Properties |
| 2005 | £135,469 | 11% |
97 Properties |
| 2004 | £120,391 | 15% |
143 Properties |
| 2003 | £101,867 | 22% |
108 Properties |
| 2002 | £79,639 | 26% |
96 Properties |
| 2001 | £58,815 | 6% |
72 Properties |
| 2000 | £55,247 | 20% |
72 Properties |
| 1999 | £44,430 | -2% |
73 Properties |
| 1998 | £45,292 | 2% |
65 Properties |
| 1997 | £44,611 | 11% |
54 Properties |
| 1996 | £39,906 | 11% |
49 Properties |
| 1995 | £35,487 | - |
33 Properties |
Property Price per Property Type in Spilsby
Here you can find historic sold price data in order to help with your property search.
The average Property Paid Price for specific property types in the last three years are:
| Property Type | Average Sold Price | Sold Properties |
|---|---|---|
| Semi Detached House | £163,200.00 | 51 Semi Detached Houses |
| Detached House | £250,015.00 | 51 Detached Houses |
| Terraced House | £131,110.00 | 39 Terraced Houses |
| Flat | £132,196.00 | 15 Flats |

