Houses for sale & to rent in Hillsides, Stamford
House Prices in Hillsides
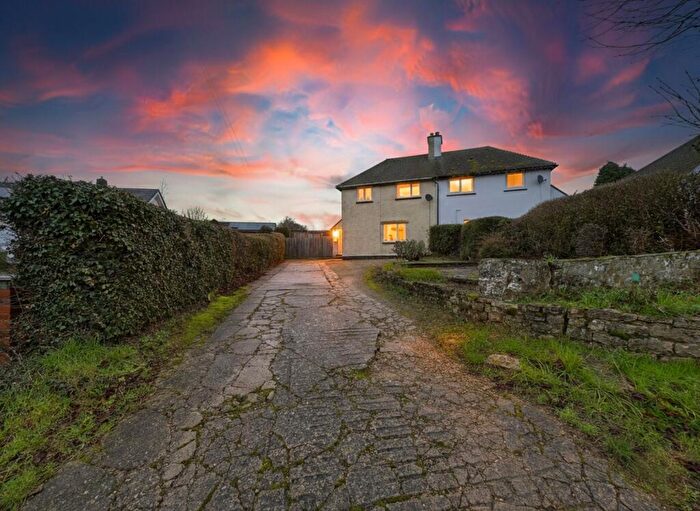
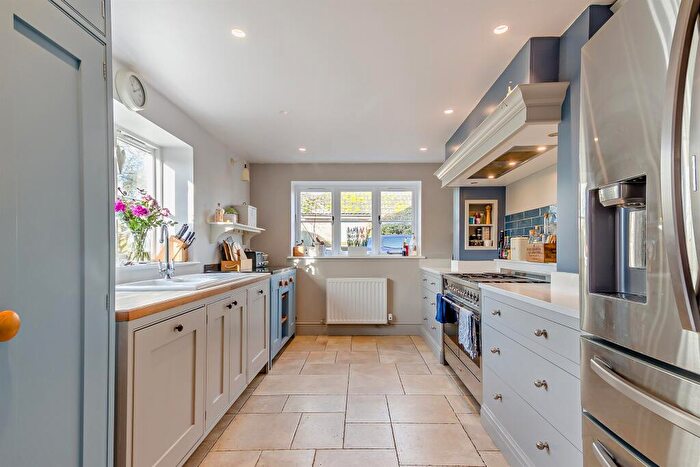
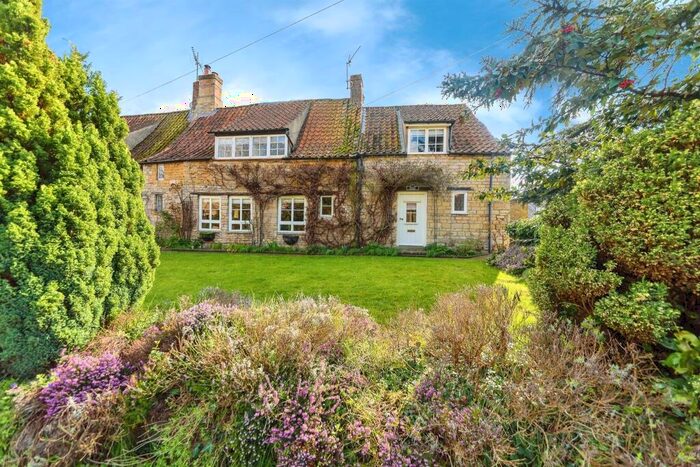
Properties in Hillsides have an average house price of £594,228.00 and had 22 Property Transactions within the last 3 years¹.
Hillsides is an area in Stamford, Lincolnshire with 430 households², where the most expensive property was sold for £1,675,000.00.
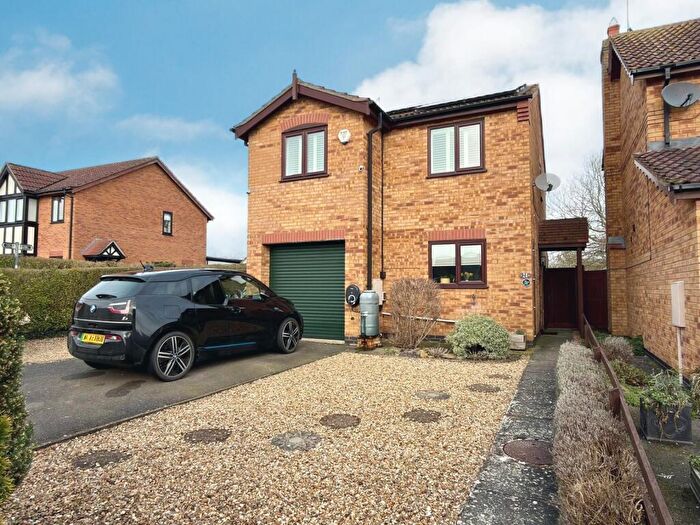
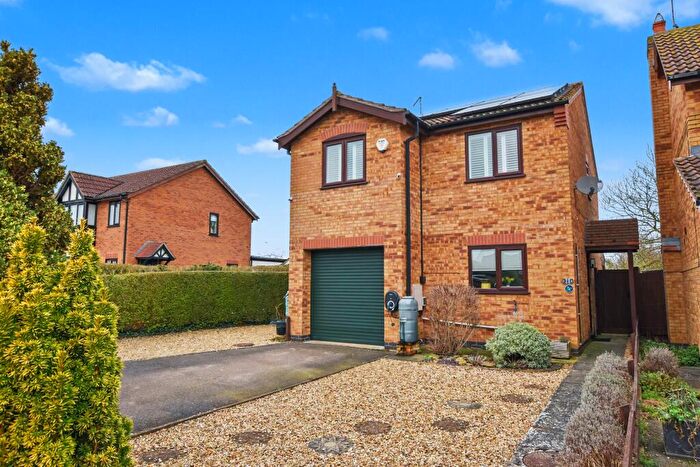
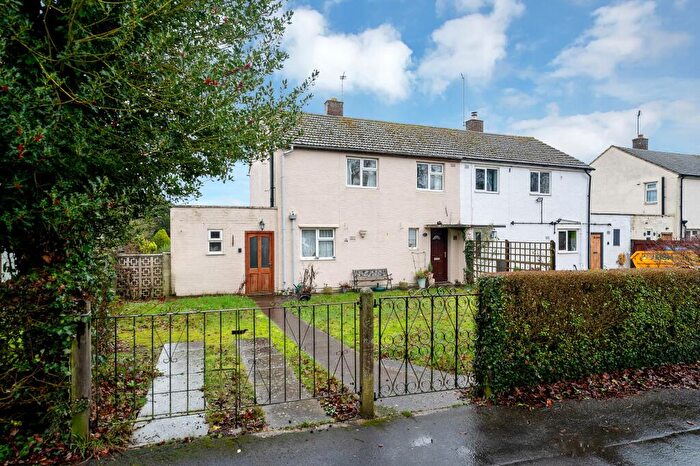
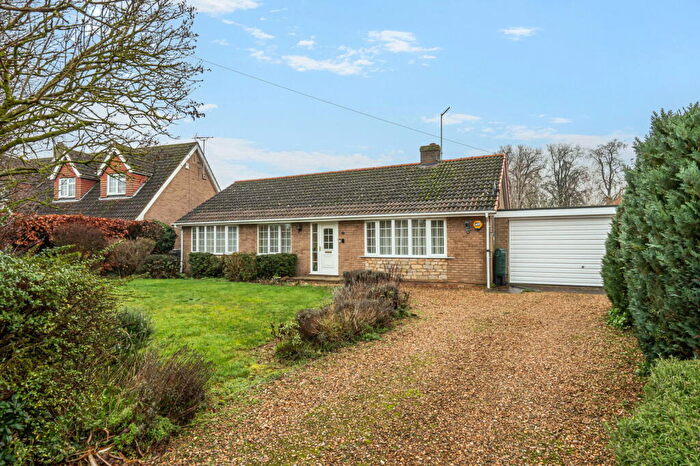
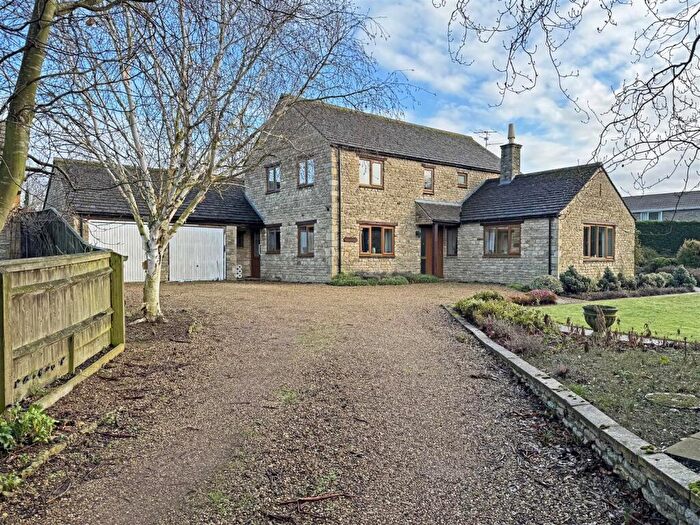
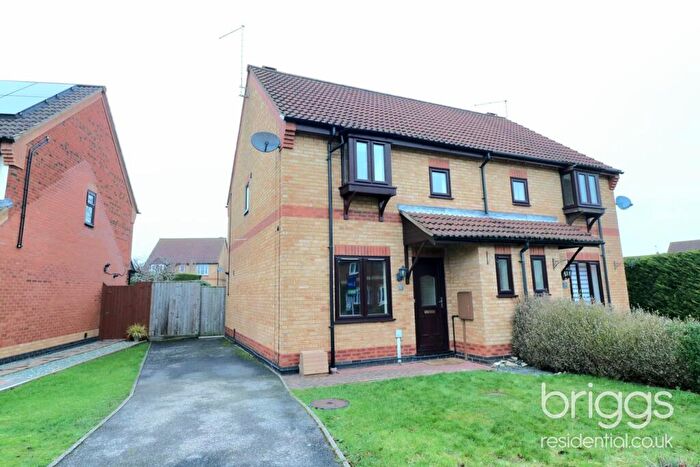
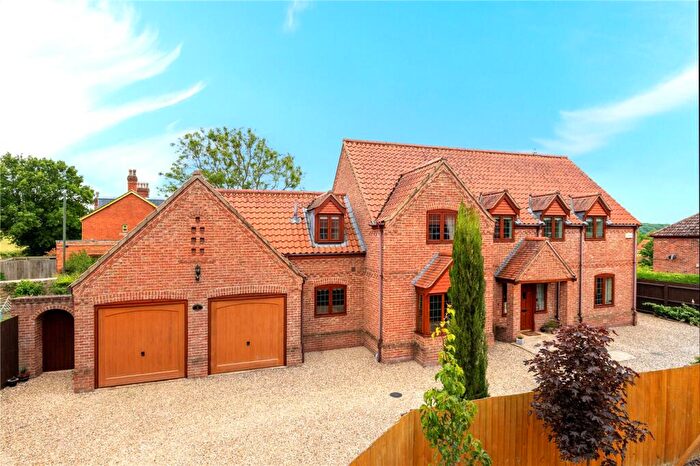
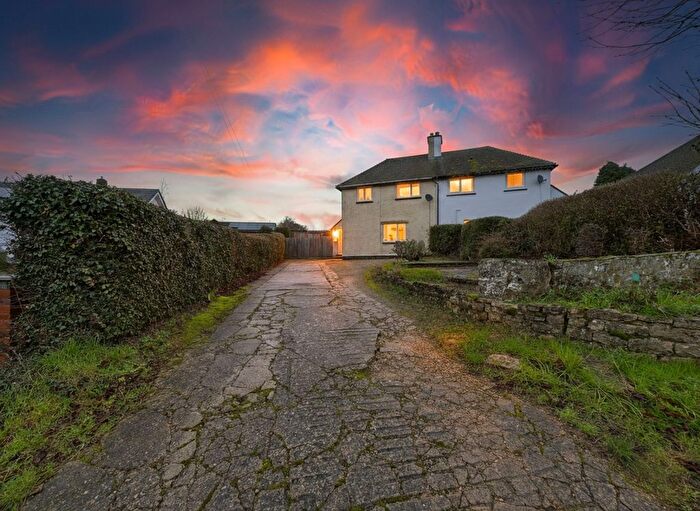
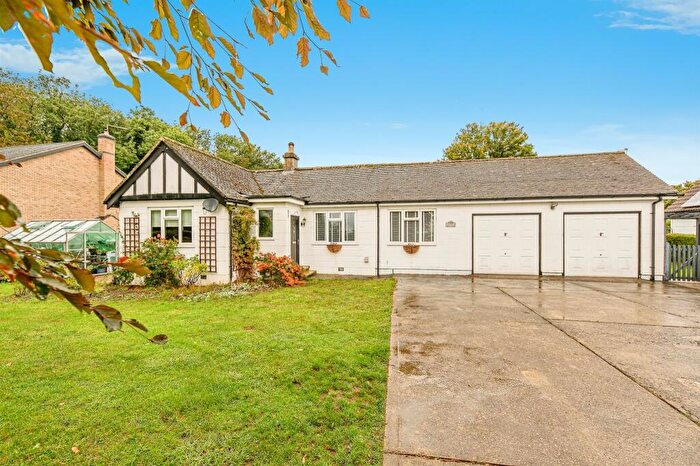
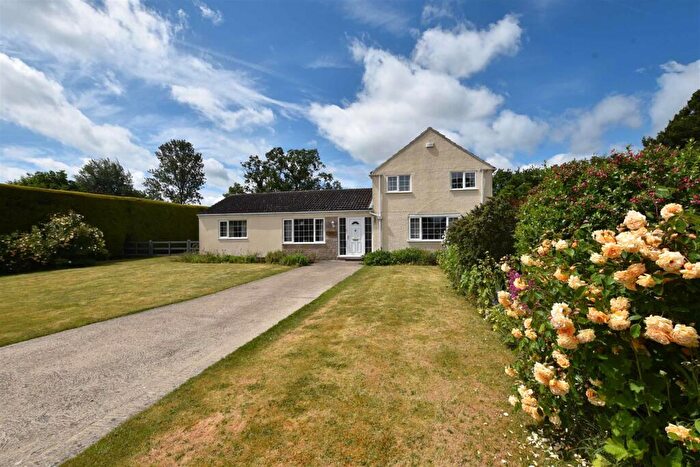
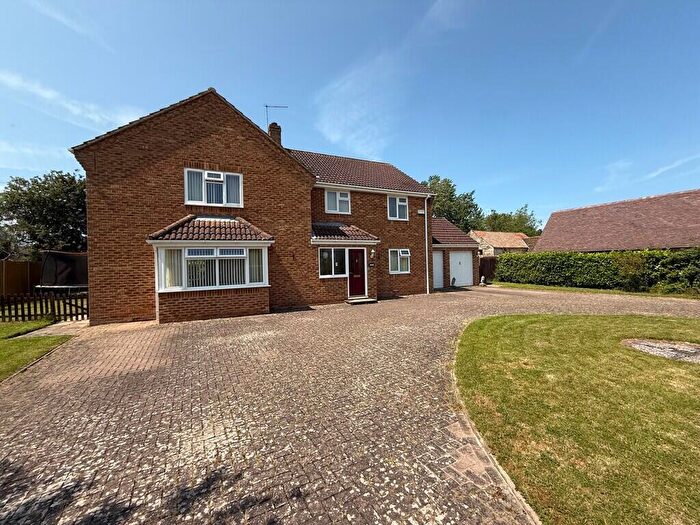
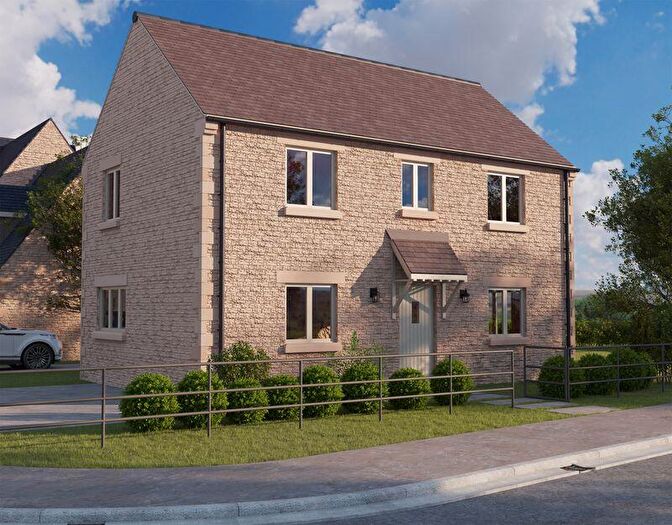
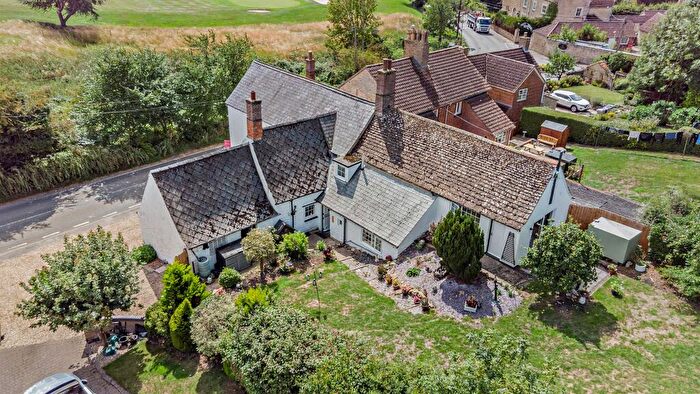
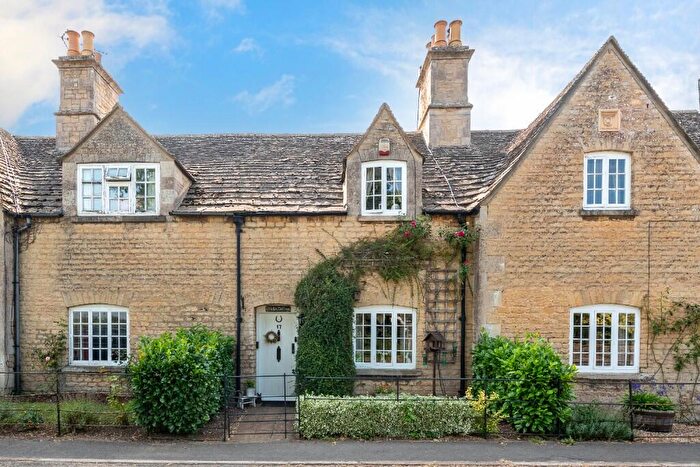
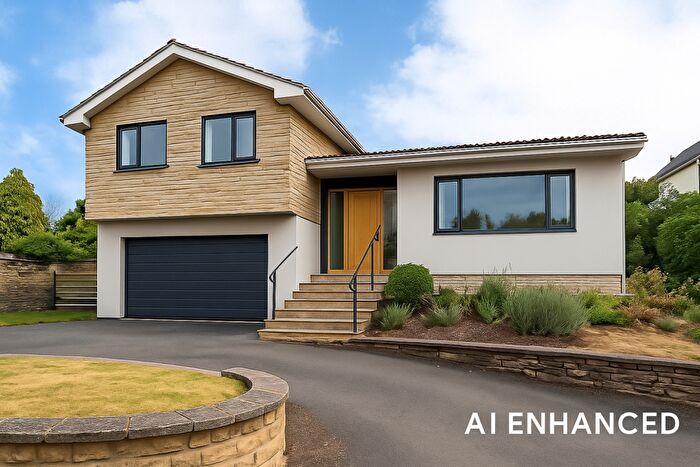
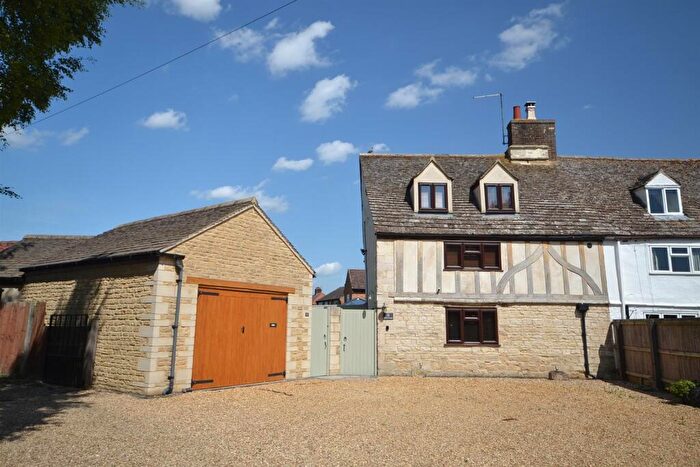
Properties for sale in Hillsides
Roads and Postcodes in Hillsides
Navigate through our locations to find the location of your next house in Hillsides, Stamford for sale or to rent.
| Streets | Postcodes |
|---|---|
| Bourne Road | PE9 4LU |
| Carlby Road | PE9 4NU PE9 4PR |
| Church Street | PE9 4NB |
| Elliots Way | PE9 4NL |
| Farriers Way | PE9 4NG |
| Fenton Drive | PE9 4NN |
| Fitzwilliams Court | PE9 4QQ |
| Glen Court | PE9 4QR |
| Greatford Gardens | PE9 4PX |
| High Street | PE9 4LX |
| Manor Road | PE9 4LZ |
| New Crown Cottage | PE9 4PP |
| Spa Road | PE9 4NR PE9 4NS |
| Stamford Road | PE9 4EB |
| Stoney Glen | PE9 4ED |
| Templeman Drive | PE9 4NQ |
| The Avenue | PE9 4NA |
| The Paddocks | PE9 4NH |
| Wilsthorpe Road | PE9 4NX |
| PE9 4EA PE9 4EE PE9 4NT PE9 4PB PE9 4PE PE9 4QA PE9 4QF |
Transport near Hillsides
- FAQ
- Price Paid By Year
- Property Type Price
Frequently asked questions about Hillsides
What is the average price for a property for sale in Hillsides?
The average price for a property for sale in Hillsides is £594,228. This amount is 56% higher than the average price in Stamford. There are 453 property listings for sale in Hillsides.
What streets have the most expensive properties for sale in Hillsides?
The streets with the most expensive properties for sale in Hillsides are Fenton Drive at an average of £427,500, Templeman Drive at an average of £424,333 and High Street at an average of £390,000.
What streets have the most affordable properties for sale in Hillsides?
The streets with the most affordable properties for sale in Hillsides are Spa Road at an average of £337,500 and Church Street at an average of £380,000.
Which train stations are available in or near Hillsides?
Some of the train stations available in or near Hillsides are Stamford, Peterborough and Spalding.
Property Price Paid in Hillsides by Year
The average sold property price by year was:
| Year | Average Sold Price | Price Change |
Sold Properties
|
|---|---|---|---|
| 2025 | £434,500 | -30% |
4 Properties |
| 2024 | £563,002 | -27% |
10 Properties |
| 2023 | £713,125 | 26% |
8 Properties |
| 2022 | £528,174 | 30% |
18 Properties |
| 2021 | £367,216 | -43% |
15 Properties |
| 2020 | £525,461 | 0,4% |
13 Properties |
| 2019 | £523,136 | 26% |
11 Properties |
| 2018 | £387,731 | -9% |
18 Properties |
| 2017 | £421,359 | 8% |
20 Properties |
| 2016 | £387,464 | 2% |
14 Properties |
| 2015 | £378,998 | 21% |
28 Properties |
| 2014 | £300,333 | -28% |
12 Properties |
| 2013 | £383,470 | -2% |
17 Properties |
| 2012 | £390,142 | -6% |
7 Properties |
| 2011 | £414,547 | 34% |
20 Properties |
| 2010 | £274,423 | -7% |
13 Properties |
| 2009 | £293,999 | -2% |
13 Properties |
| 2008 | £300,923 | -34% |
13 Properties |
| 2007 | £404,674 | 38% |
21 Properties |
| 2006 | £251,062 | -26% |
24 Properties |
| 2005 | £316,131 | 22% |
21 Properties |
| 2004 | £245,412 | 7% |
27 Properties |
| 2003 | £227,696 | 24% |
15 Properties |
| 2002 | £173,772 | 9% |
33 Properties |
| 2001 | £158,407 | -3% |
28 Properties |
| 2000 | £162,630 | 15% |
34 Properties |
| 1999 | £138,855 | 12% |
31 Properties |
| 1998 | £121,817 | 26% |
35 Properties |
| 1997 | £89,723 | -18% |
25 Properties |
| 1996 | £105,728 | -5% |
31 Properties |
| 1995 | £110,596 | - |
32 Properties |
Property Price per Property Type in Hillsides
Here you can find historic sold price data in order to help with your property search.
The average Property Paid Price for specific property types in the last three years are:
| Property Type | Average Sold Price | Sold Properties |
|---|---|---|
| Terraced House | £306,666.00 | 3 Terraced Houses |
| Detached House | £657,112.00 | 18 Detached Houses |
| Semi Detached House | £325,000.00 | 1 Semi Detached House |

