
Houses for sale & to rent in Crawley, Luton
House Prices in Crawley
Properties in Crawley have an average house price of £296k and had 296 Property Transactions within the last 3 years¹.
Crawley is an area in Luton, Luton with 2,810 households², where the most expensive property was sold for £568k.
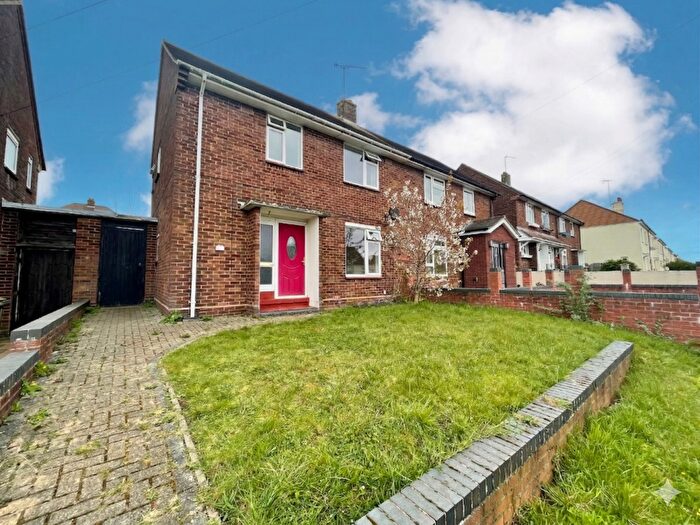
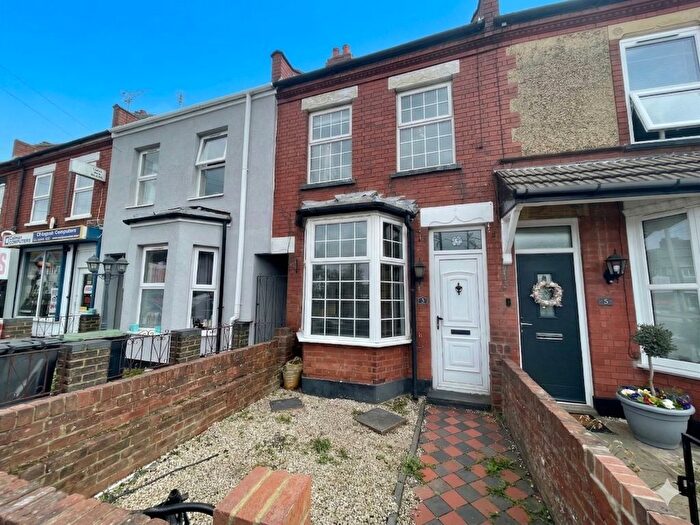
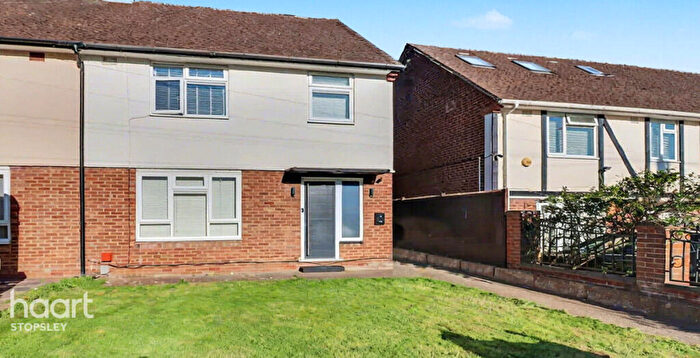
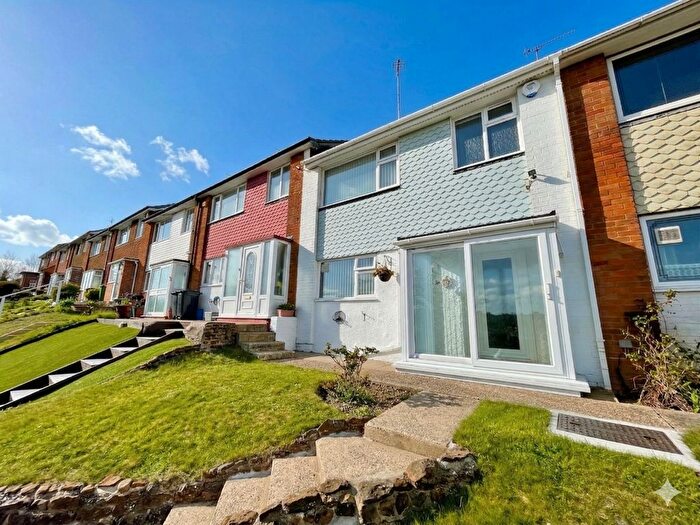
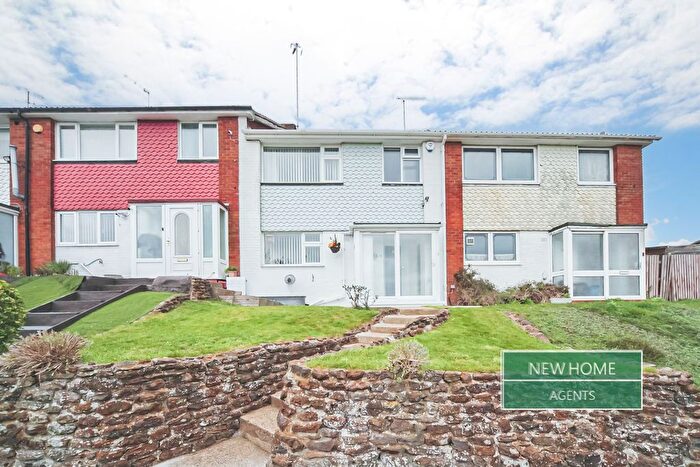
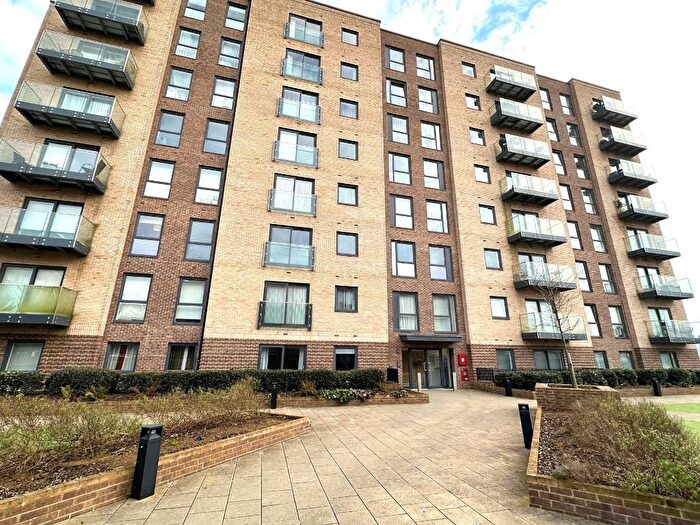
Properties for sale in Crawley

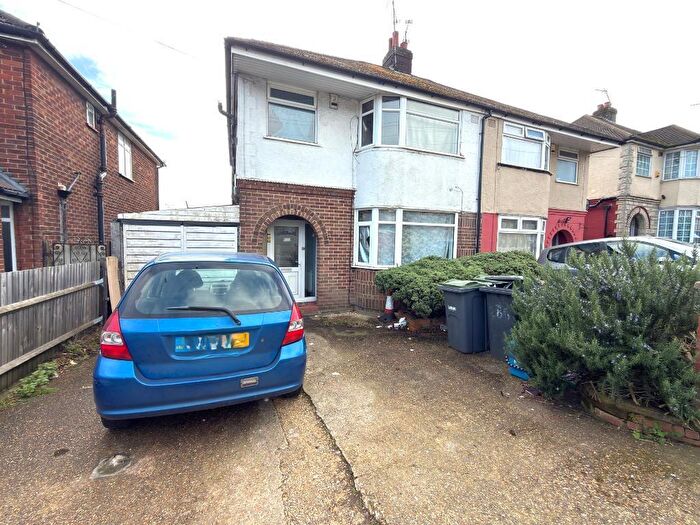
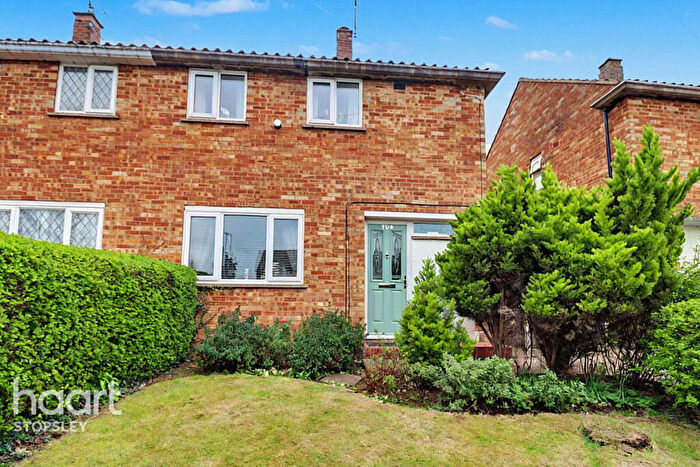
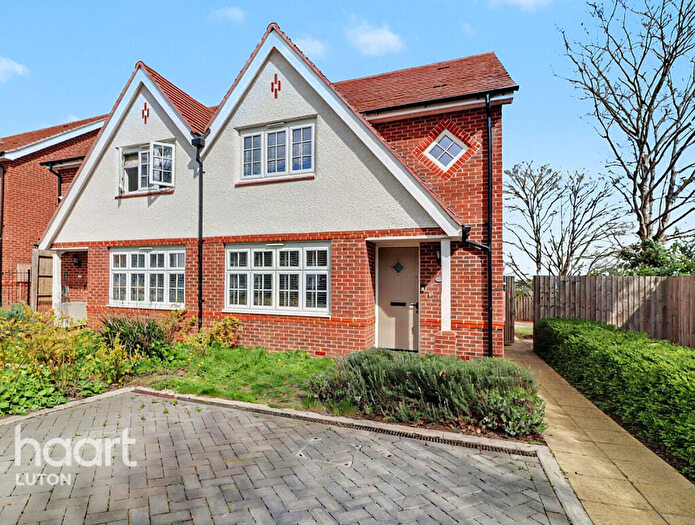
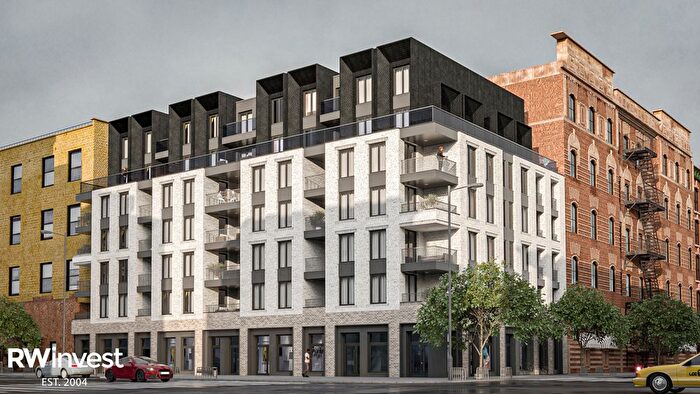
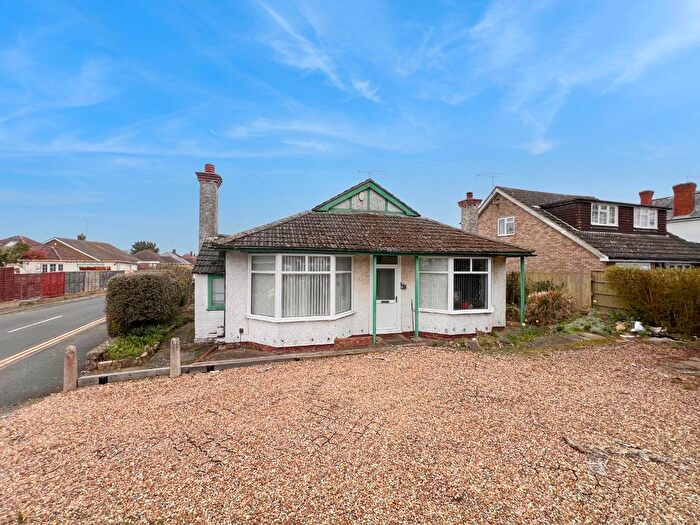
![]()
If you are looking to sell your house, let it out, or receive a property valuation, an expert can help you.
Click the button below to get started.

Roads and Postcodes in Crawley
Navigate through our locations to find the location of your next house in Crawley, Luton for sale or to rent.
| Streets | Postcodes |
|---|---|
| Armstrong Road | LU2 0FU LU2 0FX |
| Barrowby Close | LU2 9JL |
| Beaconsfield | LU2 0RW |
| Blaydon Road | LU2 0RP |
| Brendon Avenue | LU2 9LG LU2 9LH LU2 9LQ |
| Brooms Road | LU2 0JP LU2 0JR |
| Buchanan Drive | LU2 0RT LU2 0RX LU2 0SA LU2 0RS |
| Carteret Road | LU2 9JY LU2 9JZ |
| Chertsey Close | LU2 9JD |
| Crawley Green Road | LU2 0JU LU2 0QT LU2 0QU LU2 0QW LU2 0QX LU2 0QY LU2 0SH LU2 0SJ LU2 0SL LU2 0FW |
| Derwent Road | LU2 0JT |
| Devon Road | LU2 0RH LU2 0RJ LU2 0RL LU2 0RU LU2 0RY LU2 0RZ |
| Durham Road | LU2 0RB LU2 0RD |
| Eastcott Close | LU2 9JP |
| Eaton Green Road | LU2 9HB LU2 9HE LU2 9JE |
| Eaton Place | LU2 9LB |
| Eaton Valley Road | LU2 0SN LU2 0SW |
| Falconers Road | LU2 9BF LU2 9ET |
| Falks Hill | LU2 0FN |
| Fermor Crescent | LU2 9HT LU2 9HU LU2 9LN |
| Gayland Avenue | LU2 0RR |
| Gresham Close | LU2 9HJ |
| Haddon Road | LU2 0JB |
| Harrowden Road | LU2 0SP LU2 0SR |
| Hart Lane | LU2 0JF LU2 0JG LU2 0JH LU2 0JQ |
| High Ridge | LU2 9HR |
| Hollybush Road | LU2 9HG LU2 9HQ |
| Holtsmere Close | LU2 9JW |
| Hornsby Close | LU2 9HP |
| Ketton Close | LU2 0QZ LU2 0RQ |
| Kimpton Road | LU2 0FP LU2 0JX LU2 0LA LU2 0LB LU2 0SX LU2 0TB |
| Lalleford Road | LU2 9JF LU2 9JG LU2 9JH LU2 9JJ LU2 9JQ |
| Leygreen Close | LU2 0SQ |
| Lyneham Road | LU2 9JR LU2 9JS LU2 9JT |
| Maulden Close | LU2 9HW |
| Mistletoe Hill | LU2 9HF |
| Mossbank Avenue | LU2 9HH |
| Nethercott Close | LU2 9JX |
| Newnham Close | LU2 9JN |
| Norfolk Road | LU2 0RE |
| Overfield Road | LU2 9JU |
| Plymouth Close | LU2 0RA |
| Polzeath Close | LU2 9LJ |
| Porlock Drive | LU2 9LL |
| Rowelfield | LU2 9HL LU2 9HN |
| Rutland Crescent | LU2 0RF LU2 0RG |
| Silecroft Road | LU2 0RN |
| Stirling Drive | LU2 0GE LU2 0GF LU2 0GG |
| Summers Road | LU2 9HS |
| Tower Road | LU2 0JN LU2 0JW |
| Whitecroft Road | LU2 0JS |
| LU2 0GA |
Transport near Crawley

- FAQ
- Price Paid By Year
- Property Type Price
Frequently asked questions about Crawley
What is the average price for a property for sale in Crawley?
The average price for a property for sale in Crawley is £296,459. This amount is 1% lower than the average price in Luton. There are 1,756 property listings for sale in Crawley.
What streets have the most expensive properties for sale in Crawley?
The streets with the most expensive properties for sale in Crawley are Armstrong Road at an average of £403,666, Norfolk Road at an average of £394,666 and Maulden Close at an average of £372,500.
What streets have the most affordable properties for sale in Crawley?
The streets with the most affordable properties for sale in Crawley are Haddon Road at an average of £151,250, Whitecroft Road at an average of £205,000 and Brendon Avenue at an average of £209,733.
Which train stations are available in or near Crawley?
Some of the train stations available in or near Crawley are Luton Airport Parkway, Luton and Leagrave.
Property Price Paid in Crawley by Year
The average sold property price by year was:
| Year | Average Sold Price | Price Change |
Sold Properties
|
|---|---|---|---|
| 2025 | £304,323 | 5% |
88 Properties |
| 2024 | £289,658 | -2% |
97 Properties |
| 2023 | £296,168 | -10% |
111 Properties |
| 2022 | £324,761 | 11% |
130 Properties |
| 2021 | £288,757 | -8% |
170 Properties |
| 2020 | £310,494 | 24% |
123 Properties |
| 2019 | £236,570 | -17% |
266 Properties |
| 2018 | £277,774 | 12% |
149 Properties |
| 2017 | £243,862 | 6% |
133 Properties |
| 2016 | £229,331 | 14% |
118 Properties |
| 2015 | £197,210 | 17% |
120 Properties |
| 2014 | £163,744 | 4% |
140 Properties |
| 2013 | £156,496 | 7% |
85 Properties |
| 2012 | £145,186 | 1% |
105 Properties |
| 2011 | £144,219 | -3% |
66 Properties |
| 2010 | £149,031 | 6% |
77 Properties |
| 2009 | £140,726 | -14% |
75 Properties |
| 2008 | £160,019 | 1% |
82 Properties |
| 2007 | £159,174 | 9% |
140 Properties |
| 2006 | £144,925 | 2% |
152 Properties |
| 2005 | £142,187 | 5% |
134 Properties |
| 2004 | £135,313 | 8% |
159 Properties |
| 2003 | £124,096 | 18% |
137 Properties |
| 2002 | £101,146 | 17% |
202 Properties |
| 2001 | £84,301 | 14% |
177 Properties |
| 2000 | £72,273 | 12% |
159 Properties |
| 1999 | £63,787 | 16% |
170 Properties |
| 1998 | £53,694 | 6% |
148 Properties |
| 1997 | £50,457 | 8% |
142 Properties |
| 1996 | £46,435 | 4% |
95 Properties |
| 1995 | £44,768 | - |
110 Properties |
Property Price per Property Type in Crawley
Here you can find historic sold price data in order to help with your property search.
The average Property Paid Price for specific property types in the last three years are:
| Property Type | Average Sold Price | Sold Properties |
|---|---|---|
| Semi Detached House | £328,099.00 | 156 Semi Detached Houses |
| Detached House | £442,250.00 | 12 Detached Houses |
| Terraced House | £274,628.00 | 78 Terraced Houses |
| Flat | £196,811.00 | 50 Flats |