Houses for sale & to rent in Luton, Luton
House Prices in Luton
Properties in Luton have an average house price of £299,281.00 and had 5,550 Property Transactions within the last 3 years.¹
Luton is an area in Luton with 74,322 households², where the most expensive property was sold for £4,205,000.00.
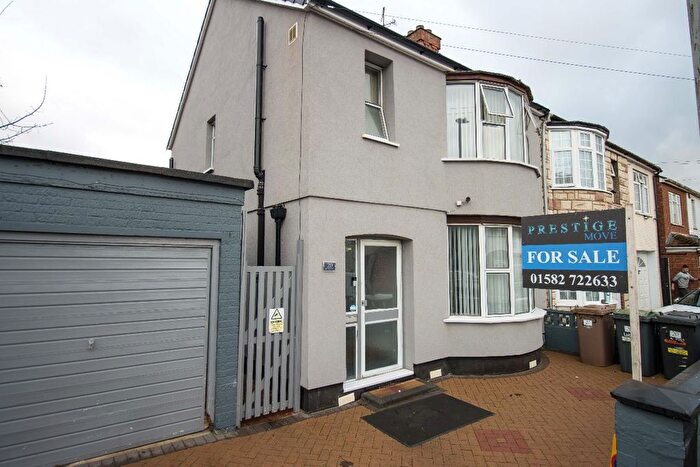
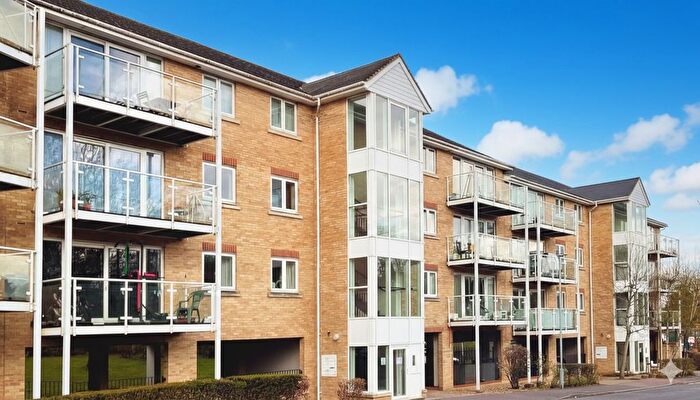
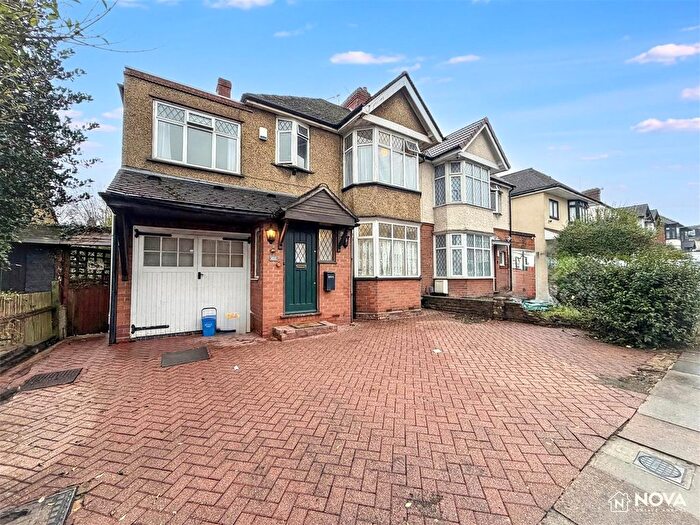
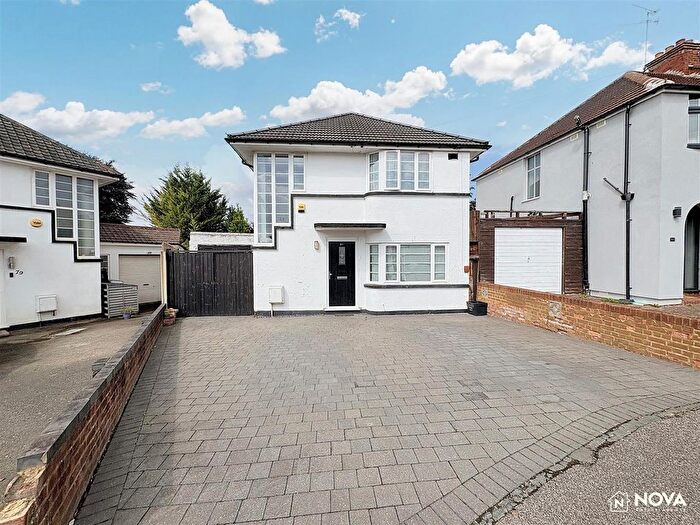
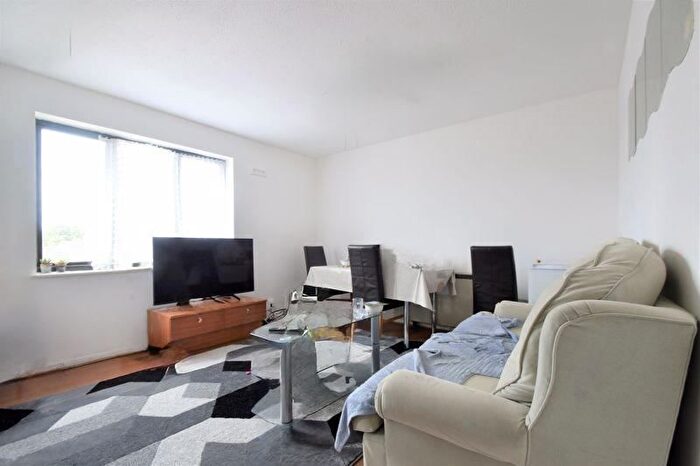
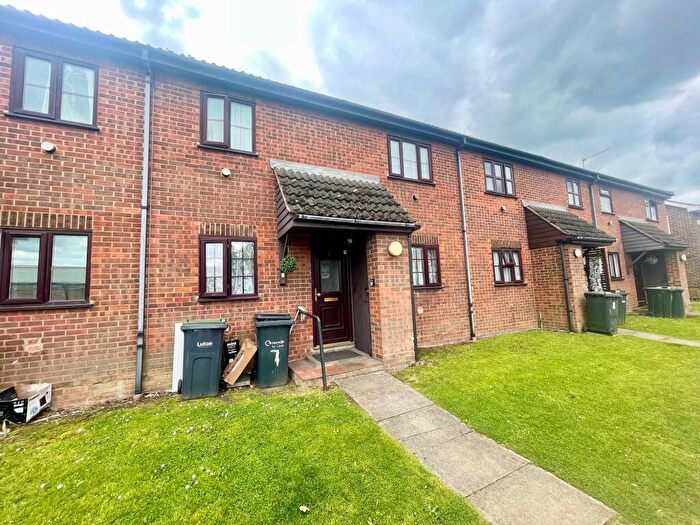
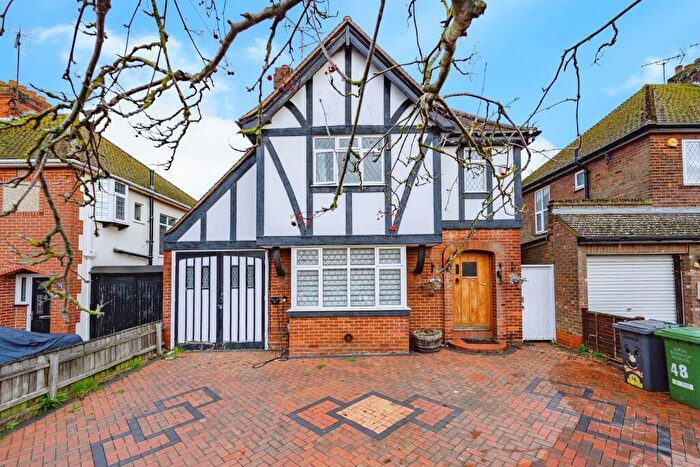
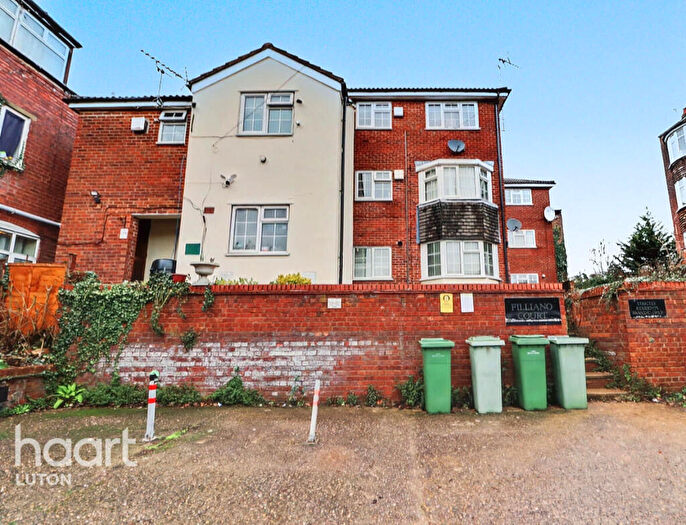
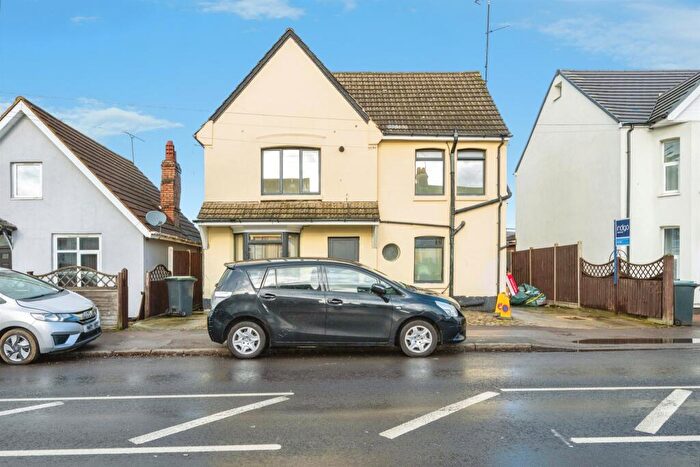
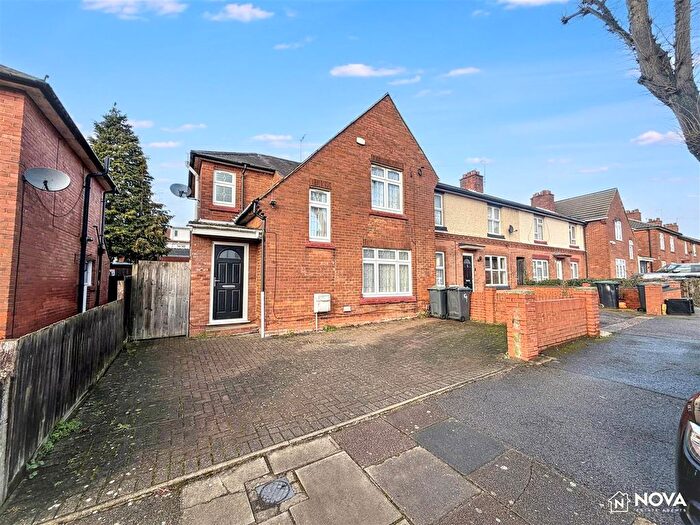
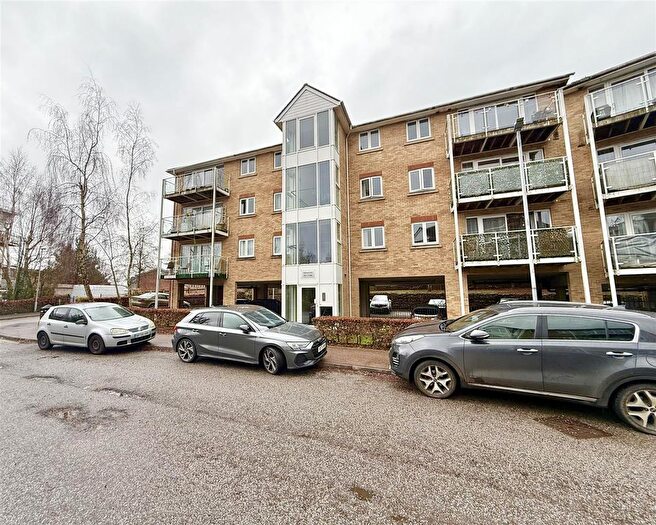
Properties for sale in Luton
Neighbourhoods in Luton
Navigate through our locations to find the location of your next house in Luton, Luton for sale or to rent.
Transport in Luton
Please see below transportation links in this area:
- FAQ
- Price Paid By Year
- Property Type Price
Frequently asked questions about Luton
What is the average price for a property for sale in Luton?
The average price for a property for sale in Luton is £299,281. There are more than 10,000 property listings for sale in Luton.
What locations have the most expensive properties for sale in Luton?
The locations with the most expensive properties for sale in Luton are Barnfield at an average of £411,038, Icknield at an average of £376,667 and Bramingham at an average of £352,127.
What locations have the most affordable properties for sale in Luton?
The locations with the most affordable properties for sale in Luton are High Town at an average of £231,813, South at an average of £235,661 and Dallow at an average of £247,731.
Which train stations are available in or near Luton?
Some of the train stations available in or near Luton are Luton, Leagrave and Luton Airport Parkway.
Property Price Paid in Luton by Year
The average sold property price by year was:
| Year | Average Sold Price | Price Change |
Sold Properties
|
|---|---|---|---|
| 2025 | £302,920 | 0,2% |
1,619 Properties |
| 2024 | £302,203 | 3% |
2,037 Properties |
| 2023 | £293,027 | -1% |
1,894 Properties |
| 2022 | £297,031 | 6% |
2,435 Properties |
| 2021 | £278,522 | 6% |
3,025 Properties |
| 2020 | £262,808 | 6% |
1,978 Properties |
| 2019 | £246,507 | 2% |
2,656 Properties |
| 2018 | £242,674 | 3% |
2,801 Properties |
| 2017 | £236,318 | 5% |
3,106 Properties |
| 2016 | £223,778 | 11% |
2,852 Properties |
| 2015 | £198,087 | 12% |
2,899 Properties |
| 2014 | £173,776 | 5% |
2,947 Properties |
| 2013 | £164,428 | 2% |
2,135 Properties |
| 2012 | £160,837 | - |
1,782 Properties |
| 2011 | £160,796 | 1% |
1,752 Properties |
| 2010 | £159,910 | 4% |
1,792 Properties |
| 2009 | £153,638 | -8% |
1,643 Properties |
| 2008 | £166,077 | -0,3% |
2,085 Properties |
| 2007 | £166,576 | 6% |
4,500 Properties |
| 2006 | £156,149 | 5% |
4,491 Properties |
| 2005 | £147,566 | 3% |
3,762 Properties |
| 2004 | £143,139 | 10% |
4,461 Properties |
| 2003 | £128,700 | 18% |
4,738 Properties |
| 2002 | £104,994 | 18% |
5,580 Properties |
| 2001 | £86,609 | 13% |
4,743 Properties |
| 2000 | £75,549 | 15% |
4,409 Properties |
| 1999 | £63,957 | 10% |
4,933 Properties |
| 1998 | £57,243 | 7% |
4,100 Properties |
| 1997 | £53,225 | 9% |
4,074 Properties |
| 1996 | £48,300 | -0,4% |
3,496 Properties |
| 1995 | £48,497 | - |
2,769 Properties |
Property Price per Property Type in Luton
Here you can find historic sold price data in order to help with your property search.
The average Property Paid Price for specific property types in the last three years are:
| Property Type | Average Sold Price | Sold Properties |
|---|---|---|
| Semi Detached House | £330,199.00 | 2,337 Semi Detached Houses |
| Terraced House | £269,044.00 | 1,643 Terraced Houses |
| Detached House | £459,636.00 | 679 Detached Houses |
| Flat | £151,741.00 | 891 Flats |

