
Houses for sale & to rent in High Town, Luton
House Prices in High Town
Properties in High Town have an average house price of £230,999.00 and had 415 Property Transactions within the last 3 years¹.
High Town is an area in Luton, Luton with 3,960 households², where the most expensive property was sold for £1,750,000.00.
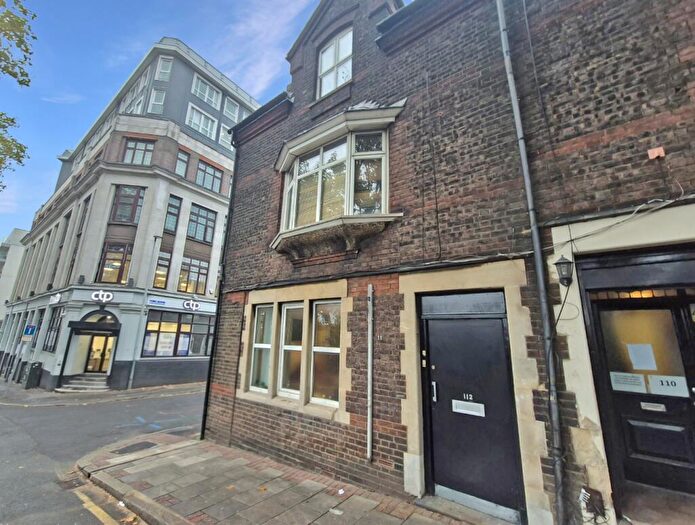
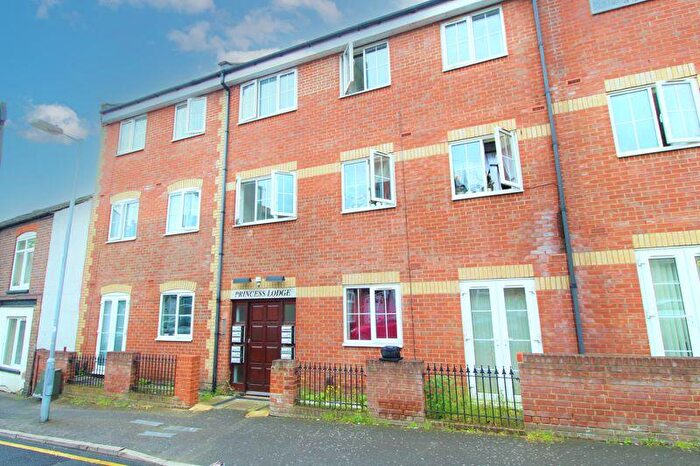
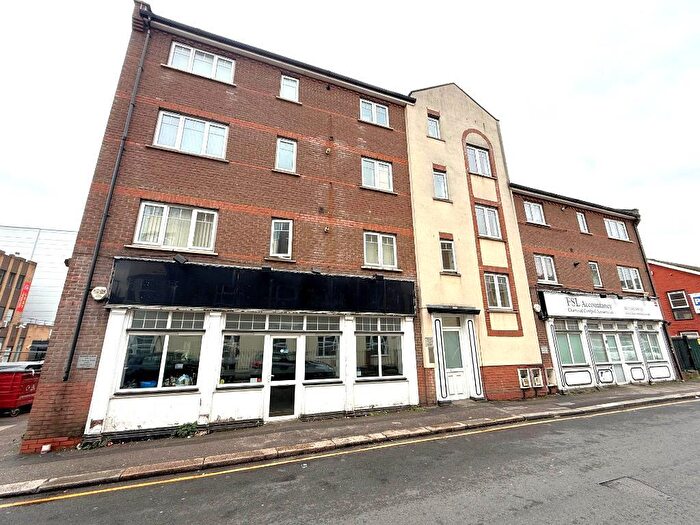
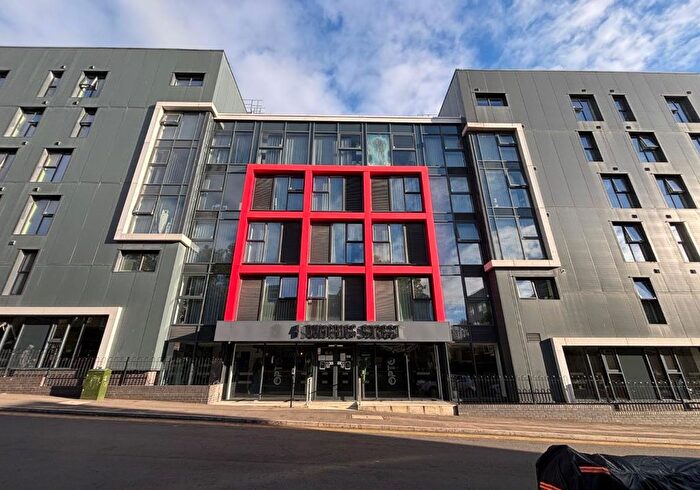
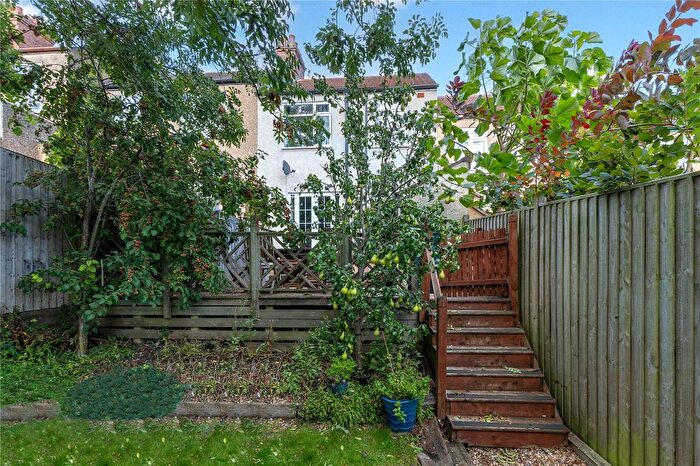
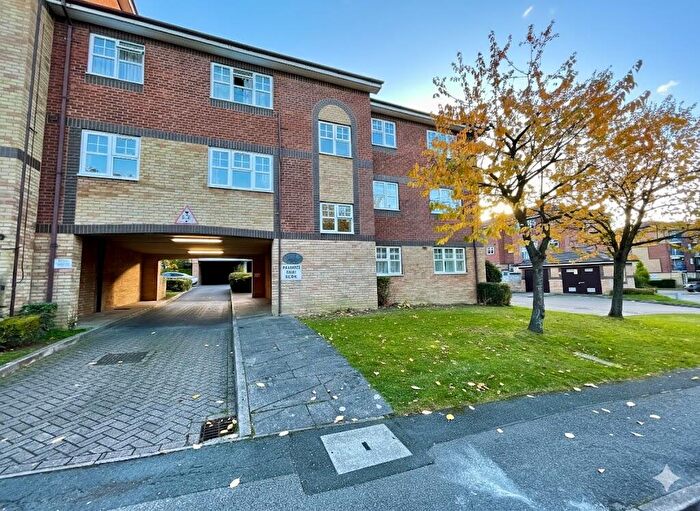
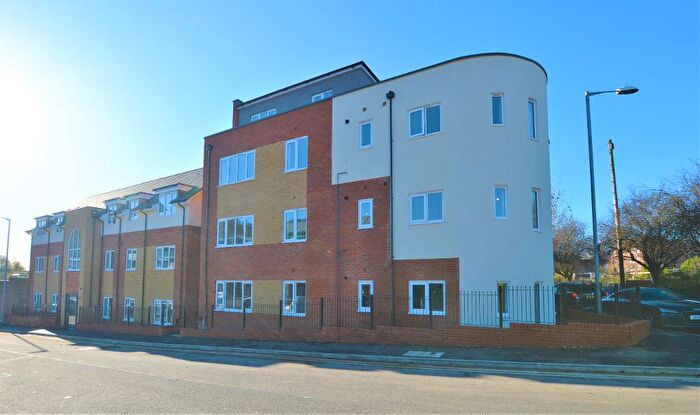
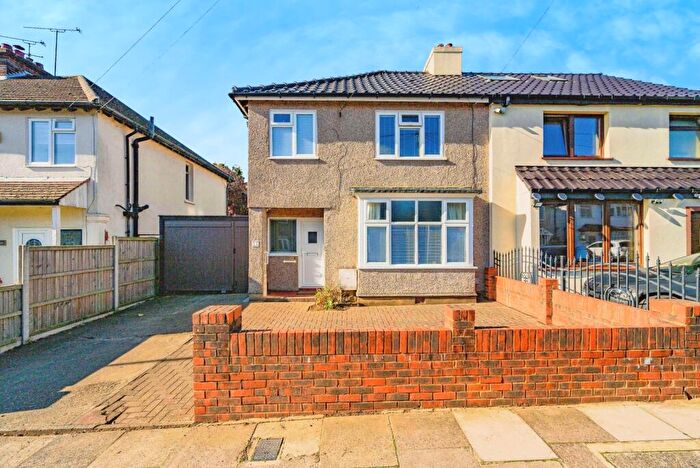
Properties for sale in High Town
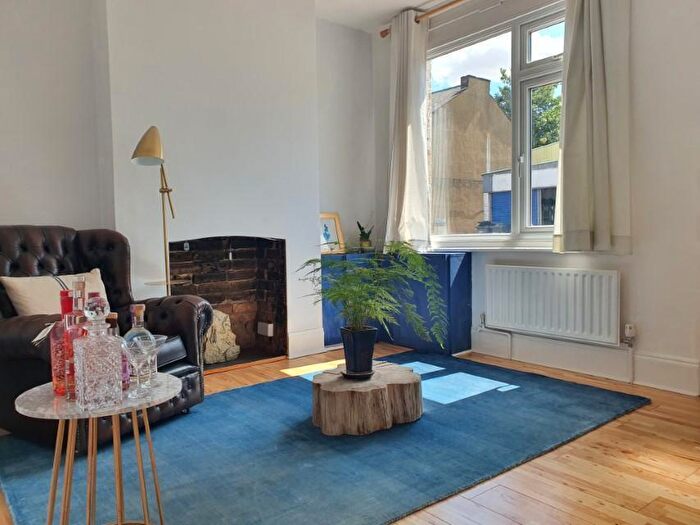
![]()
If you are looking to sell your house, let it out, or receive a property valuation, an expert can help you.
Click the button below to get started.


Roads and Postcodes in High Town
Navigate through our locations to find the location of your next house in High Town, Luton for sale or to rent.
Transport near High Town

- FAQ
- Price Paid By Year
- Property Type Price
Frequently asked questions about High Town
What is the average price for a property for sale in High Town?
The average price for a property for sale in High Town is £230,999. This amount is 22% lower than the average price in Luton. There are 4,475 property listings for sale in High Town.
What streets have the most expensive properties for sale in High Town?
The streets with the most expensive properties for sale in High Town are Greenside Park at an average of £580,000, Stockingstone Road at an average of £550,000 and Bowling Green Lane at an average of £500,000.
What streets have the most affordable properties for sale in High Town?
The streets with the most affordable properties for sale in High Town are Frederick Street Passage at an average of £90,500, Midland Road at an average of £130,836 and Dudley Street at an average of £138,285.
Which train stations are available in or near High Town?
Some of the train stations available in or near High Town are Luton, Luton Airport Parkway and Leagrave.
Property Price Paid in High Town by Year
The average sold property price by year was:
| Year | Average Sold Price | Price Change |
Sold Properties
|
|---|---|---|---|
| 2025 | £227,695 | -5% |
47 Properties |
| 2024 | £239,382 | 9% |
117 Properties |
| 2023 | £218,804 | -7% |
108 Properties |
| 2022 | £234,437 | 8% |
143 Properties |
| 2021 | £216,583 | -1% |
210 Properties |
| 2020 | £218,373 | 7% |
118 Properties |
| 2019 | £203,308 | -6% |
164 Properties |
| 2018 | £215,816 | 6% |
162 Properties |
| 2017 | £202,759 | 9% |
164 Properties |
| 2016 | £183,903 | 5% |
248 Properties |
| 2015 | £175,500 | 18% |
158 Properties |
| 2014 | £144,646 | 8% |
198 Properties |
| 2013 | £132,970 | 4% |
127 Properties |
| 2012 | £128,073 | -4% |
81 Properties |
| 2011 | £132,745 | -2% |
100 Properties |
| 2010 | £135,367 | 6% |
115 Properties |
| 2009 | £126,834 | -12% |
99 Properties |
| 2008 | £142,521 | -4% |
158 Properties |
| 2007 | £147,830 | 5% |
336 Properties |
| 2006 | £141,168 | 5% |
368 Properties |
| 2005 | £134,220 | 4% |
231 Properties |
| 2004 | £128,819 | 13% |
289 Properties |
| 2003 | £112,132 | 20% |
302 Properties |
| 2002 | £89,452 | 19% |
358 Properties |
| 2001 | £72,727 | 9% |
313 Properties |
| 2000 | £66,478 | 20% |
309 Properties |
| 1999 | £52,872 | 7% |
304 Properties |
| 1998 | £49,356 | -1% |
287 Properties |
| 1997 | £49,733 | 14% |
226 Properties |
| 1996 | £42,576 | 4% |
235 Properties |
| 1995 | £40,784 | - |
178 Properties |
Property Price per Property Type in High Town
Here you can find historic sold price data in order to help with your property search.
The average Property Paid Price for specific property types in the last three years are:
| Property Type | Average Sold Price | Sold Properties |
|---|---|---|
| Flat | £160,757.00 | 194 Flats |
| Semi Detached House | £313,830.00 | 53 Semi Detached Houses |
| Detached House | £458,875.00 | 20 Detached Houses |
| Terraced House | £262,617.00 | 148 Terraced Houses |