
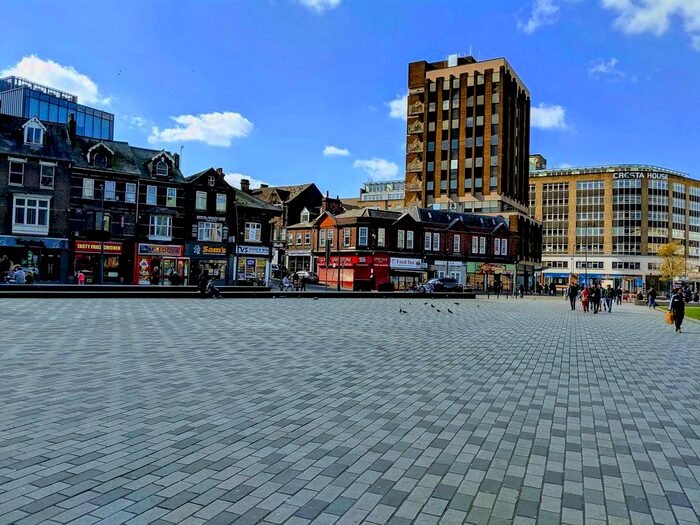
Houses for sale & to rent in South, Luton
House Prices in South
Properties in South have an average house price of £237k and had 445 Property Transactions within the last 3 years¹.
South is an area in Luton, Luton with 5,860 households², where the most expensive property was sold for £1.11M.
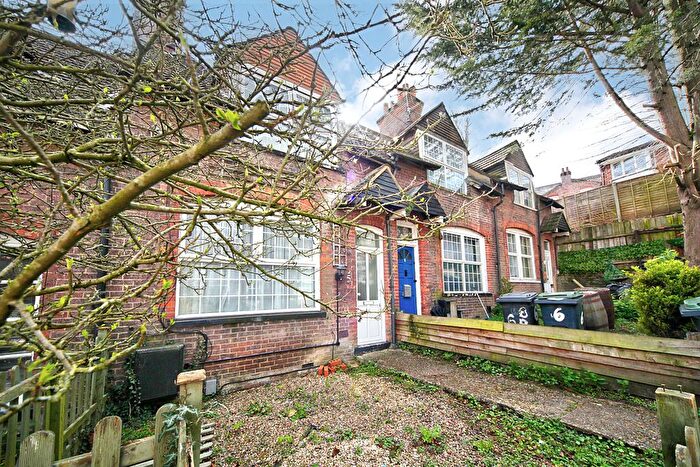
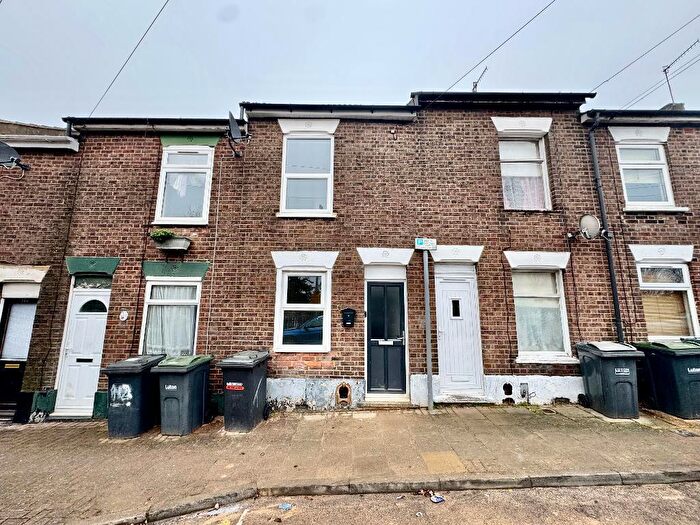
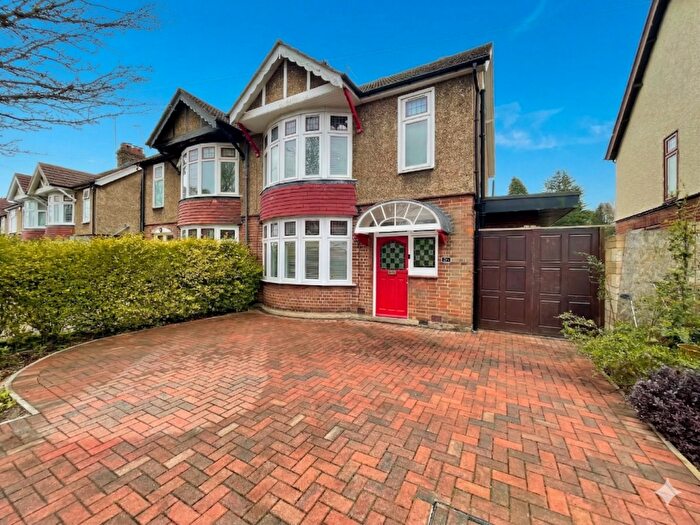
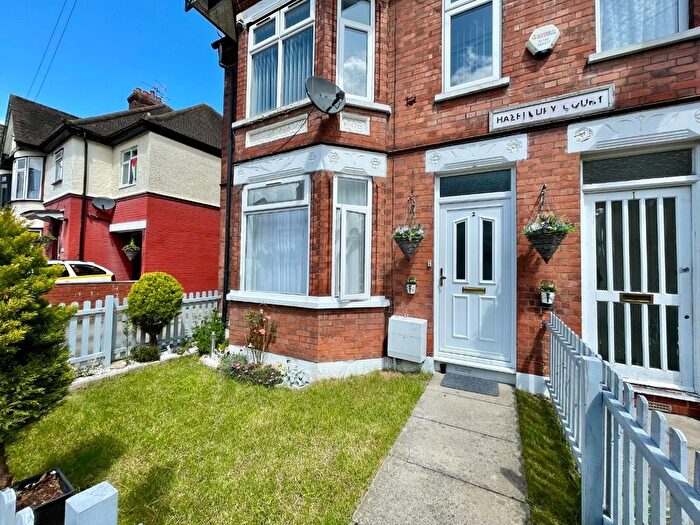
Properties for sale in South

![]()
If you are looking to sell your house, let it out, or receive a property valuation, an expert can help you.
Click the button below to get started.
Roads and Postcodes in South
Navigate through our locations to find the location of your next house in South, Luton for sale or to rent.
Transport near South

- FAQ
- Price Paid By Year
- Property Type Price
Frequently asked questions about South
What is the average price for a property for sale in South?
The average price for a property for sale in South is £237,316. This amount is 21% lower than the average price in Luton. There are 4,475 property listings for sale in South.
What streets have the most expensive properties for sale in South?
The streets with the most expensive properties for sale in South are Ludlow Avenue at an average of £492,500, Cutenhoe Road at an average of £458,961 and London Road at an average of £442,686.
What streets have the most affordable properties for sale in South?
The streets with the most affordable properties for sale in South are Cardiff Grove at an average of £65,500, Dumfries Street at an average of £82,061 and Union Street at an average of £109,166.
Which train stations are available in or near South?
Some of the train stations available in or near South are Luton, Luton Airport Parkway and Leagrave.
Property Price Paid in South by Year
The average sold property price by year was:
| Year | Average Sold Price | Price Change |
Sold Properties
|
|---|---|---|---|
| 2026 | £229,675 | -3% |
10 Properties |
| 2025 | £235,563 | 1% |
134 Properties |
| 2024 | £232,937 | -5% |
152 Properties |
| 2023 | £243,872 | 13% |
149 Properties |
| 2022 | £212,432 | -13% |
164 Properties |
| 2021 | £240,262 | 10% |
179 Properties |
| 2020 | £215,761 | 8% |
144 Properties |
| 2019 | £197,855 | 14% |
208 Properties |
| 2018 | £169,974 | 11% |
463 Properties |
| 2017 | £151,619 | -23% |
490 Properties |
| 2016 | £185,745 | 16% |
243 Properties |
| 2015 | £156,165 | 10% |
250 Properties |
| 2014 | £140,303 | 11% |
177 Properties |
| 2013 | £125,412 | -16% |
133 Properties |
| 2012 | £145,335 | 4% |
110 Properties |
| 2011 | £139,050 | 4% |
101 Properties |
| 2010 | £133,709 | -11% |
130 Properties |
| 2009 | £148,178 | 5% |
99 Properties |
| 2008 | £140,235 | -9% |
177 Properties |
| 2007 | £152,725 | 7% |
476 Properties |
| 2006 | £141,767 | 6% |
378 Properties |
| 2005 | £132,825 | -5% |
301 Properties |
| 2004 | £140,005 | 14% |
348 Properties |
| 2003 | £119,802 | 26% |
386 Properties |
| 2002 | £88,620 | 16% |
410 Properties |
| 2001 | £74,432 | 9% |
345 Properties |
| 2000 | £67,491 | 16% |
314 Properties |
| 1999 | £56,462 | 11% |
337 Properties |
| 1998 | £49,980 | 11% |
282 Properties |
| 1997 | £44,652 | 6% |
238 Properties |
| 1996 | £41,787 | -0,4% |
222 Properties |
| 1995 | £41,969 | - |
178 Properties |
Property Price per Property Type in South
Here you can find historic sold price data in order to help with your property search.
The average Property Paid Price for specific property types in the last three years are:
| Property Type | Average Sold Price | Sold Properties |
|---|---|---|
| Semi Detached House | £355,911.00 | 94 Semi Detached Houses |
| Detached House | £563,692.00 | 13 Detached Houses |
| Terraced House | £246,384.00 | 180 Terraced Houses |
| Flat | £129,574.00 | 158 Flats |