
Houses for sale & to rent in M19 1LX, Hatfield Avenue, Burnage, Manchester
House Prices in M19 1LX, Hatfield Avenue, Burnage
Properties in M19 1LX have no sales history available within the last 3 years. M19 1LX is a postcode in Hatfield Avenue located in Burnage, an area in Manchester, Manchester, with 11 households².
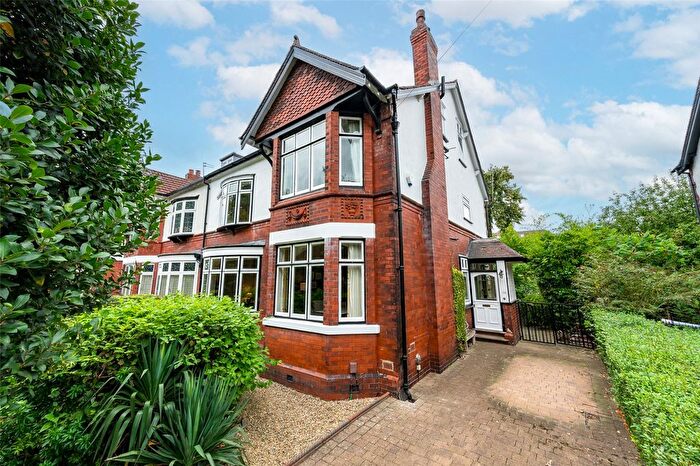
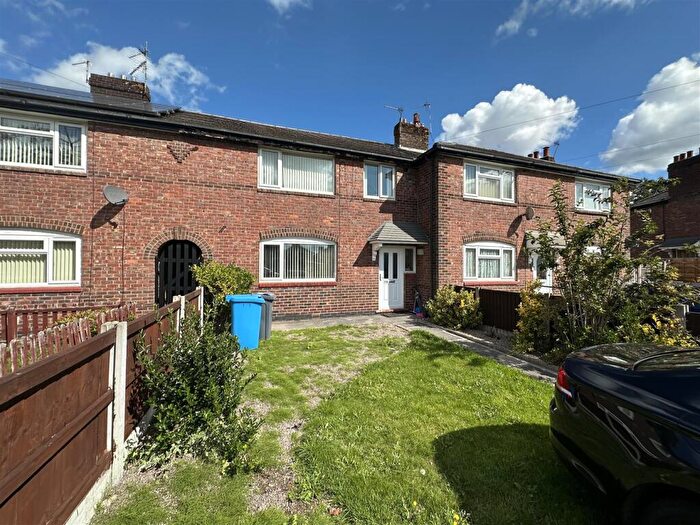
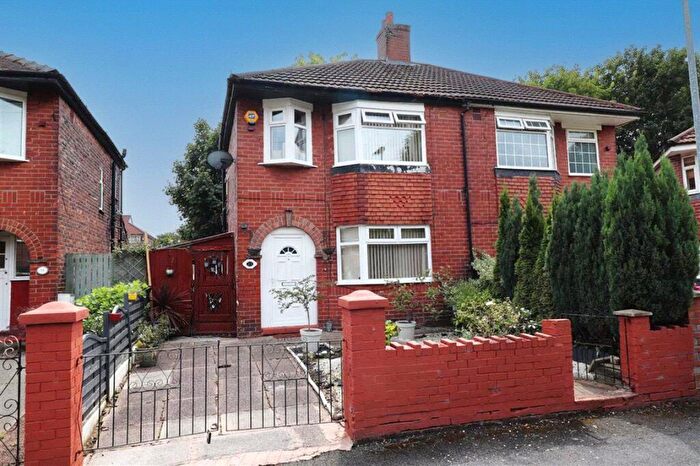
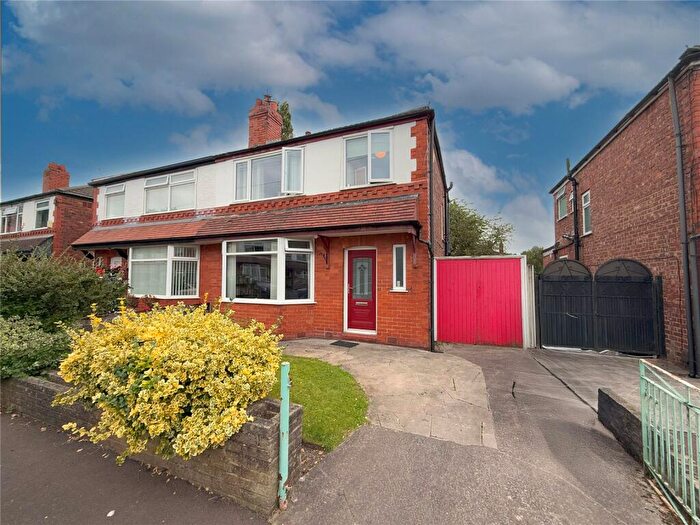
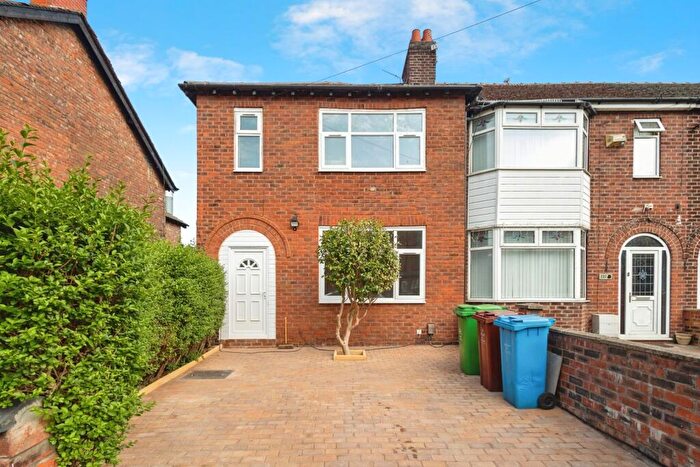
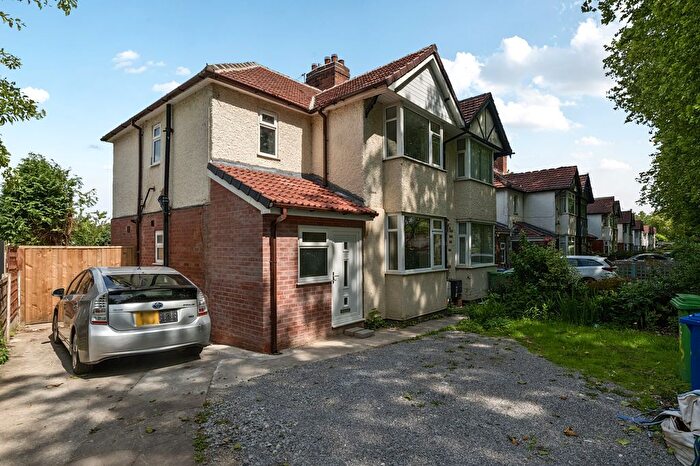
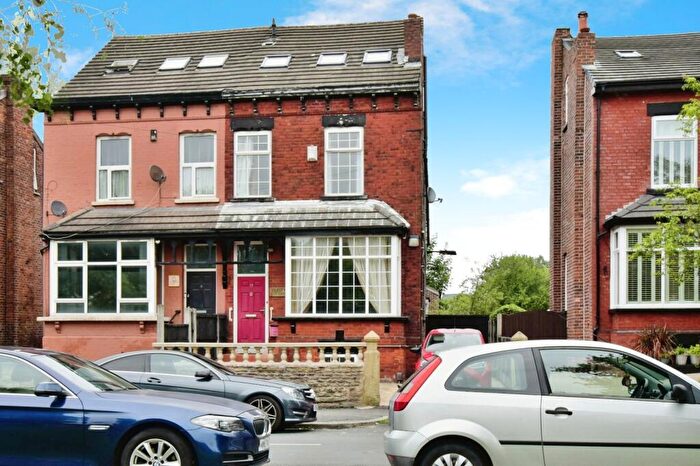
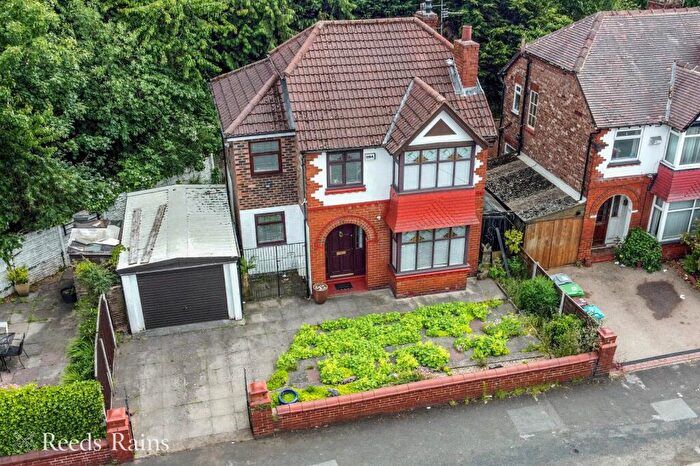
Properties for sale near M19 1LX, Hatfield Avenue


![]()
If you are looking to sell your house, let it out, or receive a property valuation, an expert can help you.
Click the button below to get started.


Price Paid in Hatfield Avenue, M19 1LX, Burnage
1 Hatfield Avenue, M19 1LX, Burnage Manchester
Property 1 has been sold 2 times. The last time it was sold was in 30/10/2020 and the sold price was £199,000.00.
This semi detached house, sold as a freehold on 30/10/2020, is a 72 sqm semi-detached house with an EPC rating of D.
| Date | Price | Property Type | Tenure | Classification |
|---|---|---|---|---|
| 30/10/2020 | £199,000.00 | Semi Detached House | freehold | Established Building |
| 20/12/2004 | £56,500.00 | Semi Detached House | freehold | Established Building |
4 Hatfield Avenue, M19 1LX, Burnage Manchester
Property 4 has been sold 3 times. The last time it was sold was in 02/09/2005 and the sold price was £116,500.00.
This semi detached house, sold as a freehold on 02/09/2005, is a 75 sqm semi-detached house with an EPC rating of C.
| Date | Price | Property Type | Tenure | Classification |
|---|---|---|---|---|
| 02/09/2005 | £116,500.00 | Semi Detached House | freehold | Established Building |
| 06/09/2001 | £40,000.00 | Semi Detached House | freehold | Established Building |
| 31/03/1995 | £22,680.00 | Semi Detached House | freehold | Established Building |
Transport near M19 1LX, Hatfield Avenue
-
 Mauldeth Road Station
 -
Heaton Chapel Station
-
Levenshulme Station
-
Burnage Station
-
Reddish South Station
-
East Didsbury Station
-
Ryder Brow Station
-
Reddish North Station
-
Stockport Station
-
Belle Vue Station
House price paid reports for M19 1LX, Hatfield Avenue
Click on the buttons below to see price paid reports by year or property price:
- Price Paid By Year
Property Price Paid in M19 1LX, Hatfield Avenue by Year
The average sold property price by year was:
| Year | Average Sold Price | Price Change |
Sold Properties
|
|---|---|---|---|
| 2020 | £199,000 | 41% |
1 Property |
| 2005 | £116,500 | 52% |
1 Property |
| 2004 | £56,500 | 29% |
1 Property |
| 2001 | £40,000 | 43% |
1 Property |
| 1995 | £22,680 | - |
1 Property |