
Houses for sale in Manchester, Manchester
House Prices in Manchester
Properties in Manchester have an average house price of £261k and had 15,914 Property Transactions within the last 3 years.¹
Manchester is an area in Manchester with 215,620 households², where the most expensive property was sold for £3.19M.
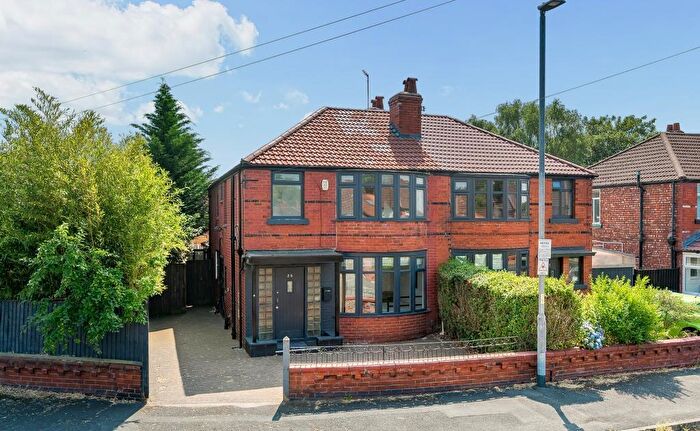
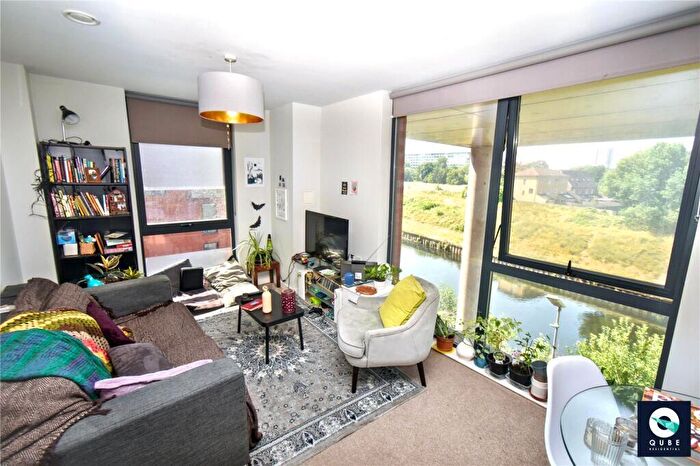
Properties for sale in Manchester


![]()
If you are looking to sell your house, let it out, or receive a property valuation, an expert can help you.
Click the button below to get started.


Neighbourhoods in Manchester
Navigate through our locations to find the location of your next house in Manchester, Manchester for sale or to rent.
- Blackfriars & Trinity
- Ancoats And Clayton
- Ardwick
- Baguley
- Bradford
- Brooklands
- Burnage
- Charlestown
- Cheetham
- Chorlton
- Chorlton Park
- City Centre
- Crumpsall
- Didsbury East
- Didsbury West
- Fallowfield
- Gorton North
- Gorton South
- Harpurhey
- Higher Blackley
- Hulme
- Levenshulme
- Longsight
- Miles Platting And Newton Heath
- Moss Side
- Moston
- Northenden
- Old Moat
- Rusholme
- Sharston
- Whalley Range
- Withington
- Woodhouse Park
- Deansgate
- Piccadilly
- Clayton & Openshaw
- Ancoats & Beswick
- Gorton & Abbey Hey
- Miles Platting & Newton Heath
Property price trends in Manchester
According to the latest Land Registry data, the average home in Manchester sold for £281,333 in 2026. That figure comes from a substantial record of 232,199 sales logged over the past 31 years.
Prices have continued to climb over the last three years. Compared with 2023, when the typical sale came in around £252,904, that's a rise of roughly 11.2%.
Looking back five years, average prices are up about 20.2% since 2021, a gain of around £47,246 in cash terms.
Zoom out to the past decade for the fuller picture. Back in 2016, homes here averaged £171,154, so the typical sold price has climbed about 64.4% since then, roughly 5.1% a year. Stretch the view to fifteen years and that annual pace eases back to about 4.5%.
Frequently asked questions about Manchester
What is the average price for a property for sale in Manchester?
The average price for a property for sale in Manchester is £261,019. This amount is 0.54% lower than the average price in Manchester. There are more than 10,000 property listings for sale in Manchester.
What locations have the most expensive properties for sale in Manchester?
The locations with the most expensive properties for sale in Manchester are Didsbury East at an average of £464,048, Deansgate at an average of £451,887 and Chorlton at an average of £410,954.
What locations have the most affordable properties for sale in Manchester?
The locations with the most affordable properties for sale in Manchester are Harpurhey at an average of £149,426, Gorton North at an average of £160,190 and Miles Platting And Newton Heath at an average of £170,224.
Which train stations are available in or near Manchester?
Some of the train stations available in or near Manchester are Ardwick, Manchester Oxford Road and Manchester Piccadilly.
Property Price Paid in Manchester by Year
The average sold property price by year was:
| Year | Average Sold Price | Price Change |
Sold Properties
|
|---|---|---|---|
| 2026 | £281,333 | 4% |
408 Properties |
| 2025 | £271,440 | 5% |
5,124 Properties |
| 2024 | £257,077 | 2% |
5,408 Properties |
| 2023 | £252,904 | 2% |
4,974 Properties |
| 2022 | £248,123 | 6% |
6,320 Properties |
| 2021 | £234,087 | 3% |
7,432 Properties |
| 2020 | £226,412 | 10% |
6,492 Properties |
| 2019 | £204,067 | 3% |
7,026 Properties |
| 2018 | £198,464 | 6% |
7,518 Properties |
| 2017 | £187,475 | 9% |
7,992 Properties |
Property Price per Property Type in Manchester
Here you can find historic sold price data in order to help with your property search.
The average Property Paid Price for specific property types in the last three years are:
| Property Type | Average Sold Price | Sold Properties |
|---|---|---|
| Semi Detached House | £320,184.00 | 4,453 Semi Detached Houses |
| Terraced House | £240,438.00 | 5,904 Terraced Houses |
| Detached House | £466,792.00 | 592 Detached Houses |
| Flat | £207,892.00 | 4,965 Flats |
Transport in Manchester
Please see below transportation links in this area:
