
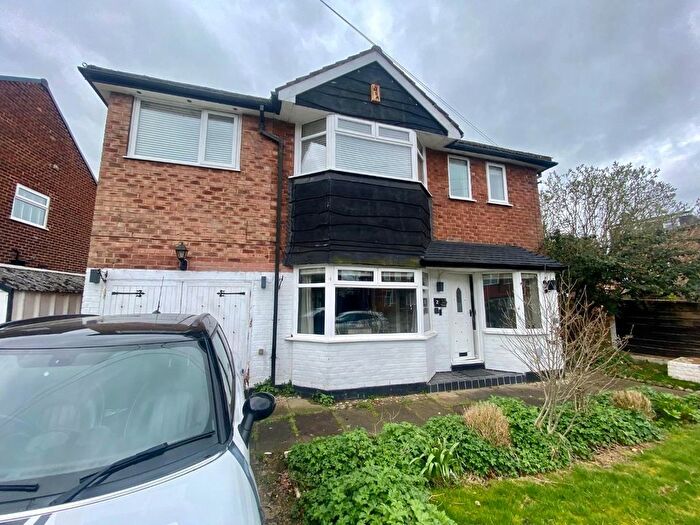
Houses for sale & to rent in Northenden, Manchester
House Prices in Northenden
Properties in Northenden have an average house price of £278k and had 511 Property Transactions within the last 3 years¹.
Northenden is an area in Manchester, Manchester with 6,432 households², where the most expensive property was sold for £850k.
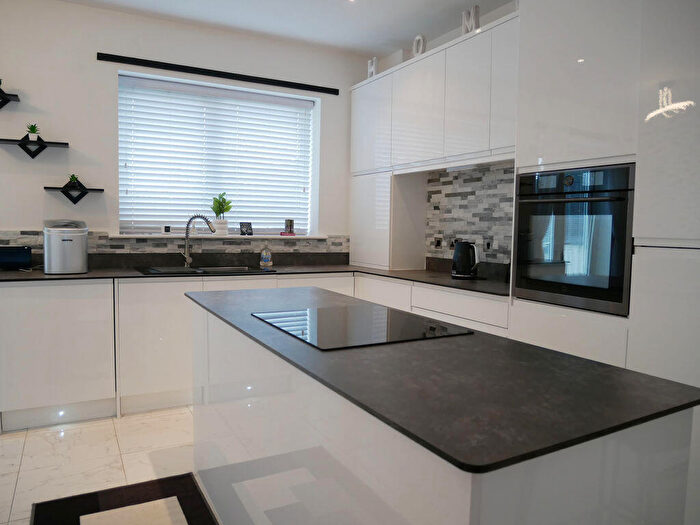
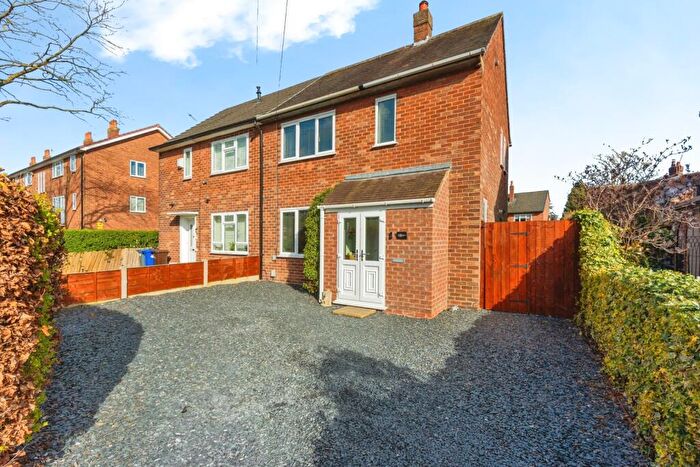
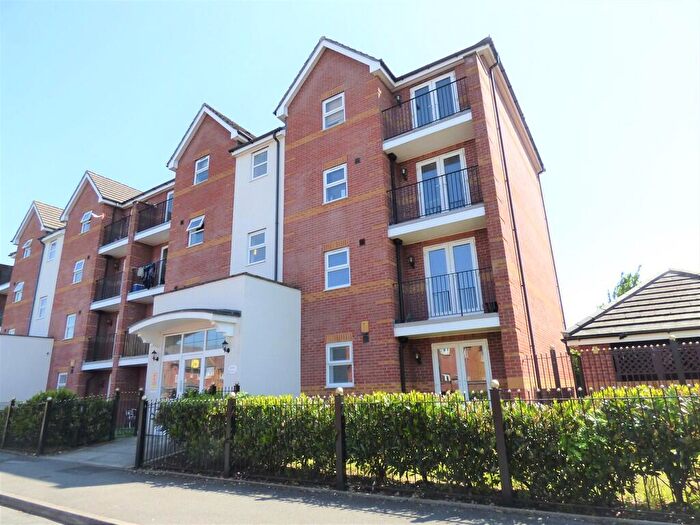
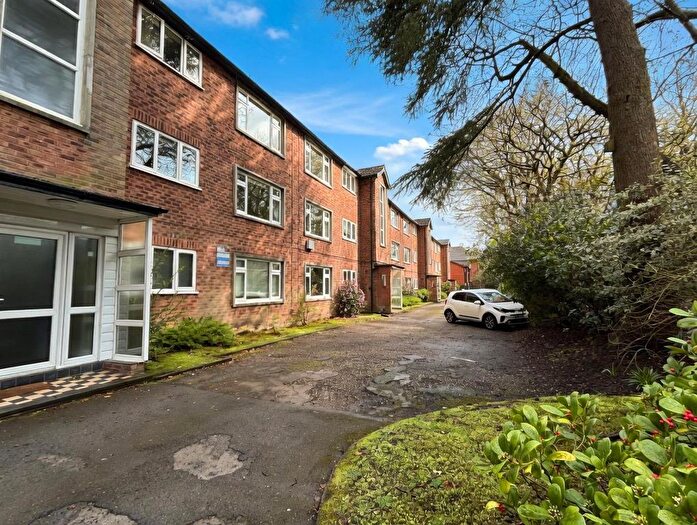
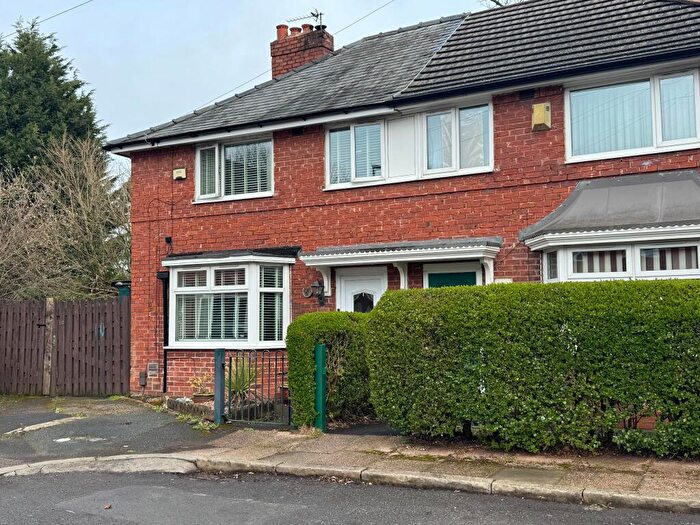
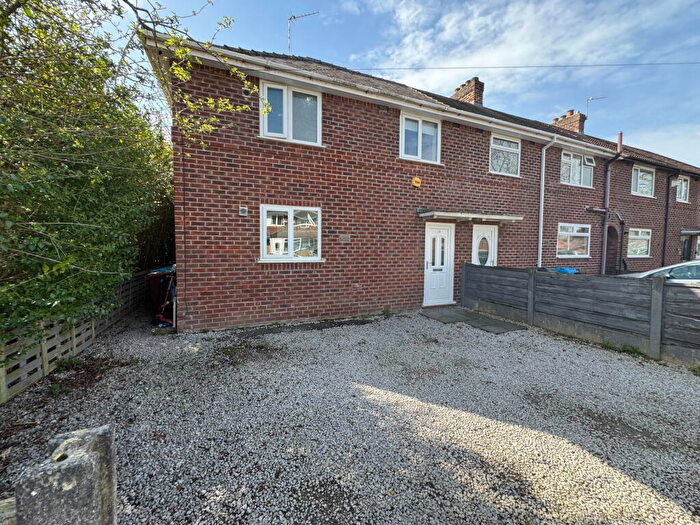
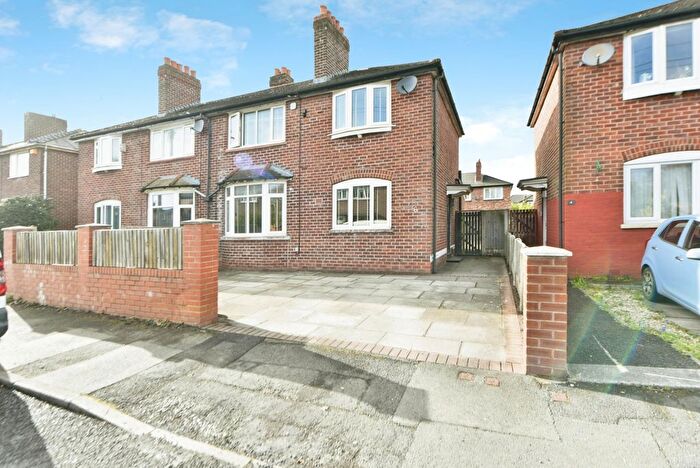
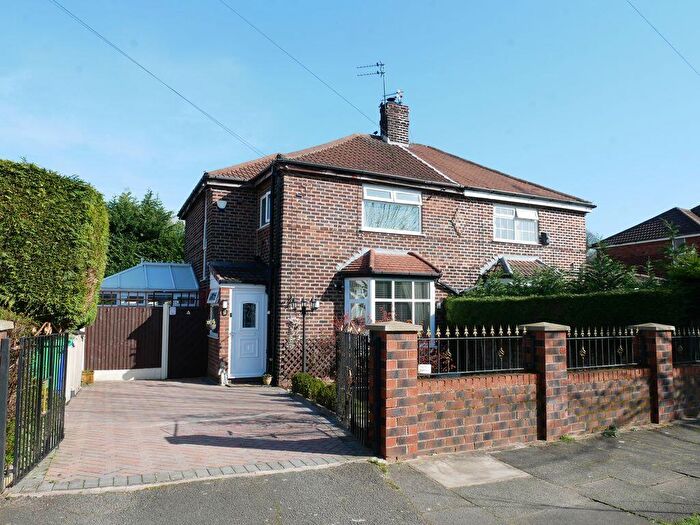
Properties for sale in Northenden
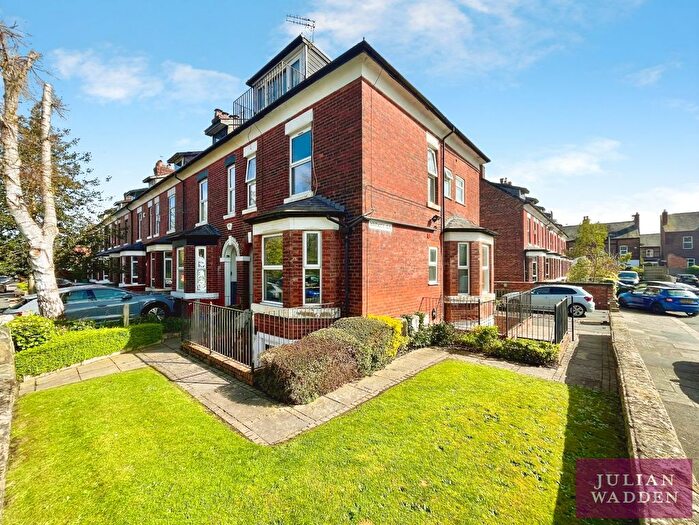
![]()
If you are looking to sell your house, let it out, or receive a property valuation, an expert can help you.
Click the button below to get started.


Roads and Postcodes in Northenden
Navigate through our locations to find the location of your next house in Northenden, Manchester for sale or to rent.
Transport near Northenden

- FAQ
- Price Paid By Year
- Property Type Price
Frequently asked questions about Northenden
What is the average price for a property for sale in Northenden?
The average price for a property for sale in Northenden is £278,101. This amount is 7% higher than the average price in Manchester. There are 3,313 property listings for sale in Northenden.
What streets have the most expensive properties for sale in Northenden?
The streets with the most expensive properties for sale in Northenden are Gibwood Road at an average of £620,666, Netherwood Road at an average of £618,333 and Bartley Road at an average of £570,000.
What streets have the most affordable properties for sale in Northenden?
The streets with the most affordable properties for sale in Northenden are New Oak Close at an average of £104,625, Topcroft Close at an average of £115,000 and Mapley Avenue at an average of £130,000.
Which train stations are available in or near Northenden?
Some of the train stations available in or near Northenden are Gatley, East Didsbury and Burnage.
Property Price Paid in Northenden by Year
The average sold property price by year was:
| Year | Average Sold Price | Price Change |
Sold Properties
|
|---|---|---|---|
| 2026 | £241,000 | -20% |
4 Properties |
| 2025 | £290,136 | -1% |
174 Properties |
| 2024 | £291,663 | 17% |
200 Properties |
| 2023 | £243,079 | -9% |
133 Properties |
| 2022 | £265,647 | 13% |
182 Properties |
| 2021 | £230,093 | 6% |
211 Properties |
| 2020 | £216,441 | 9% |
158 Properties |
| 2019 | £197,587 | 2% |
188 Properties |
| 2018 | £193,851 | 3% |
199 Properties |
| 2017 | £188,167 | 4% |
231 Properties |
| 2016 | £180,365 | 2% |
259 Properties |
| 2015 | £177,543 | 12% |
209 Properties |
| 2014 | £155,958 | 13% |
192 Properties |
| 2013 | £136,265 | -5% |
158 Properties |
| 2012 | £142,985 | 8% |
124 Properties |
| 2011 | £130,993 | -9% |
99 Properties |
| 2010 | £142,257 | 1% |
104 Properties |
| 2009 | £140,467 | -2% |
124 Properties |
| 2008 | £143,159 | -5% |
126 Properties |
| 2007 | £150,742 | -1% |
339 Properties |
| 2006 | £151,523 | 9% |
304 Properties |
| 2005 | £137,143 | 11% |
265 Properties |
| 2004 | £121,538 | 8% |
319 Properties |
| 2003 | £111,780 | 21% |
259 Properties |
| 2002 | £88,122 | 8% |
256 Properties |
| 2001 | £80,950 | 4% |
187 Properties |
| 2000 | £77,551 | 20% |
222 Properties |
| 1999 | £62,028 | 8% |
195 Properties |
| 1998 | £57,207 | 1% |
155 Properties |
| 1997 | £56,854 | 12% |
165 Properties |
| 1996 | £50,040 | -20% |
137 Properties |
| 1995 | £59,985 | - |
160 Properties |
Property Price per Property Type in Northenden
Here you can find historic sold price data in order to help with your property search.
The average Property Paid Price for specific property types in the last three years are:
| Property Type | Average Sold Price | Sold Properties |
|---|---|---|
| Semi Detached House | £289,867.00 | 257 Semi Detached Houses |
| Detached House | £465,863.00 | 47 Detached Houses |
| Terraced House | £250,350.00 | 140 Terraced Houses |
| Flat | £159,241.00 | 67 Flats |