
Houses for sale & to rent in Whalley Range, Manchester
House Prices in Whalley Range
Properties in Whalley Range have an average house price of £325k and had 483 Property Transactions within the last 3 years¹.
Whalley Range is an area in Manchester, Manchester with 6,320 households², where the most expensive property was sold for £1.06M.
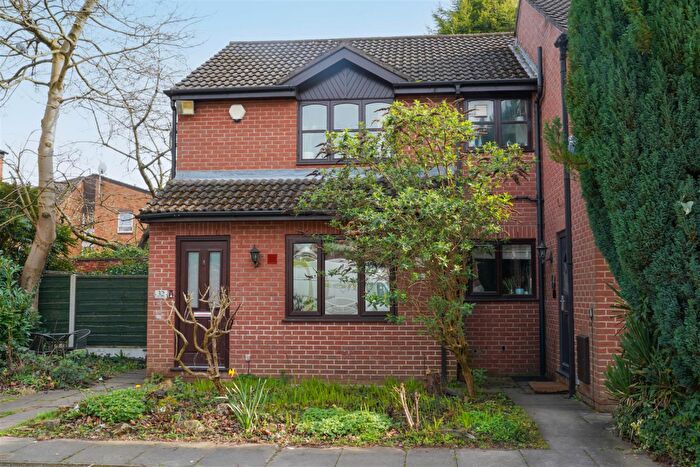
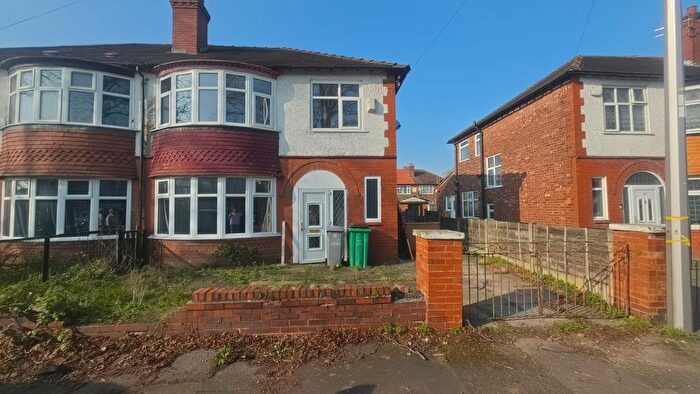
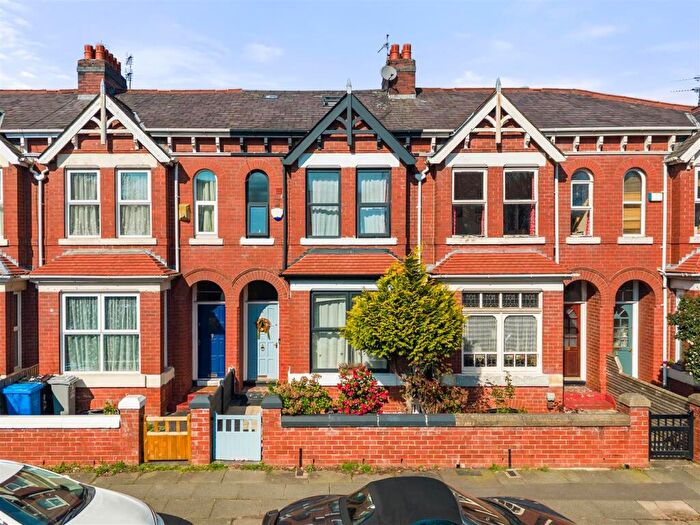
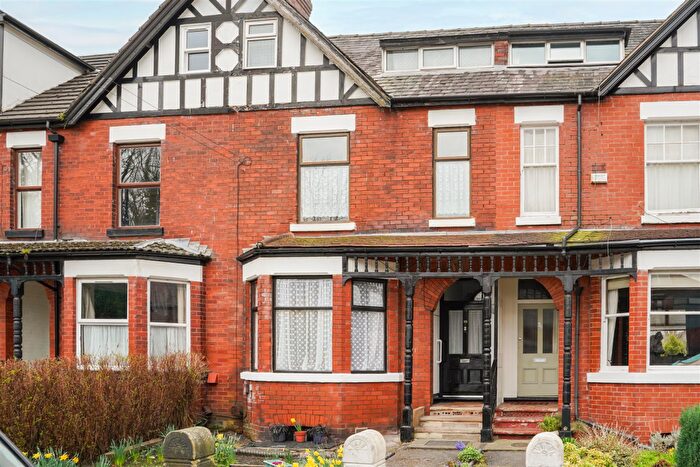
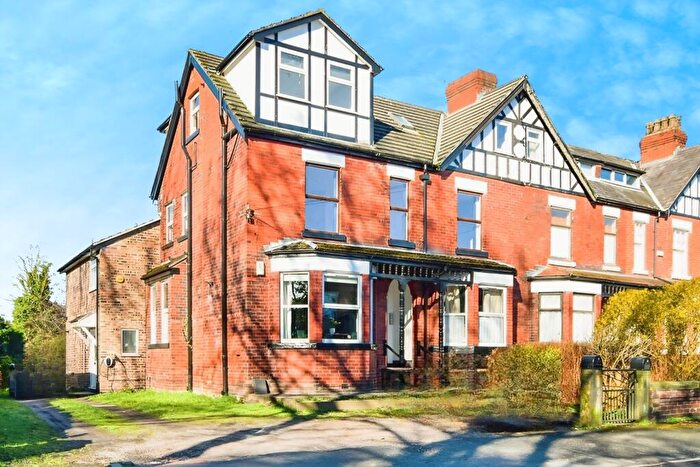
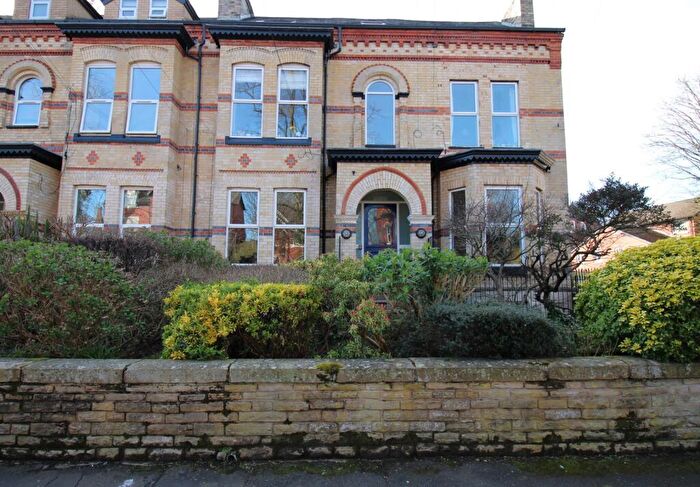
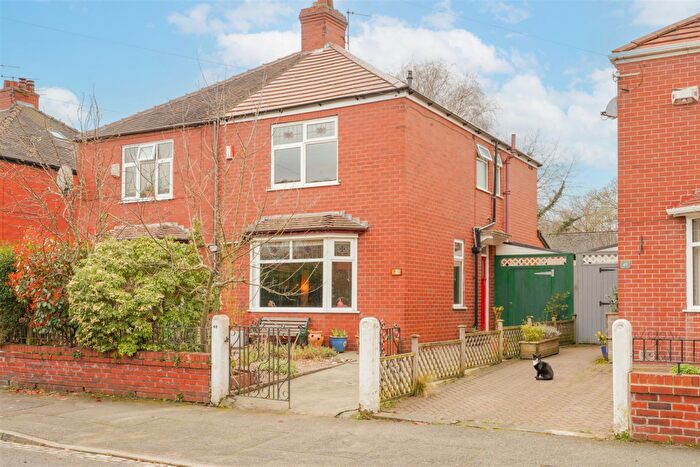
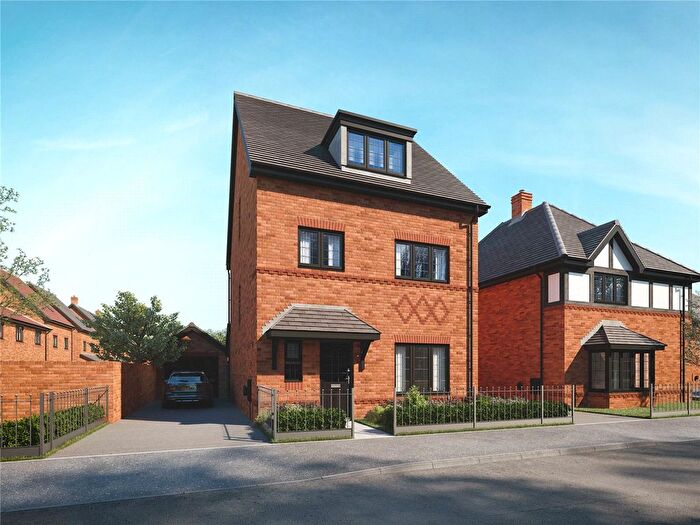
Properties for sale in Whalley Range
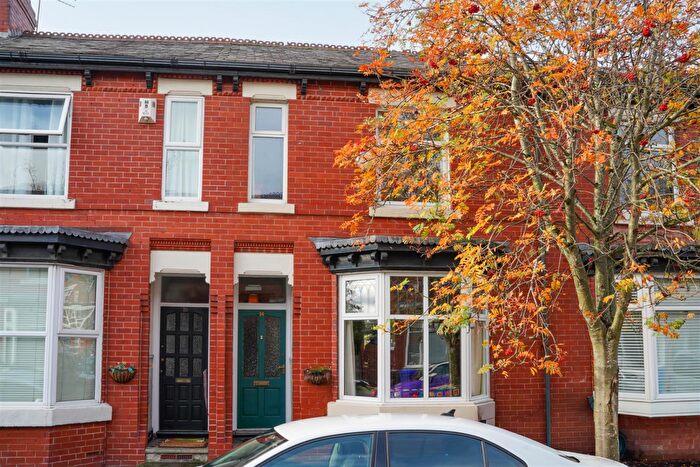
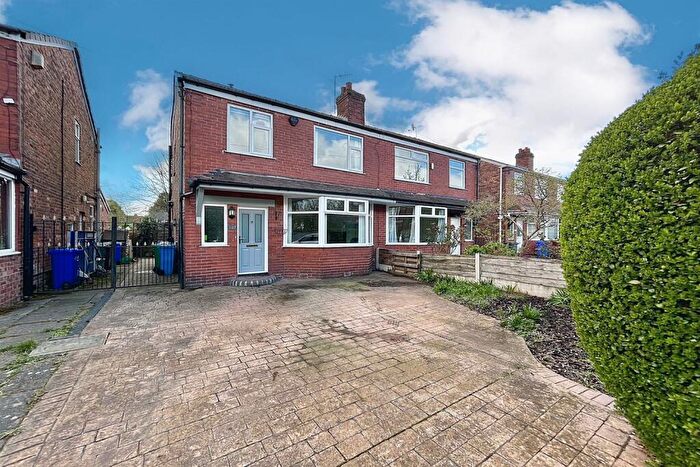
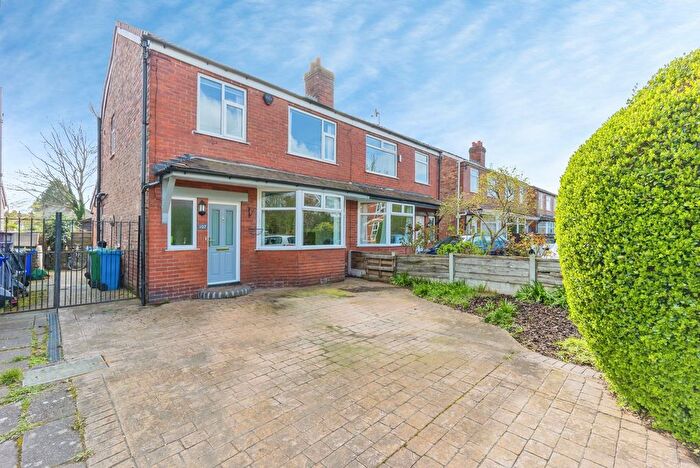
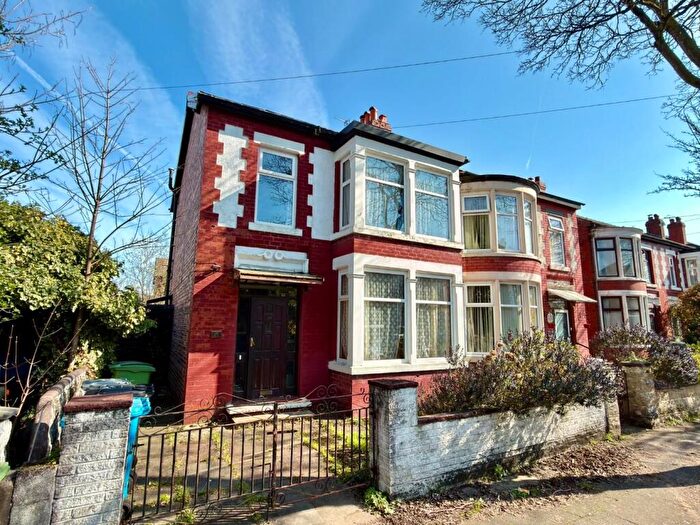
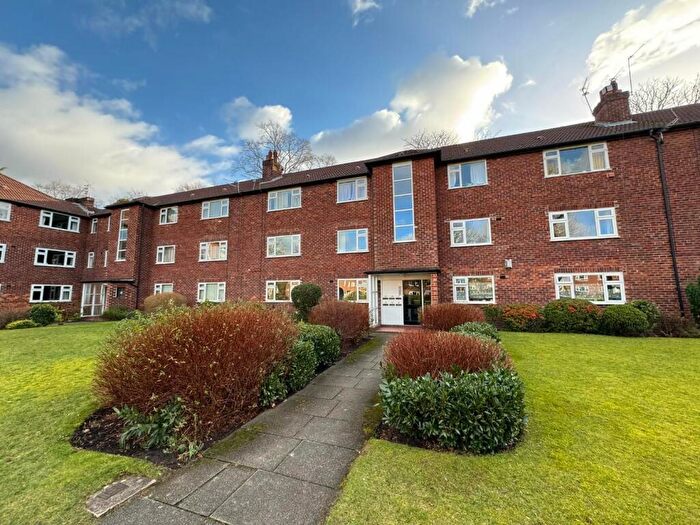

![]()
If you are looking to sell your house, let it out, or receive a property valuation, an expert can help you.
Click the button below to get started.


Roads and Postcodes in Whalley Range
Navigate through our locations to find the location of your next house in Whalley Range, Manchester for sale or to rent.
Transport near Whalley Range
-
 Manchester United Football Ground Station
 -
Deansgate Station
-
Manchester Oxford Road Station
-
Trafford Park Station
-
Manchester Piccadilly Station
-
Mauldeth Road Station
-
Salford Central Station
-
Ardwick Station
-
Burnage Station
-
Salford Crescent Station
- FAQ
- Price Paid By Year
- Property Type Price
Frequently asked questions about Whalley Range
What is the average price for a property for sale in Whalley Range?
The average price for a property for sale in Whalley Range is £325,007. This amount is 25% higher than the average price in Manchester. There are 1,871 property listings for sale in Whalley Range.
What streets have the most expensive properties for sale in Whalley Range?
The streets with the most expensive properties for sale in Whalley Range are Chandos Road South at an average of £926,000, Ellesmere Road South at an average of £872,500 and Chandos Road at an average of £847,000.
What streets have the most affordable properties for sale in Whalley Range?
The streets with the most affordable properties for sale in Whalley Range are Marchwood Avenue at an average of £120,000, Demesne Road at an average of £140,437 and Cotterdale Close at an average of £156,100.
Which train stations are available in or near Whalley Range?
Some of the train stations available in or near Whalley Range are Manchester United Football Ground, Deansgate and Manchester Oxford Road.
Property Price Paid in Whalley Range by Year
The average sold property price by year was:
| Year | Average Sold Price | Price Change |
Sold Properties
|
|---|---|---|---|
| 2026 | £276,812 | -26% |
8 Properties |
| 2025 | £348,902 | 10% |
163 Properties |
| 2024 | £313,476 | -0,2% |
150 Properties |
| 2023 | £314,022 | -0,3% |
162 Properties |
| 2022 | £314,957 | 3% |
192 Properties |
| 2021 | £305,086 | 3% |
222 Properties |
| 2020 | £295,223 | 6% |
169 Properties |
| 2019 | £276,551 | 10% |
177 Properties |
| 2018 | £249,646 | -3% |
166 Properties |
| 2017 | £256,826 | 22% |
218 Properties |
| 2016 | £200,371 | 4% |
251 Properties |
| 2015 | £192,609 | 2% |
268 Properties |
| 2014 | £188,878 | -8% |
219 Properties |
| 2013 | £204,060 | -6% |
165 Properties |
| 2012 | £216,177 | 13% |
139 Properties |
| 2011 | £187,581 | 10% |
142 Properties |
| 2010 | £168,282 | -2% |
163 Properties |
| 2009 | £172,260 | -11% |
116 Properties |
| 2008 | £190,680 | -1% |
104 Properties |
| 2007 | £193,253 | 6% |
327 Properties |
| 2006 | £181,250 | 8% |
362 Properties |
| 2005 | £166,321 | 11% |
350 Properties |
| 2004 | £147,618 | 10% |
411 Properties |
| 2003 | £132,829 | 26% |
421 Properties |
| 2002 | £98,458 | 15% |
386 Properties |
| 2001 | £83,964 | 15% |
345 Properties |
| 2000 | £71,024 | 25% |
291 Properties |
| 1999 | £53,080 | 5% |
299 Properties |
| 1998 | £50,211 | 6% |
228 Properties |
| 1997 | £47,187 | -2% |
227 Properties |
| 1996 | £47,977 | 2% |
162 Properties |
| 1995 | £46,974 | - |
170 Properties |
Property Price per Property Type in Whalley Range
Here you can find historic sold price data in order to help with your property search.
The average Property Paid Price for specific property types in the last three years are:
| Property Type | Average Sold Price | Sold Properties |
|---|---|---|
| Semi Detached House | £475,062.00 | 169 Semi Detached Houses |
| Detached House | £499,965.00 | 16 Detached Houses |
| Terraced House | £334,079.00 | 100 Terraced Houses |
| Flat | £178,210.00 | 198 Flats |