
Houses for sale & to rent in Central Milton Keynes, Milton Keynes
House Prices in Central Milton Keynes
Properties in Central Milton Keynes have an average house price of £263k and had 392 Property Transactions within the last 3 years¹.
Central Milton Keynes is an area in Milton Keynes, Milton Keynes with 6,086 households², where the most expensive property was sold for £650k.
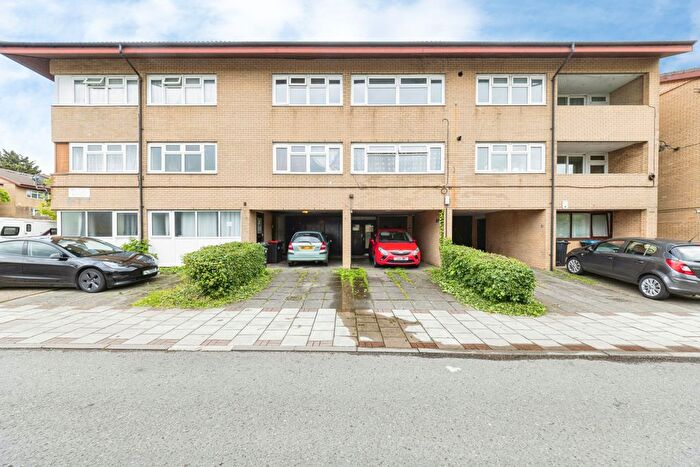
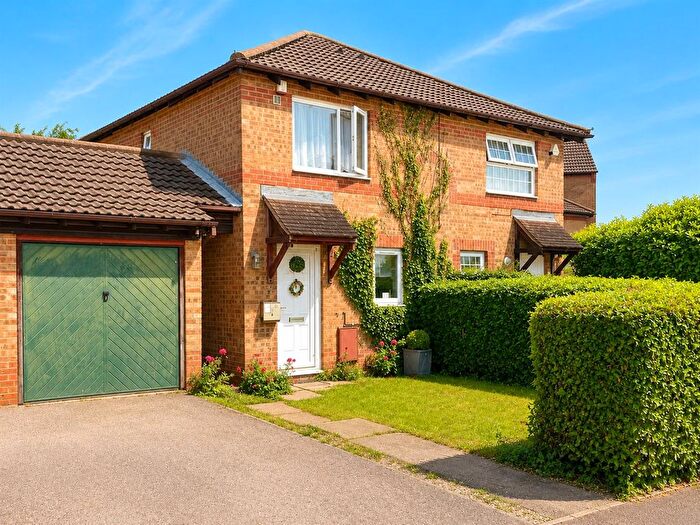
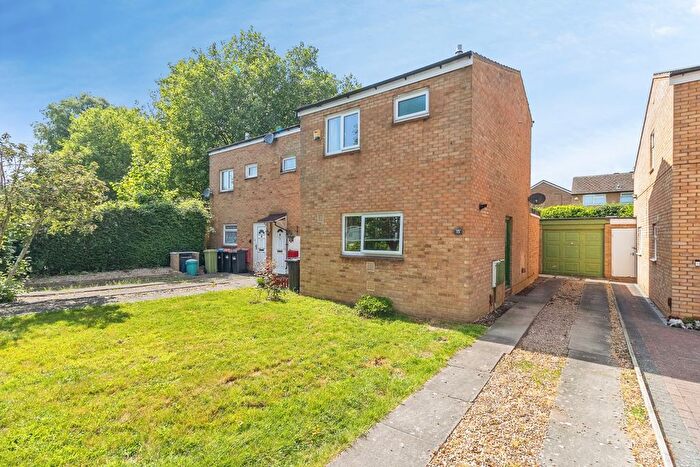
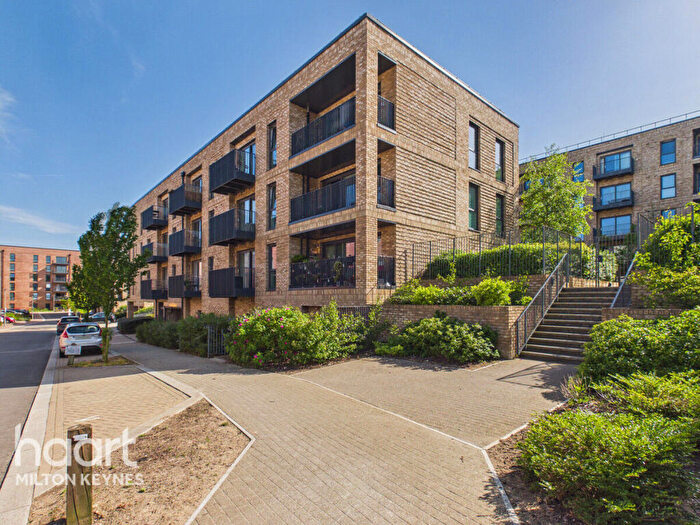
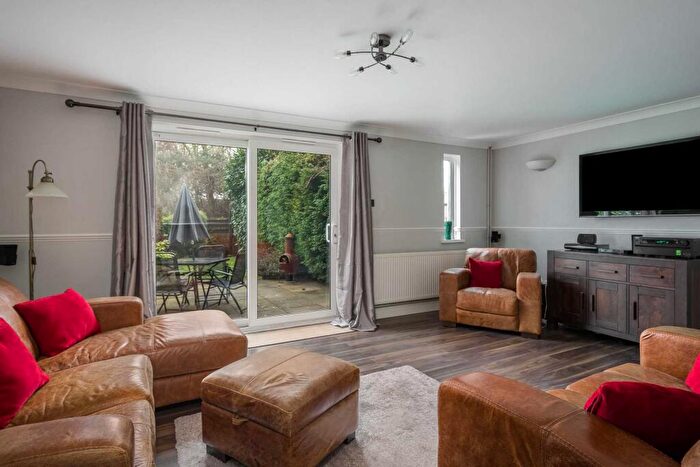
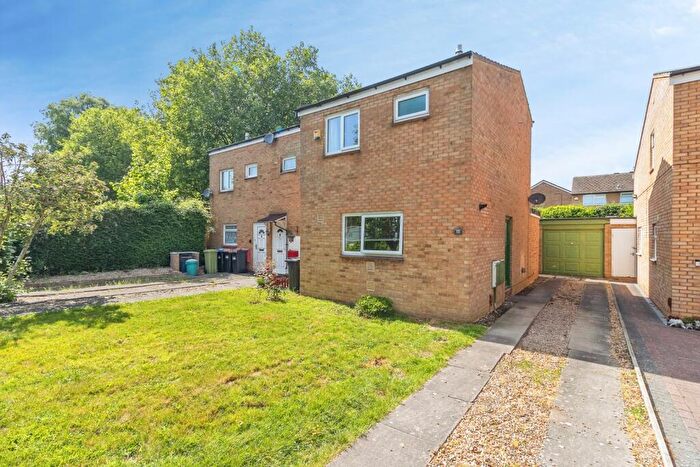
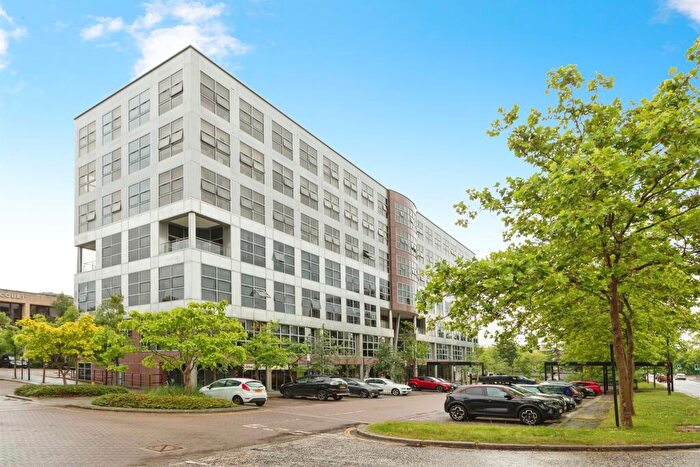
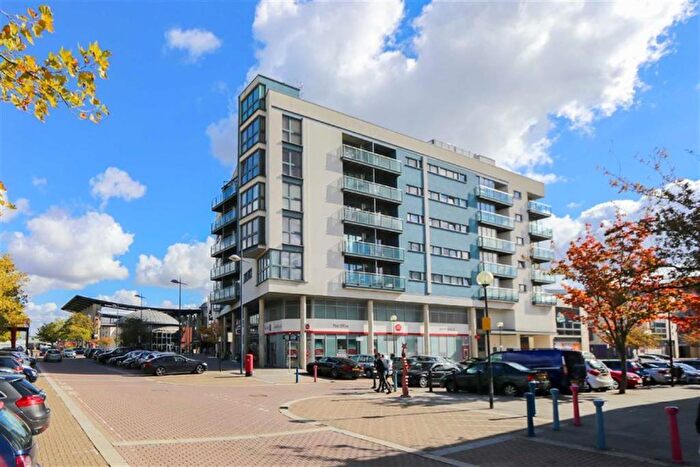
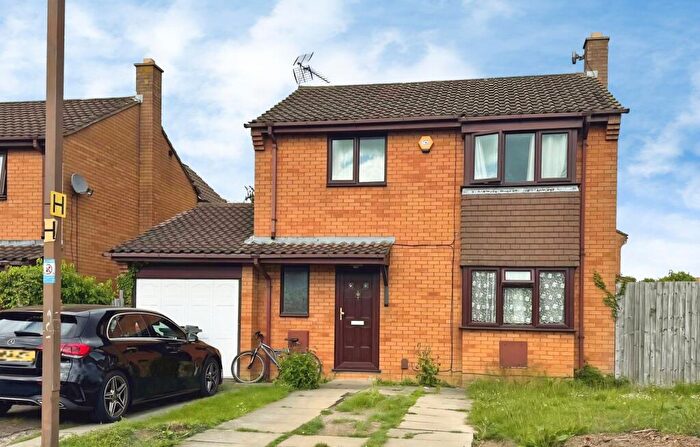
Properties for sale in Central Milton Keynes
![]()
If you are looking to sell your house, let it out, or receive a property valuation, an expert can help you.
Click the button below to get started.
Roads and Postcodes in Central Milton Keynes
Navigate through our locations to find the location of your next house in Central Milton Keynes, Milton Keynes for sale or to rent.
Transport near Central Milton Keynes
-
 Milton Keynes Central Station
 -
Wolverton Station
-
Bletchley Station
-
Fenny Stratford Station
-
Bow Brickhill Station
-
Woburn Sands Station
- FAQ
- Price Paid By Year
- Property Type Price
Frequently asked questions about Central Milton Keynes
What is the average price for a property for sale in Central Milton Keynes?
The average price for a property for sale in Central Milton Keynes is £263,462. This amount is 22% lower than the average price in Milton Keynes. There are 4,238 property listings for sale in Central Milton Keynes.
What streets have the most expensive properties for sale in Central Milton Keynes?
The streets with the most expensive properties for sale in Central Milton Keynes are Stokenchurch Place at an average of £506,125, Laker Court at an average of £500,000 and Walkhampton Avenue at an average of £499,000.
What streets have the most affordable properties for sale in Central Milton Keynes?
The streets with the most affordable properties for sale in Central Milton Keynes are Dorney Place at an average of £60,000, North Tenth Street at an average of £80,000 and North Third Street at an average of £117,000.
Which train stations are available in or near Central Milton Keynes?
Some of the train stations available in or near Central Milton Keynes are Milton Keynes Central, Wolverton and Bletchley.
Property Price Paid in Central Milton Keynes by Year
The average sold property price by year was:
| Year | Average Sold Price | Price Change |
Sold Properties
|
|---|---|---|---|
| 2026 | £266,750 | -3% |
14 Properties |
| 2025 | £274,745 | 6% |
113 Properties |
| 2024 | £258,466 | - |
150 Properties |
| 2023 | £258,491 | 4% |
115 Properties |
| 2022 | £249,111 | - |
180 Properties |
| 2021 | £249,228 | 4% |
211 Properties |
| 2020 | £239,732 | 9% |
140 Properties |
| 2019 | £217,121 | -5% |
249 Properties |
| 2018 | £227,113 | 3% |
206 Properties |
| 2017 | £221,018 | 5% |
265 Properties |
| 2016 | £208,899 | 10% |
284 Properties |
| 2015 | £187,681 | 13% |
242 Properties |
| 2014 | £163,777 | 5% |
267 Properties |
| 2013 | £154,926 | 3% |
184 Properties |
| 2012 | £150,401 | 4% |
147 Properties |
| 2011 | £144,886 | -9% |
125 Properties |
| 2010 | £157,220 | 12% |
177 Properties |
| 2009 | £137,654 | -10% |
325 Properties |
| 2008 | £151,363 | -9% |
473 Properties |
| 2007 | £164,738 | 10% |
702 Properties |
| 2006 | £148,323 | 6% |
396 Properties |
| 2005 | £139,933 | 1% |
290 Properties |
| 2004 | £138,437 | 8% |
369 Properties |
| 2003 | £126,960 | 15% |
402 Properties |
| 2002 | £107,833 | 21% |
490 Properties |
| 2001 | £85,588 | 17% |
482 Properties |
| 2000 | £70,926 | 12% |
393 Properties |
| 1999 | £62,185 | 3% |
455 Properties |
| 1998 | £60,509 | 6% |
456 Properties |
| 1997 | £56,920 | 7% |
435 Properties |
| 1996 | £53,105 | 12% |
443 Properties |
| 1995 | £46,951 | - |
273 Properties |
Property Price per Property Type in Central Milton Keynes
Here you can find historic sold price data in order to help with your property search.
The average Property Paid Price for specific property types in the last three years are:
| Property Type | Average Sold Price | Sold Properties |
|---|---|---|
| Semi Detached House | £282,000.00 | 73 Semi Detached Houses |
| Detached House | £410,796.00 | 59 Detached Houses |
| Terraced House | £267,523.00 | 140 Terraced Houses |
| Flat | £175,008.00 | 120 Flats |