
Houses for sale & to rent in Woughton And Fishermead, Milton Keynes
House Prices in Woughton And Fishermead
Properties in Woughton And Fishermead have an average house price of £226,303.00 and had 415 Property Transactions within the last 3 years¹.
Woughton And Fishermead is an area in Milton Keynes, Milton Keynes with 6,159 households², where the most expensive property was sold for £500,000.00.
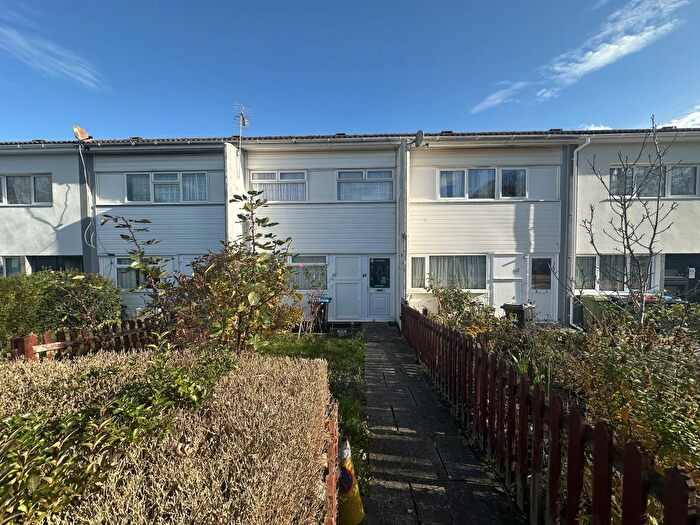
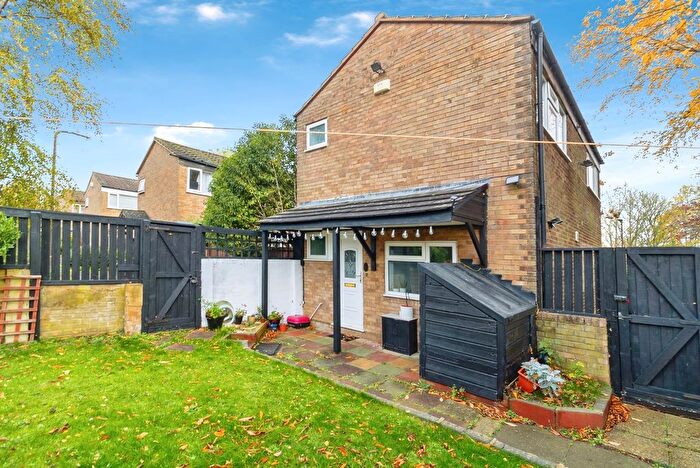
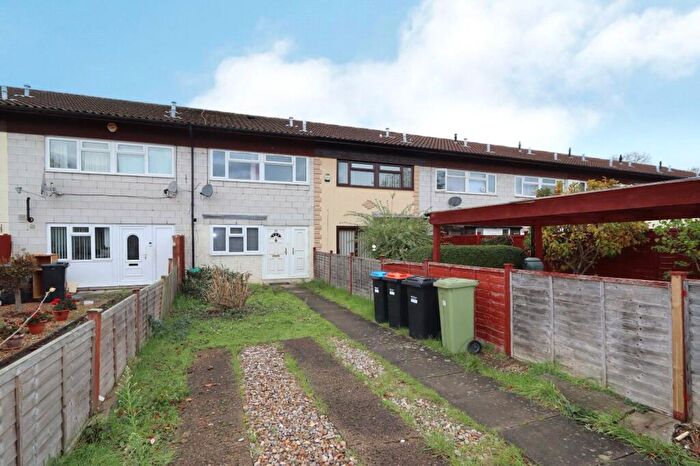
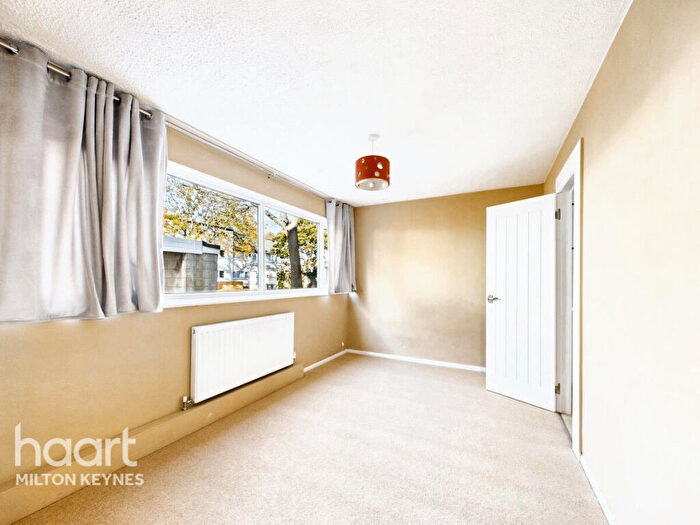
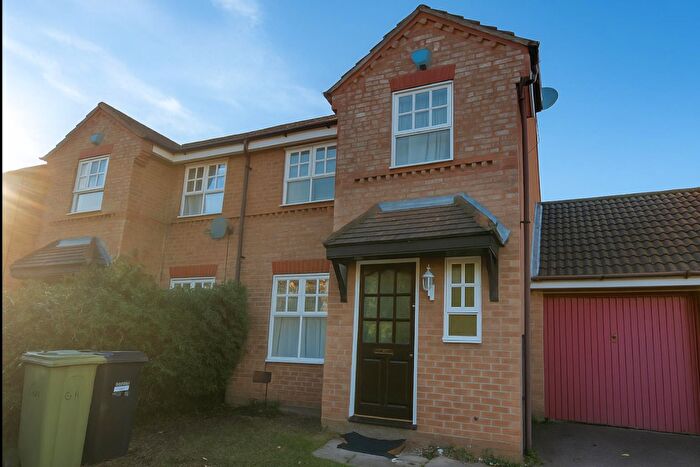
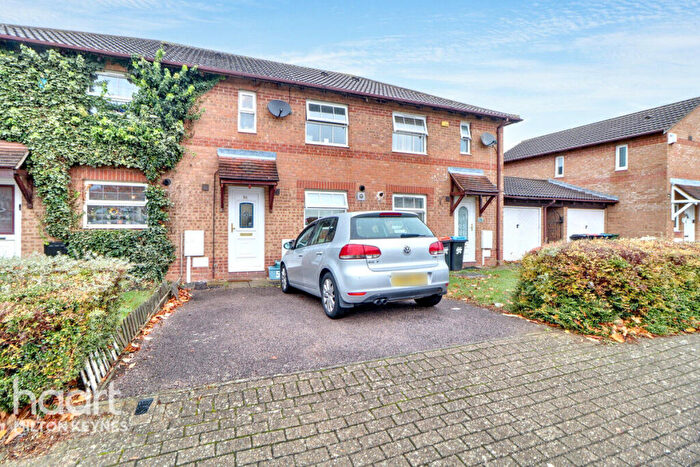
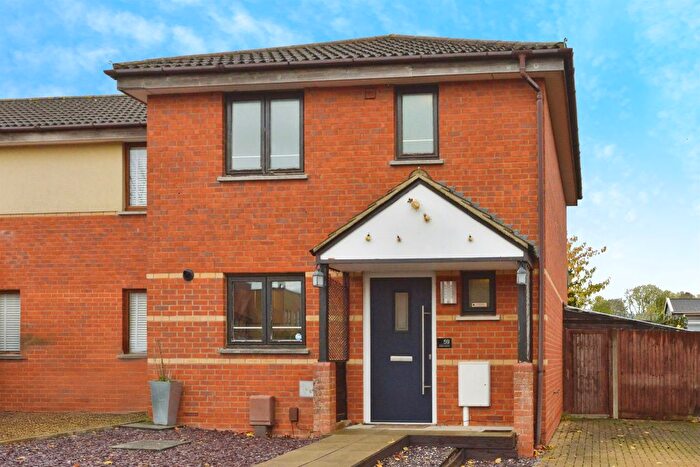
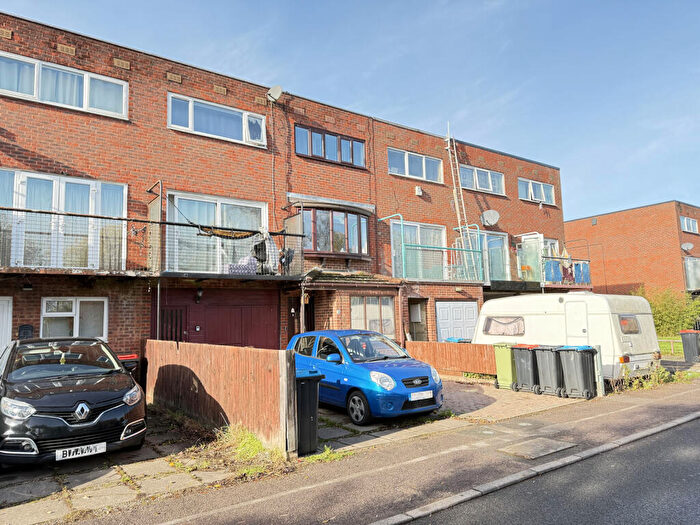
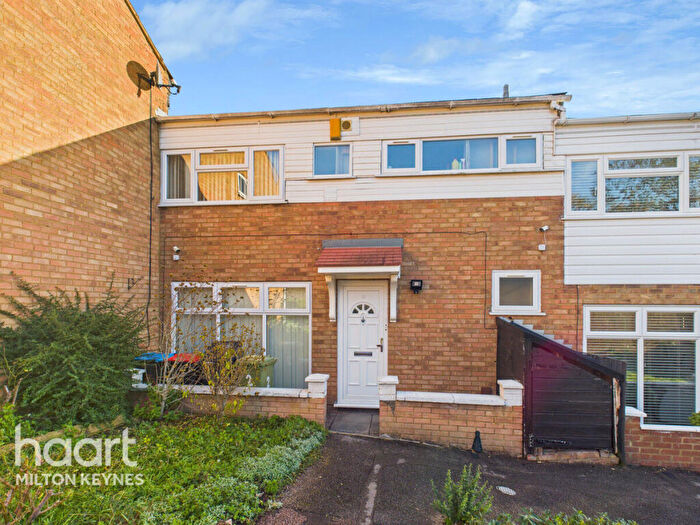
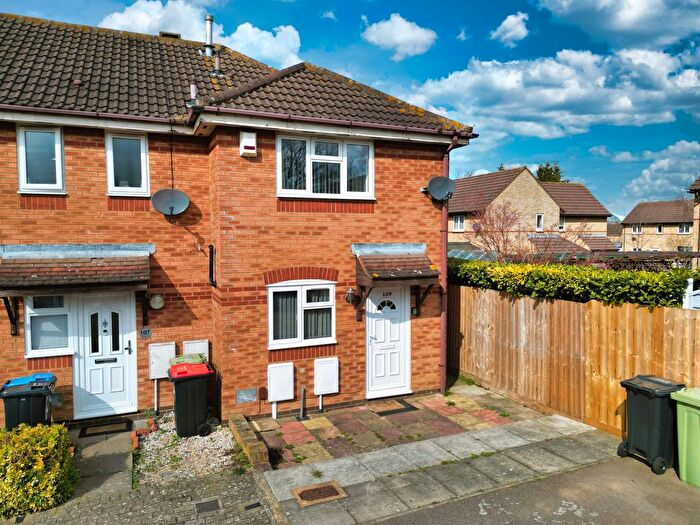
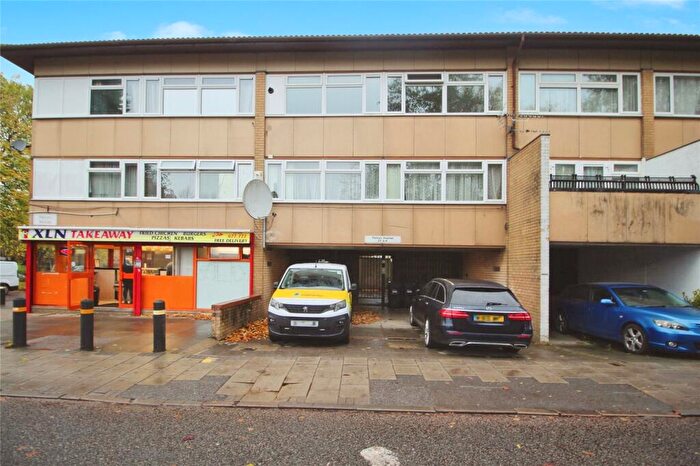
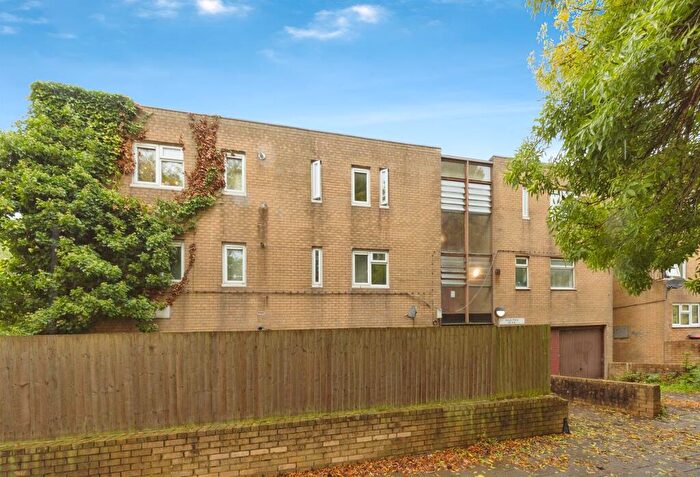
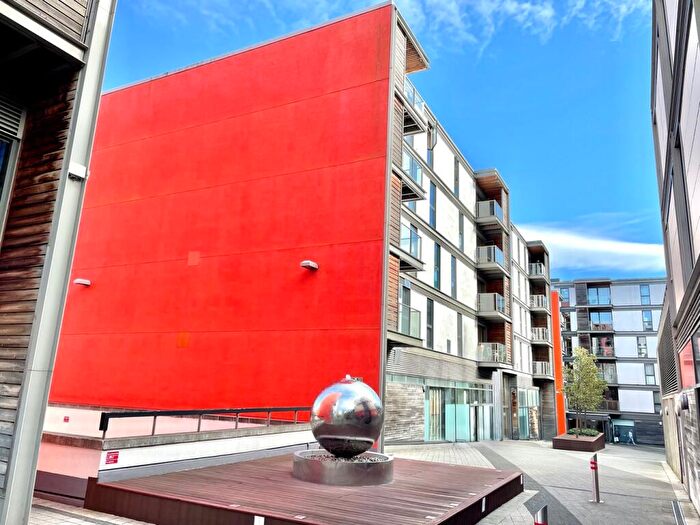
Properties for sale in Woughton And Fishermead
![]()
If you are looking to sell your house, let it out, or receive a property valuation, an expert can help you.
Click the button below to get started.
Roads and Postcodes in Woughton And Fishermead
Navigate through our locations to find the location of your next house in Woughton And Fishermead, Milton Keynes for sale or to rent.
Transport near Woughton And Fishermead

- FAQ
- Price Paid By Year
- Property Type Price
Frequently asked questions about Woughton And Fishermead
What is the average price for a property for sale in Woughton And Fishermead?
The average price for a property for sale in Woughton And Fishermead is £226,303. This amount is 33% lower than the average price in Milton Keynes. There are 3,424 property listings for sale in Woughton And Fishermead.
What streets have the most expensive properties for sale in Woughton And Fishermead?
The streets with the most expensive properties for sale in Woughton And Fishermead are Marshworth at an average of £368,875, Fryday Street at an average of £332,500 and Ashby at an average of £315,000.
What streets have the most affordable properties for sale in Woughton And Fishermead?
The streets with the most affordable properties for sale in Woughton And Fishermead are Devereux Place at an average of £84,000, Marine Court at an average of £84,666 and Broadwater at an average of £126,750.
Which train stations are available in or near Woughton And Fishermead?
Some of the train stations available in or near Woughton And Fishermead are Milton Keynes Central, Fenny Stratford and Bletchley.
Property Price Paid in Woughton And Fishermead by Year
The average sold property price by year was:
| Year | Average Sold Price | Price Change |
Sold Properties
|
|---|---|---|---|
| 2025 | £236,734 | 5% |
65 Properties |
| 2024 | £225,405 | -2% |
110 Properties |
| 2023 | £230,752 | 5% |
90 Properties |
| 2022 | £219,773 | 5% |
150 Properties |
| 2021 | £208,688 | 10% |
155 Properties |
| 2020 | £186,999 | 0,2% |
94 Properties |
| 2019 | £186,621 | 4% |
134 Properties |
| 2018 | £178,520 | 1% |
111 Properties |
| 2017 | £177,159 | 6% |
154 Properties |
| 2016 | £165,723 | 9% |
170 Properties |
| 2015 | £150,820 | 12% |
159 Properties |
| 2014 | £132,746 | 10% |
158 Properties |
| 2013 | £119,364 | 3% |
118 Properties |
| 2012 | £116,365 | 8% |
85 Properties |
| 2011 | £106,852 | -9% |
94 Properties |
| 2010 | £116,296 | 10% |
81 Properties |
| 2009 | £104,176 | -22% |
84 Properties |
| 2008 | £126,948 | -3% |
137 Properties |
| 2007 | £130,570 | 11% |
349 Properties |
| 2006 | £116,829 | -1% |
403 Properties |
| 2005 | £117,615 | 3% |
259 Properties |
| 2004 | £113,752 | 12% |
310 Properties |
| 2003 | £99,736 | 15% |
306 Properties |
| 2002 | £84,652 | 25% |
364 Properties |
| 2001 | £63,901 | 15% |
300 Properties |
| 2000 | £54,199 | 17% |
299 Properties |
| 1999 | £44,805 | 13% |
279 Properties |
| 1998 | £38,917 | 2% |
204 Properties |
| 1997 | £37,973 | 6% |
222 Properties |
| 1996 | £35,690 | 6% |
191 Properties |
| 1995 | £33,539 | - |
142 Properties |
Property Price per Property Type in Woughton And Fishermead
Here you can find historic sold price data in order to help with your property search.
The average Property Paid Price for specific property types in the last three years are:
| Property Type | Average Sold Price | Sold Properties |
|---|---|---|
| Flat | £141,070.00 | 86 Flats |
| Semi Detached House | £254,285.00 | 63 Semi Detached Houses |
| Detached House | £317,193.00 | 26 Detached Houses |
| Terraced House | £239,654.00 | 240 Terraced Houses |