
Houses for sale & to rent in Newport Pagnell South, Milton Keynes
House Prices in Newport Pagnell South
Properties in Newport Pagnell South have an average house price of £339,285.00 and had 122 Property Transactions within the last 3 years¹.
Newport Pagnell South is an area in Milton Keynes, Milton Keynes with 1,285 households², where the most expensive property was sold for £960,000.00.
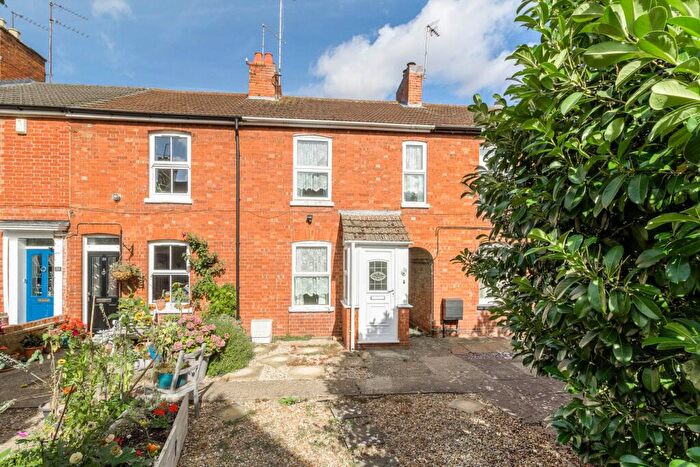
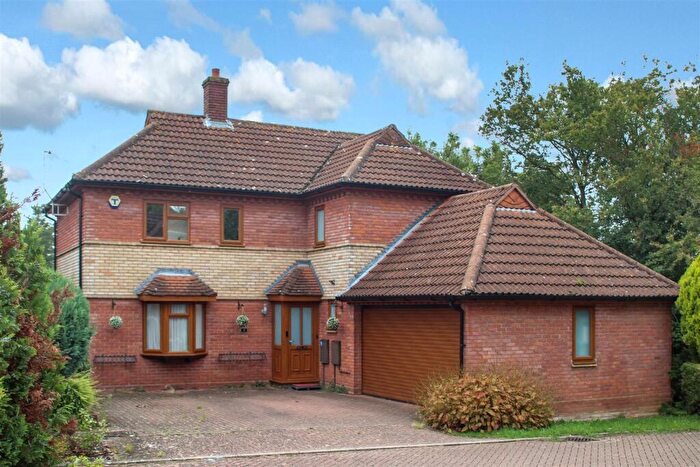
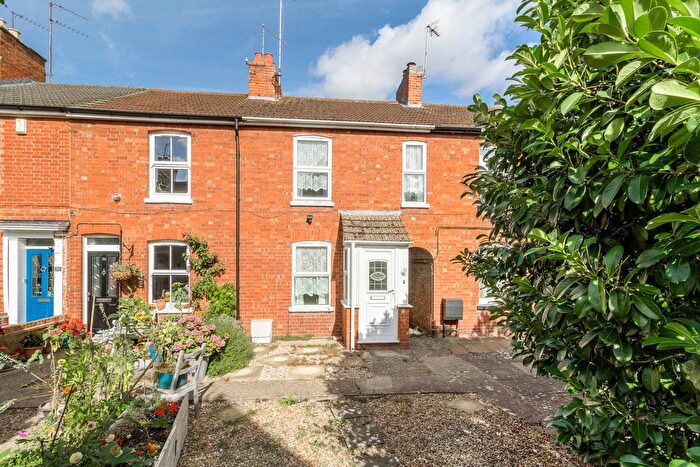
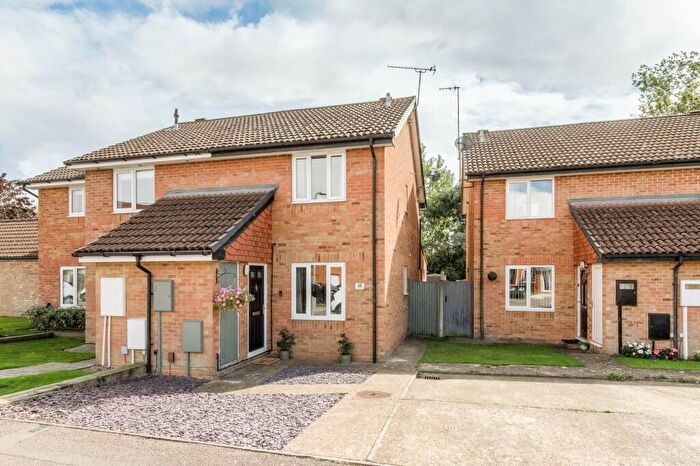
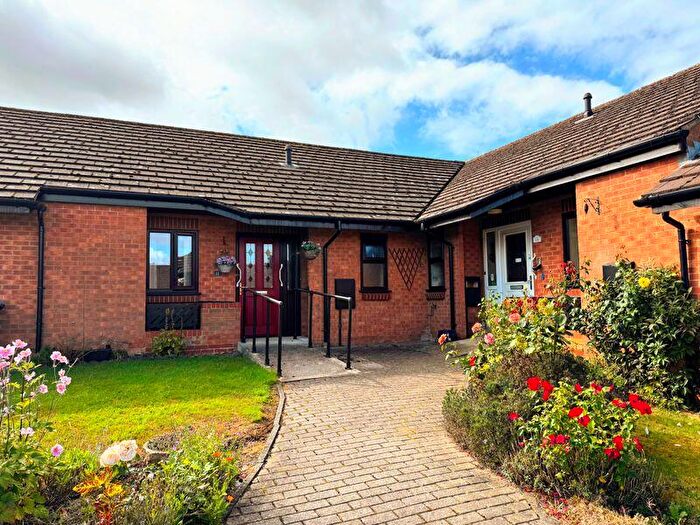
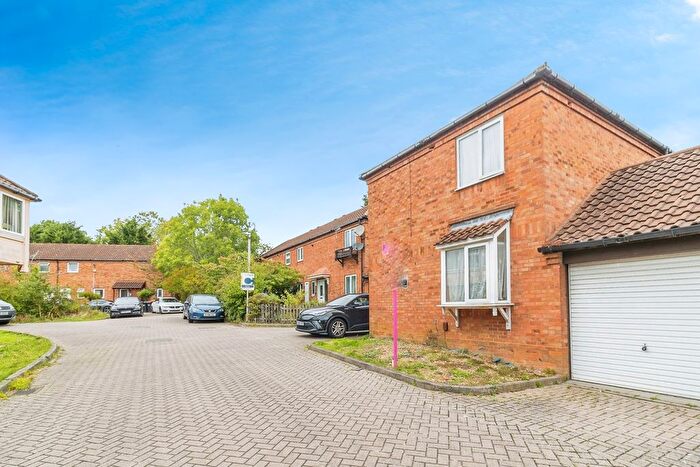
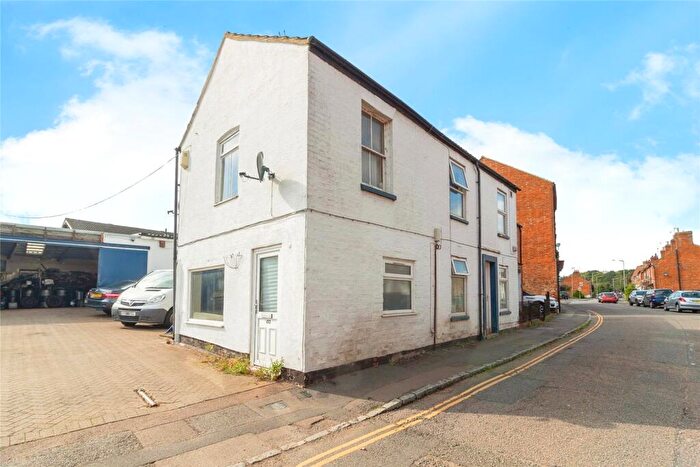
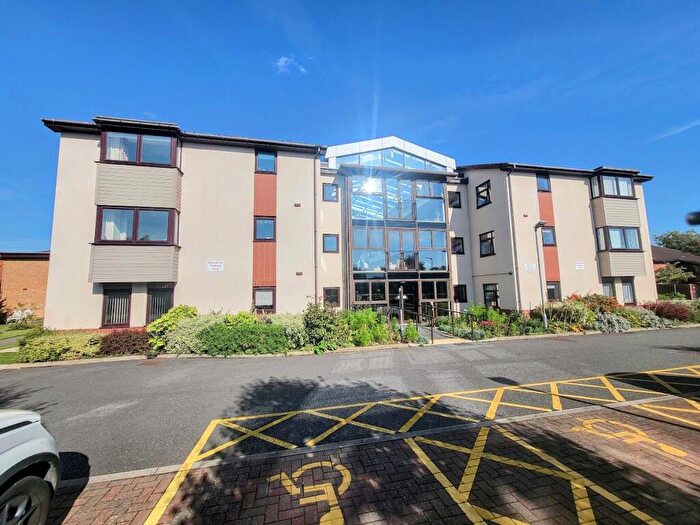
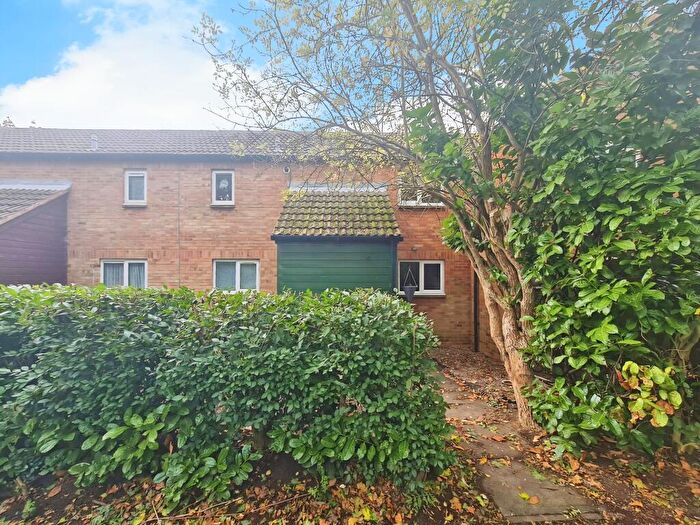
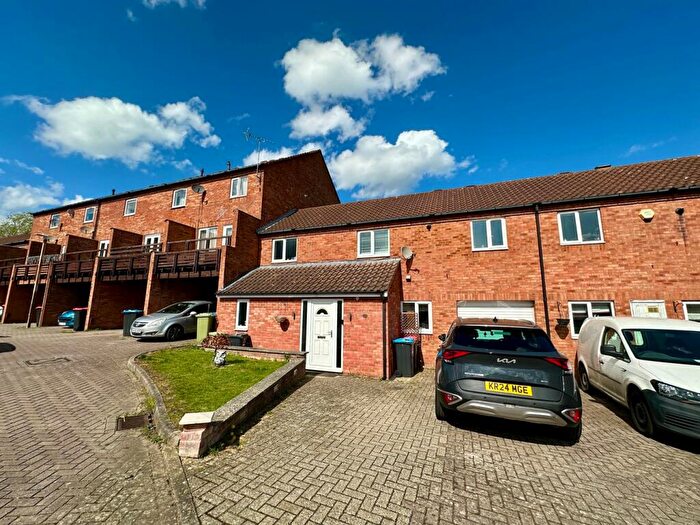
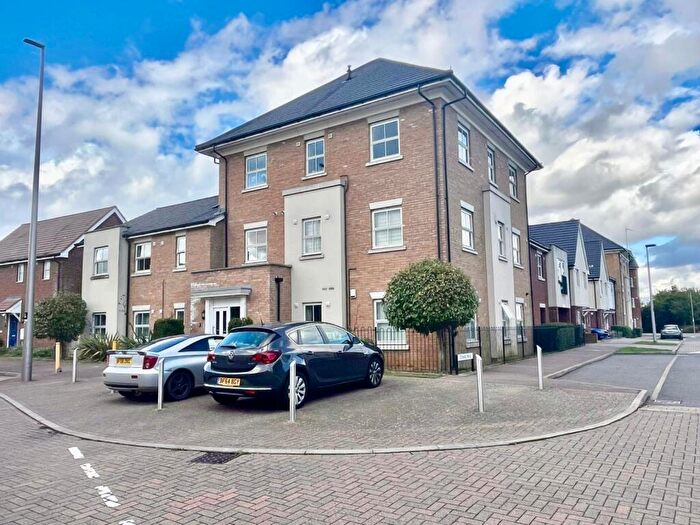
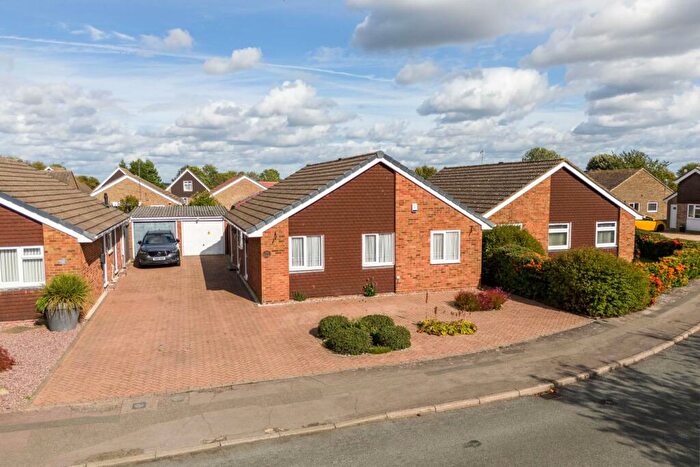
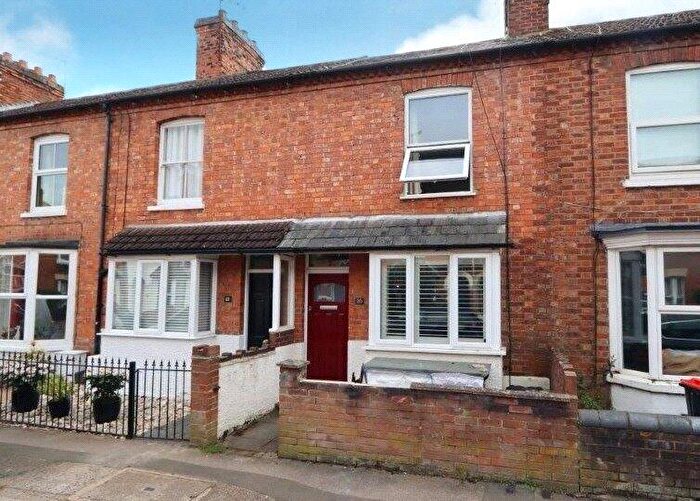
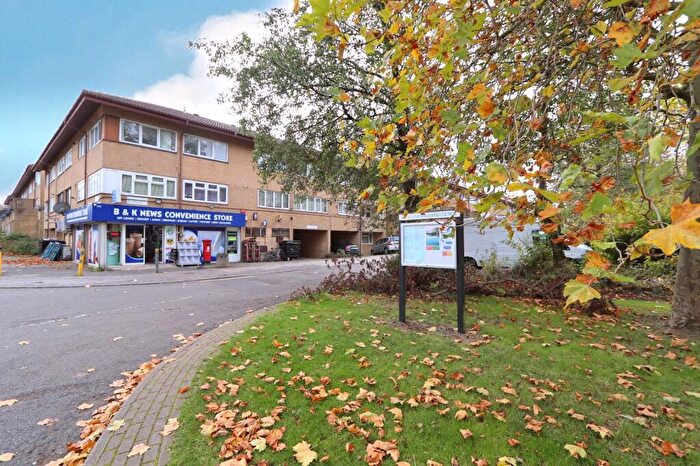
Properties for sale in Newport Pagnell South
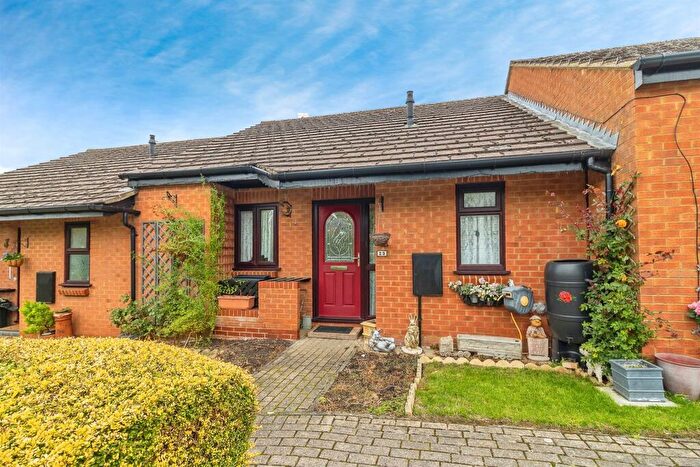

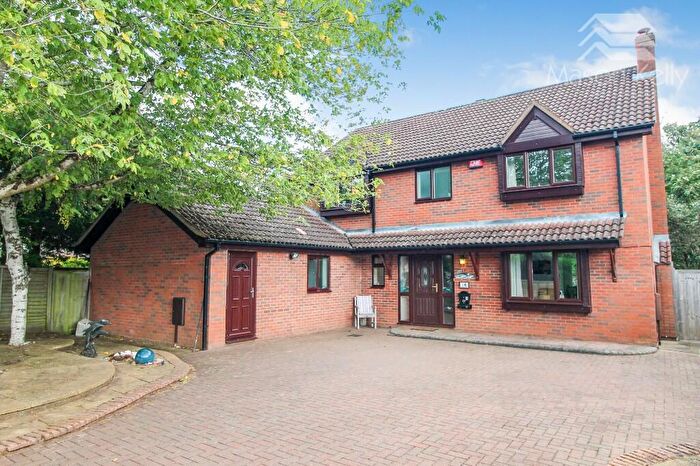
![]()
If you are looking to sell your house, let it out, or receive a property valuation, an expert can help you.
Click the button below to get started.


Roads and Postcodes in Newport Pagnell South
Navigate through our locations to find the location of your next house in Newport Pagnell South, Milton Keynes for sale or to rent.
| Streets | Postcodes |
|---|---|
| Ashdown Close | MK14 5PX |
| Barbury Court | MK14 5PT |
| Bekonscot Court | MK14 5QS |
| Bessemer Court | MK14 5JN MK14 5JW |
| Boulters Lock | MK14 5QR |
| Bringewood Forge | MK14 5FJ |
| Broadway Avenue | MK14 5JD MK14 5QB MK14 5QE MK14 5QF MK14 5QH MK14 5QJ MK14 5GJ MK14 5PY MK14 5QN |
| Bromham Mill | MK14 5QP |
| Broxbourne Close | MK14 5JP |
| Campion | MK14 5BH |
| Cedar Court | MK14 5GA |
| Cheslyn Gardens | MK14 5JU |
| Clayton Gate | MK14 5HN MK14 5HW |
| Delaware Drive | MK14 5SE MK15 8BA MK15 8HB MK15 8HG MK15 8JH MK15 8HD |
| Grafham Close | MK14 5JT |
| Hainault Avenue | MK14 5HT MK14 5HZ MK14 5JE MK14 5JF MK14 5PB MK14 5PE MK14 5PG MK14 5PH MK14 5PJ MK14 5PN MK14 5PQ MK14 5PR MK14 5PA MK14 5PW |
| Hargreaves Nook | MK14 5BS |
| Harlestone Court | MK14 5PD |
| Harvard Close | MK14 5PZ |
| Hodgemore Court | MK14 5JR |
| Horton Gate | MK14 5JG MK14 5JQ |
| Huntsman Grove | MK14 5HS |
| Kimbolton Court | MK14 5PS |
| Local Centre | MK14 5QD |
| Maryland Road | MK15 8HF MK15 8HJ MK15 8HN |
| Maulden Gardens | MK14 5JJ |
| Metcalfe Grove | MK14 5JY |
| Michigan Drive | MK15 8BF MK15 8HQ MK15 8HT |
| Midbrook Court | MK14 5FH |
| Miles Close | MK14 5AD |
| Minton Close | MK14 5JB |
| Monks Way | MK14 5JA MK15 8HR |
| Oversley Court | MK14 5PF |
| Rainsborough | MK14 5PL |
| Rothersthorpe | MK14 5JL |
| Rowsham Dell | MK14 5JS |
| Runnymede | MK14 5QL |
| Salisbury Grove | MK14 5QA |
| Shelsmore | MK14 5HU |
| Smeaton Close | MK14 5HQ MK14 5HR |
| Snowshill Court | MK14 5QG |
| Station Terrace | MK14 5AP |
| Tanners Drive | MK14 5BN MK14 5BP MK14 5BU MK14 5BW |
| Telford Way | MK14 5LB |
| The Crescent | MK14 5AR |
| Vermont Place | MK15 8JA MK15 8JD |
| Wandlebury | MK14 5PP |
| Wedgwood Avenue | MK14 5HX MK14 5HY MK14 5JZ |
| Whichford | MK14 5JH |
| Willow Wren | MK14 5AQ |
| Wolverton Road | MK14 5AB MK14 5AE MK14 5AF |
| Yeomans Drive | MK14 5AN MK14 5BT MK14 5LR MK14 5LS MK14 5LZ MK14 5NQ |
| MK14 5AS MK46 5WB |
Transport near Newport Pagnell South
-
 Wolverton Station
 -
Milton Keynes Central Station
-
Bow Brickhill Station
-
Fenny Stratford Station
-
Woburn Sands Station
-
Bletchley Station
-
Aspley Guise Station
-
Ridgmont Station
-
Lidlington Station
-
Millbrook (Bedfordshire) Station
- FAQ
- Price Paid By Year
- Property Type Price
Frequently asked questions about Newport Pagnell South
What is the average price for a property for sale in Newport Pagnell South?
The average price for a property for sale in Newport Pagnell South is £339,285. This amount is 0.39% higher than the average price in Milton Keynes. There are 3,585 property listings for sale in Newport Pagnell South.
What streets have the most expensive properties for sale in Newport Pagnell South?
The streets with the most expensive properties for sale in Newport Pagnell South are Rowsham Dell at an average of £819,666, Wolverton Road at an average of £563,166 and Bromham Mill at an average of £555,000.
What streets have the most affordable properties for sale in Newport Pagnell South?
The streets with the most affordable properties for sale in Newport Pagnell South are Bekonscot Court at an average of £184,583, Barbury Court at an average of £190,000 and Rainsborough at an average of £202,500.
Which train stations are available in or near Newport Pagnell South?
Some of the train stations available in or near Newport Pagnell South are Wolverton, Milton Keynes Central and Bow Brickhill.
Property Price Paid in Newport Pagnell South by Year
The average sold property price by year was:
| Year | Average Sold Price | Price Change |
Sold Properties
|
|---|---|---|---|
| 2025 | £404,538 | 12% |
13 Properties |
| 2024 | £355,550 | 13% |
30 Properties |
| 2023 | £308,346 | -8% |
34 Properties |
| 2022 | £332,966 | 5% |
45 Properties |
| 2021 | £315,111 | -6% |
66 Properties |
| 2020 | £335,311 | 19% |
50 Properties |
| 2019 | £271,724 | -12% |
45 Properties |
| 2018 | £304,814 | 12% |
54 Properties |
| 2017 | £267,184 | 9% |
57 Properties |
| 2016 | £243,644 | -3% |
65 Properties |
| 2015 | £251,183 | 20% |
64 Properties |
| 2014 | £201,841 | -17% |
53 Properties |
| 2013 | £235,167 | 23% |
61 Properties |
| 2012 | £181,823 | -20% |
51 Properties |
| 2011 | £218,678 | 11% |
41 Properties |
| 2010 | £193,868 | -0,1% |
60 Properties |
| 2009 | £194,104 | 6% |
47 Properties |
| 2008 | £182,503 | -1% |
39 Properties |
| 2007 | £184,601 | -1% |
83 Properties |
| 2006 | £185,931 | 12% |
118 Properties |
| 2005 | £164,291 | 1% |
60 Properties |
| 2004 | £163,246 | 22% |
113 Properties |
| 2003 | £127,045 | 11% |
93 Properties |
| 2002 | £113,045 | 12% |
118 Properties |
| 2001 | £99,222 | -2% |
102 Properties |
| 2000 | £100,857 | 21% |
67 Properties |
| 1999 | £79,513 | 17% |
110 Properties |
| 1998 | £66,199 | -1% |
98 Properties |
| 1997 | £67,055 | 9% |
103 Properties |
| 1996 | £60,943 | 4% |
82 Properties |
| 1995 | £58,310 | - |
90 Properties |
Property Price per Property Type in Newport Pagnell South
Here you can find historic sold price data in order to help with your property search.
The average Property Paid Price for specific property types in the last three years are:
| Property Type | Average Sold Price | Sold Properties |
|---|---|---|
| Semi Detached House | £263,547.00 | 42 Semi Detached Houses |
| Detached House | £485,016.00 | 48 Detached Houses |
| Terraced House | £246,708.00 | 24 Terraced Houses |
| Flat | £140,250.00 | 8 Flats |