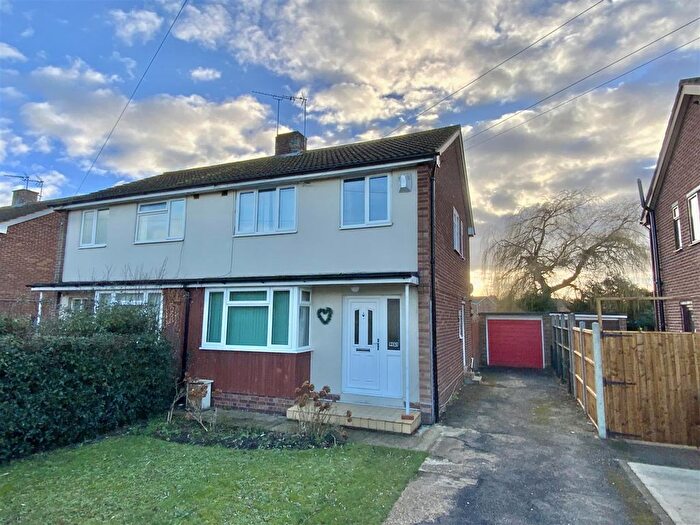
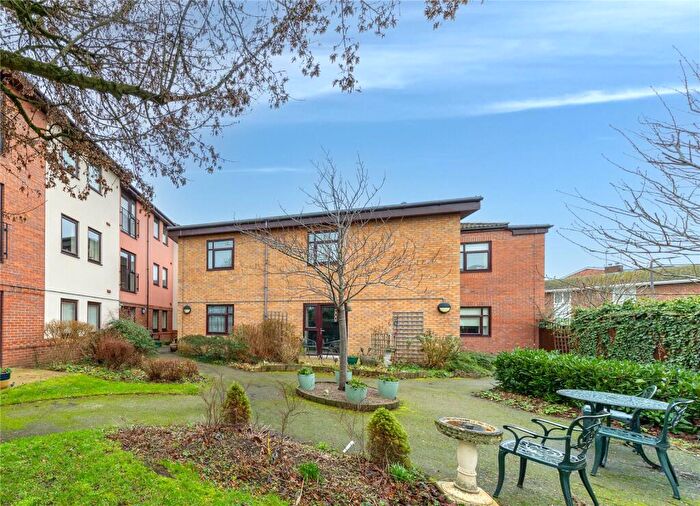
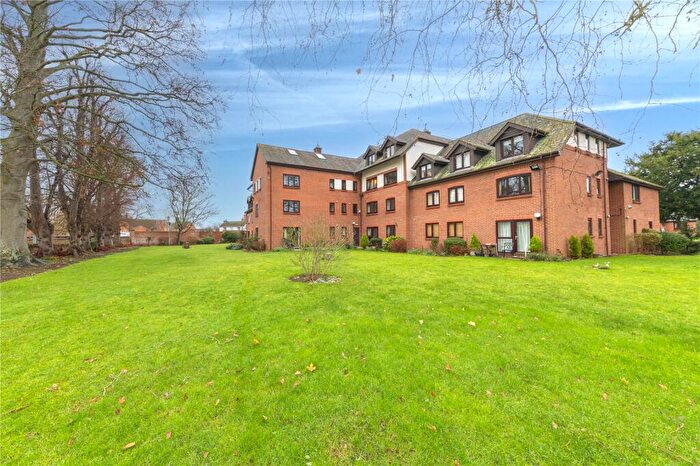
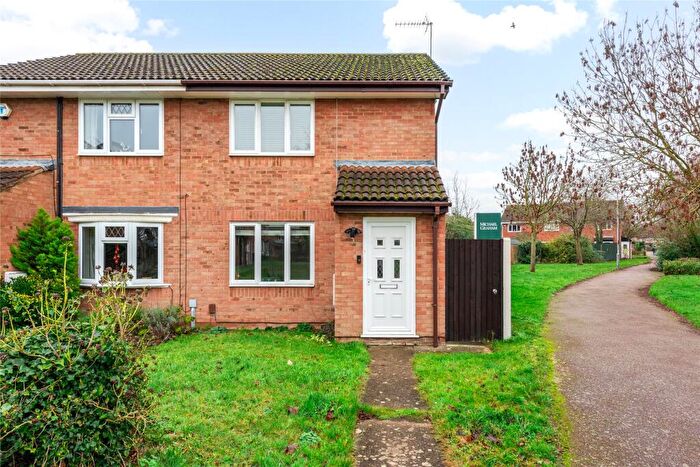
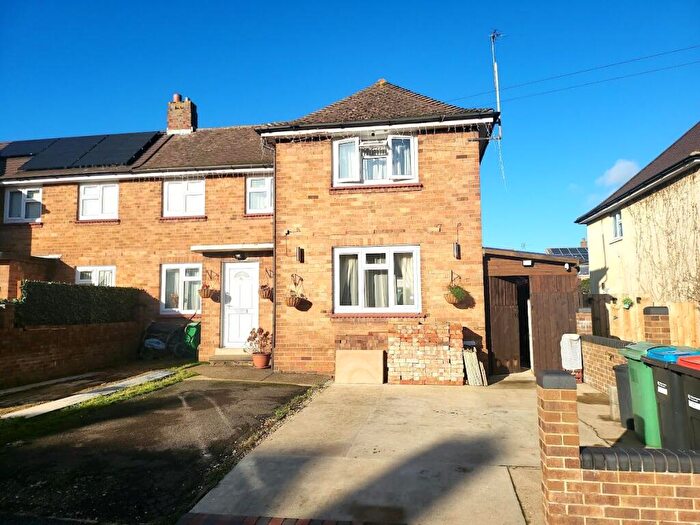
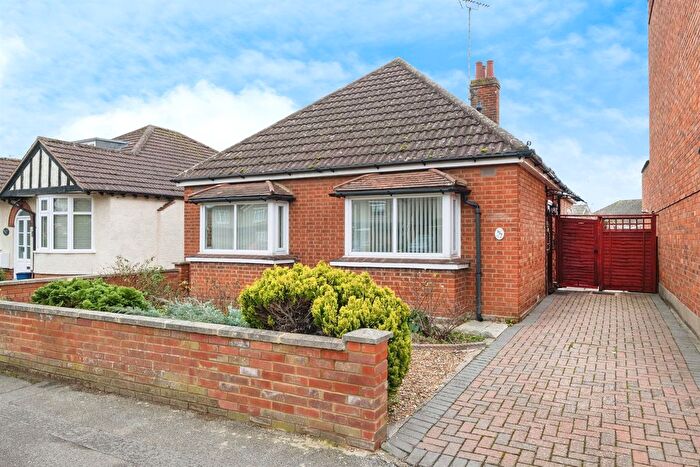
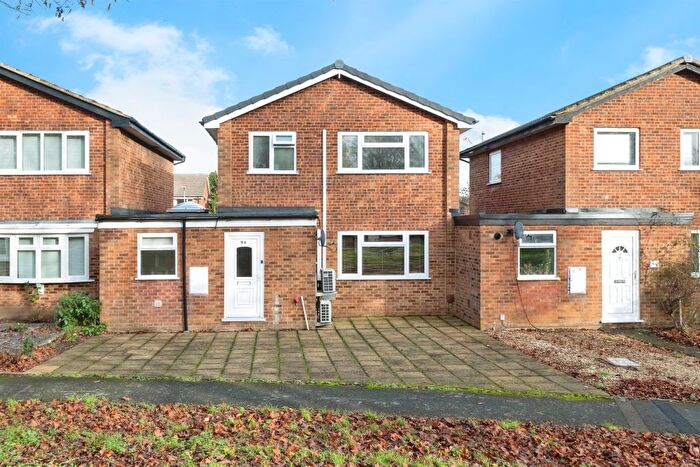
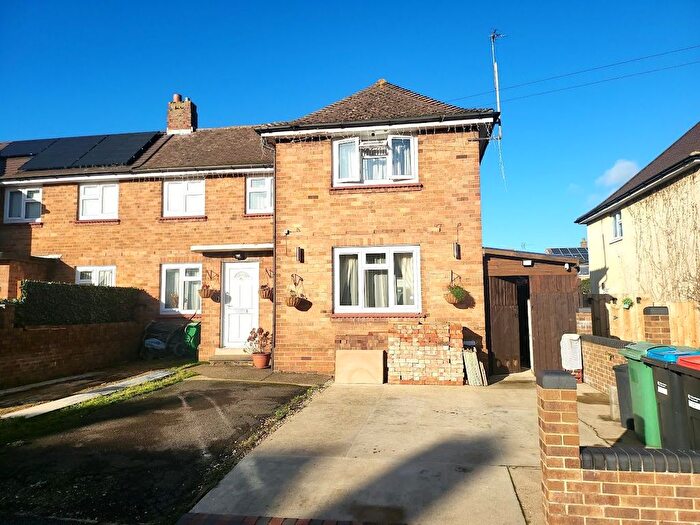
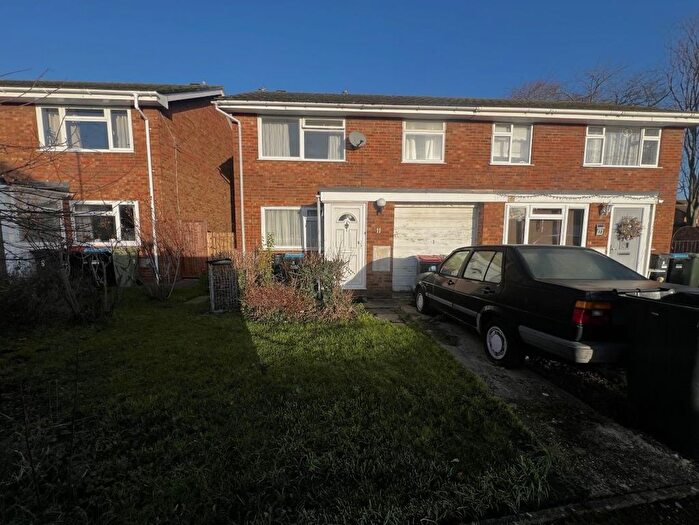
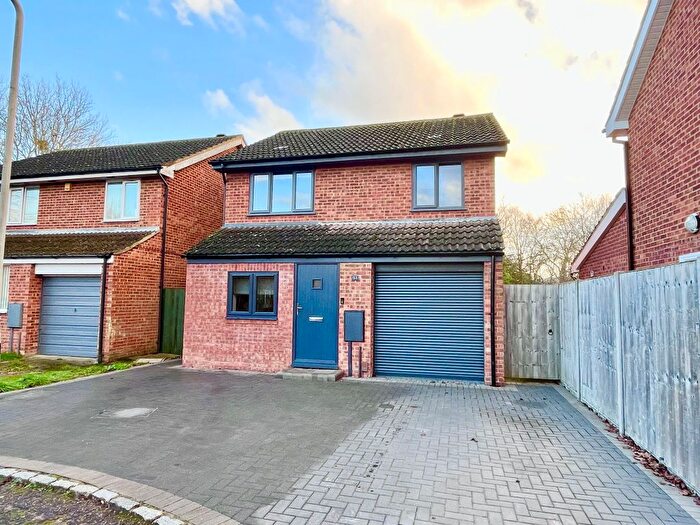
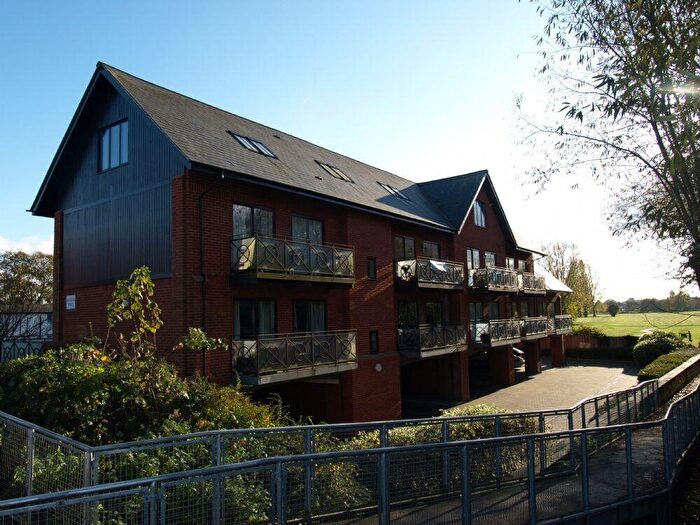
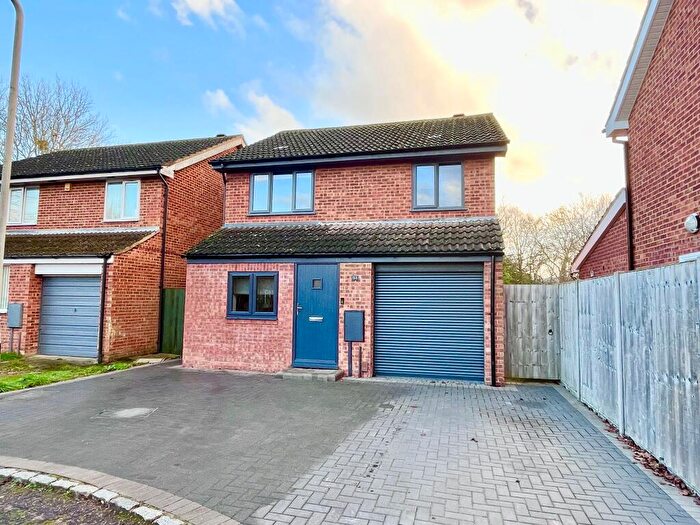
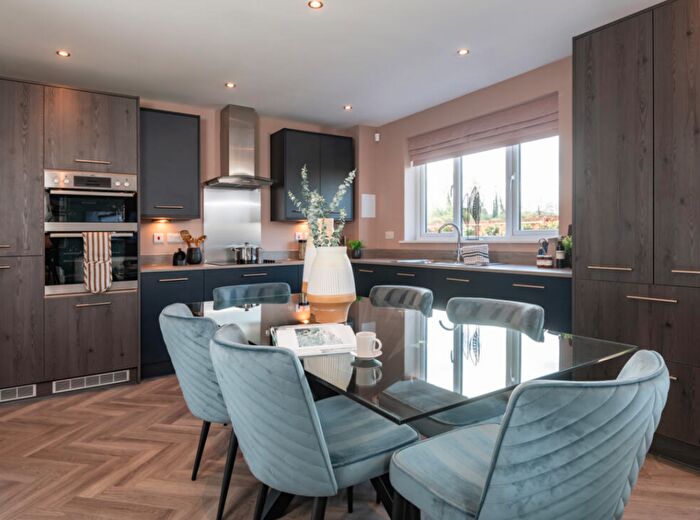
Houses for sale & to rent in Newport Pagnell South, Newport Pagnell
House Prices in Newport Pagnell South
Properties in Newport Pagnell South have an average house price of £345,583.00 and had 540 Property Transactions within the last 3 years¹.
Newport Pagnell South is an area in Newport Pagnell, Milton Keynes with 3,623 households², where the most expensive property was sold for £3,500,000.00.
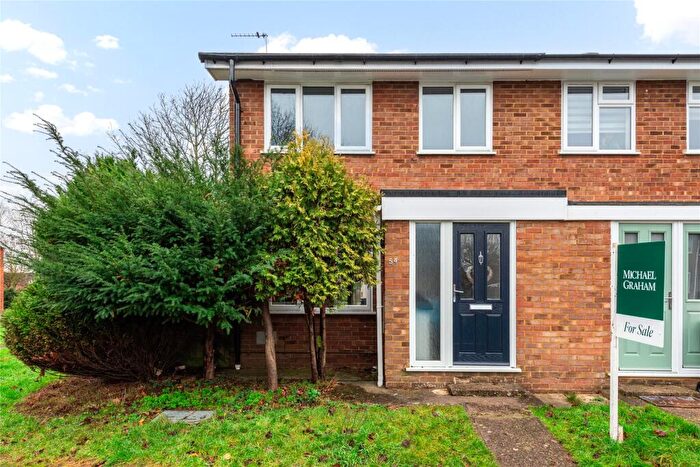
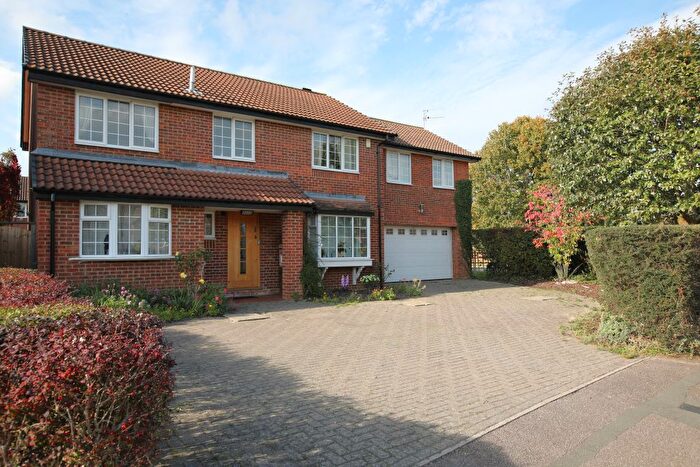
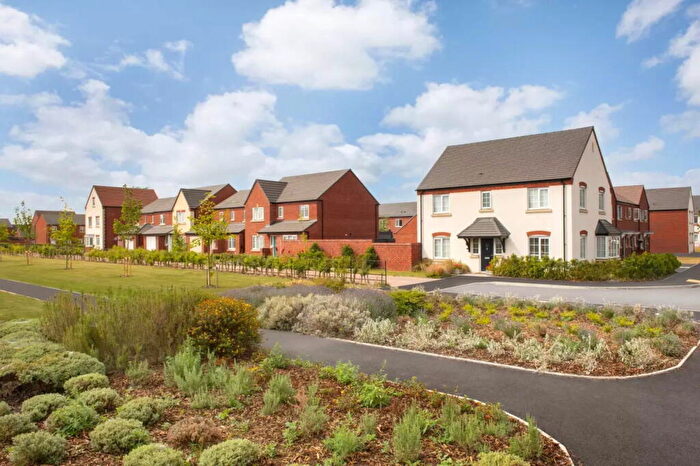
Properties for sale in Newport Pagnell South
Roads and Postcodes in Newport Pagnell South
Navigate through our locations to find the location of your next house in Newport Pagnell South, Newport Pagnell for sale or to rent.
Transport near Newport Pagnell South
-
Wolverton Station
-
Milton Keynes Central Station
-
Woburn Sands Station
-
Bow Brickhill Station
-
Fenny Stratford Station
-
Aspley Guise Station
-
Bletchley Station
-
Ridgmont Station
-
Lidlington Station
-
Millbrook (Bedfordshire) Station
- FAQ
- Price Paid By Year
- Property Type Price
Frequently asked questions about Newport Pagnell South
What is the average price for a property for sale in Newport Pagnell South?
The average price for a property for sale in Newport Pagnell South is £345,583. This amount is 8% lower than the average price in Newport Pagnell. There are 1,241 property listings for sale in Newport Pagnell South.
What streets have the most expensive properties for sale in Newport Pagnell South?
The streets with the most expensive properties for sale in Newport Pagnell South are London Road at an average of £874,227, Station Road at an average of £730,000 and Bramley Meadows at an average of £672,750.
What streets have the most affordable properties for sale in Newport Pagnell South?
The streets with the most affordable properties for sale in Newport Pagnell South are North Crawley Road at an average of £76,875, Ruskin Court at an average of £145,583 and Lovat Meadow Close at an average of £150,000.
Which train stations are available in or near Newport Pagnell South?
Some of the train stations available in or near Newport Pagnell South are Wolverton, Milton Keynes Central and Woburn Sands.
Property Price Paid in Newport Pagnell South by Year
The average sold property price by year was:
| Year | Average Sold Price | Price Change |
Sold Properties
|
|---|---|---|---|
| 2025 | £354,309 | -6% |
96 Properties |
| 2024 | £374,977 | 14% |
142 Properties |
| 2023 | £321,380 | -5% |
152 Properties |
| 2022 | £336,700 | 8% |
150 Properties |
| 2021 | £309,709 | 9% |
204 Properties |
| 2020 | £281,948 | -1% |
111 Properties |
| 2019 | £285,135 | -8% |
154 Properties |
| 2018 | £308,753 | 10% |
219 Properties |
| 2017 | £276,432 | 4% |
184 Properties |
| 2016 | £265,945 | 11% |
155 Properties |
| 2015 | £236,817 | 10% |
180 Properties |
| 2014 | £212,137 | 11% |
167 Properties |
| 2013 | £188,546 | 3% |
169 Properties |
| 2012 | £183,246 | 1% |
138 Properties |
| 2011 | £180,722 | -4% |
147 Properties |
| 2010 | £188,450 | 7% |
165 Properties |
| 2009 | £174,994 | -9% |
116 Properties |
| 2008 | £189,967 | -3% |
128 Properties |
| 2007 | £195,545 | 9% |
233 Properties |
| 2006 | £178,631 | 1% |
267 Properties |
| 2005 | £176,929 | 0,3% |
215 Properties |
| 2004 | £176,311 | 10% |
248 Properties |
| 2003 | £158,768 | 24% |
240 Properties |
| 2002 | £121,377 | 12% |
244 Properties |
| 2001 | £106,860 | 11% |
221 Properties |
| 2000 | £95,628 | 18% |
218 Properties |
| 1999 | £78,588 | 12% |
249 Properties |
| 1998 | £68,969 | 3% |
311 Properties |
| 1997 | £66,961 | 16% |
325 Properties |
| 1996 | £56,020 | 4% |
203 Properties |
| 1995 | £53,902 | - |
142 Properties |
Property Price per Property Type in Newport Pagnell South
Here you can find historic sold price data in order to help with your property search.
The average Property Paid Price for specific property types in the last three years are:
| Property Type | Average Sold Price | Sold Properties |
|---|---|---|
| Flat | £173,415.00 | 53 Flats |
| Semi Detached House | £360,759.00 | 183 Semi Detached Houses |
| Detached House | £540,894.00 | 90 Detached Houses |
| Terraced House | £293,106.00 | 214 Terraced Houses |

