
Houses for sale & to rent in Monument, Newcastle Upon Tyne
House Prices in Monument
Properties in Monument have an average house price of £163k and had 21 Property Transactions within the last 3 years¹.
Monument is an area in Newcastle Upon Tyne, Newcastle upon Tyne with 751 households², where the most expensive property was sold for £380k.
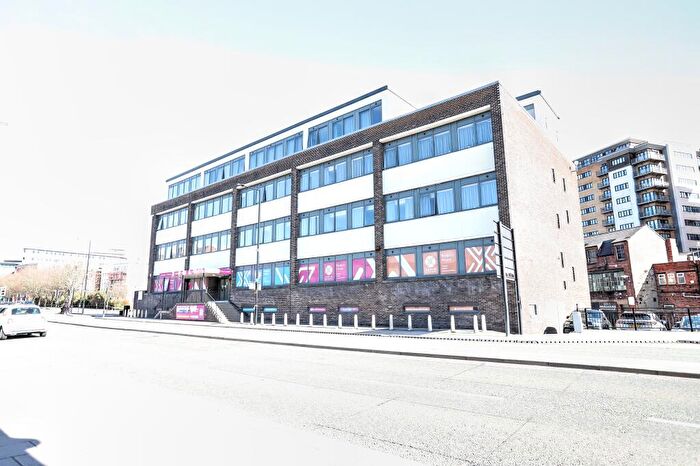
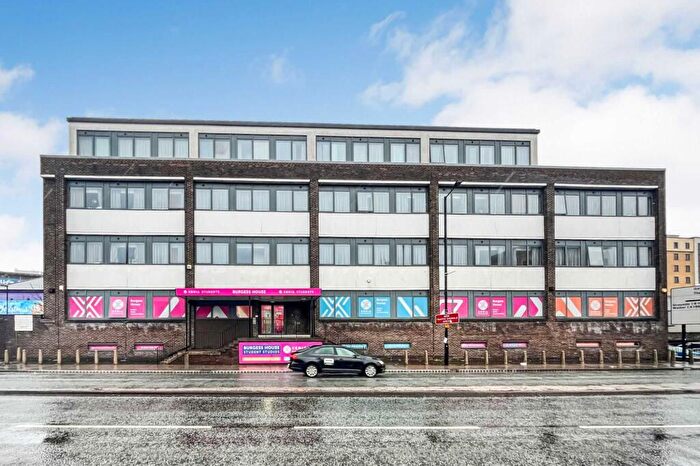
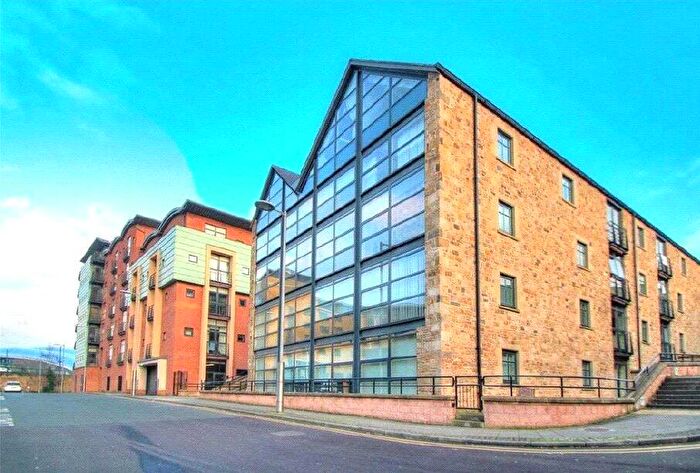
Properties for sale in Monument
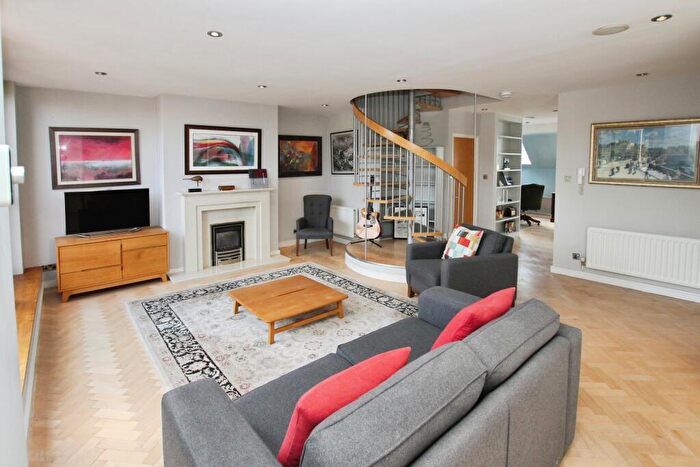
![]()
If you are looking to sell your house, let it out, or receive a property valuation, an expert can help you.
Click the button below to get started.

Roads and Postcodes in Monument
Navigate through our locations to find the location of your next house in Monument, Newcastle Upon Tyne for sale or to rent.
Transport near Monument

- FAQ
- Price Paid By Year
- Property Type Price
Frequently asked questions about Monument
What is the average price for a property for sale in Monument?
The average price for a property for sale in Monument is £163,201. This amount is 31% lower than the average price in Newcastle Upon Tyne. There are 1,230 property listings for sale in Monument.
What streets have the most expensive properties for sale in Monument?
The streets with the most expensive properties for sale in Monument are Great North Road at an average of £380,000, Westmorland Road at an average of £300,000 and Clayton Street at an average of £272,500.
What streets have the most affordable properties for sale in Monument?
The streets with the most affordable properties for sale in Monument are St James Boulevard at an average of £41,012, Westgate Road at an average of £103,585 and Dobson Close at an average of £124,500.
Which train stations are available in or near Monument?
Some of the train stations available in or near Monument are Newcastle, Manors and Dunston.
Property Price Paid in Monument by Year
The average sold property price by year was:
| Year | Average Sold Price | Price Change |
Sold Properties
|
|---|---|---|---|
| 2026 | £380,000 | 64% |
1 Property |
| 2025 | £135,000 | -30% |
7 Properties |
| 2024 | £175,727 | 15% |
6 Properties |
| 2023 | £149,694 | -17% |
7 Properties |
| 2022 | £175,785 | -221% |
7 Properties |
| 2021 | £564,001 | 81% |
7 Properties |
| 2020 | £106,666 | -19% |
3 Properties |
| 2019 | £126,506 | 3% |
22 Properties |
| 2018 | £123,242 | -33% |
17 Properties |
| 2017 | £163,649 | 27% |
25 Properties |
| 2016 | £119,170 | 26% |
34 Properties |
| 2015 | £88,267 | 30% |
55 Properties |
| 2014 | £62,097 | -296% |
49 Properties |
| 2011 | £246,000 | 19% |
1 Property |
| 2010 | £200,000 | -46% |
1 Property |
| 2009 | £291,666 | 83% |
3 Properties |
| 2008 | £50,000 | -90% |
1 Property |
| 2006 | £95,000 | -111% |
2 Properties |
| 2005 | £200,000 | -67% |
4 Properties |
| 2004 | £334,250 | 1% |
2 Properties |
| 2003 | £331,436 | 32% |
6 Properties |
| 2002 | £224,900 | 45% |
5 Properties |
| 2001 | £124,666 | 20% |
3 Properties |
| 2000 | £100,000 | -237% |
2 Properties |
| 1999 | £336,666 | 6% |
3 Properties |
| 1998 | £317,000 | 91% |
8 Properties |
| 1997 | £28,000 | -471% |
2 Properties |
| 1995 | £160,000 | - |
1 Property |
Property Price per Property Type in Monument
Here you can find historic sold price data in order to help with your property search.
The average Property Paid Price for specific property types in the last three years are:
| Property Type | Average Sold Price | Sold Properties |
|---|---|---|
| Semi Detached House | £245,000.00 | 1 Semi Detached House |
| Terraced House | £219,750.00 | 4 Terraced Houses |
| Detached House | £300,000.00 | 1 Detached House |
| Flat | £133,548.00 | 15 Flats |