
Houses for sale & to rent in Newcastle Upon Tyne, Newcastle upon Tyne
House Prices in Newcastle Upon Tyne
Properties in Newcastle Upon Tyne have an average house price of £237k and had 10,448 Property Transactions within the last 3 years.¹
Newcastle Upon Tyne is an area in Newcastle upon Tyne with 116,561 households², where the most expensive property was sold for £134.5M.
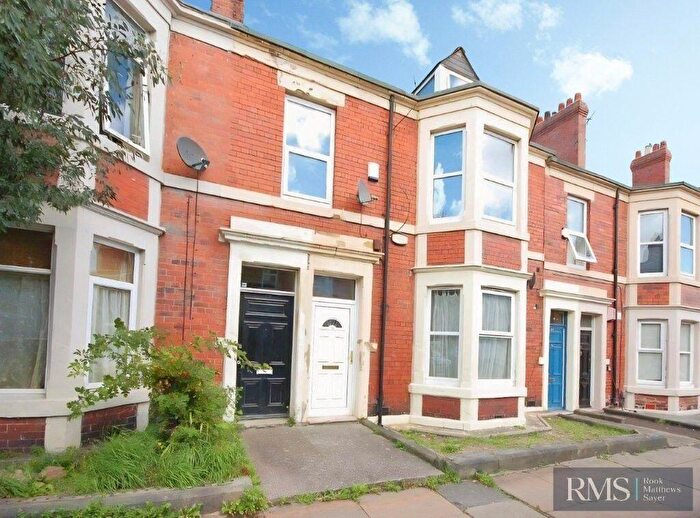
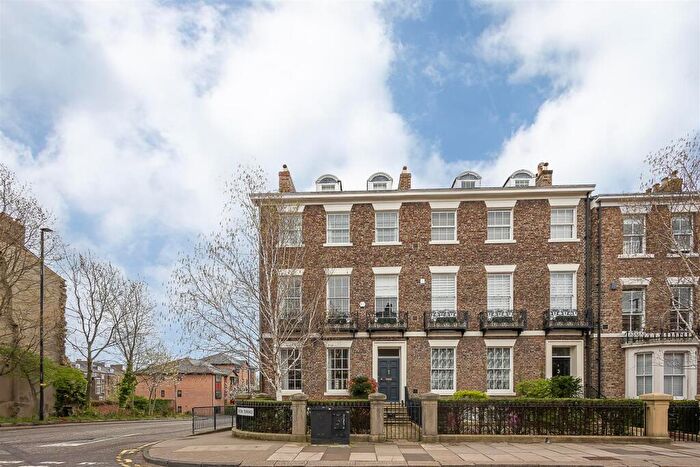
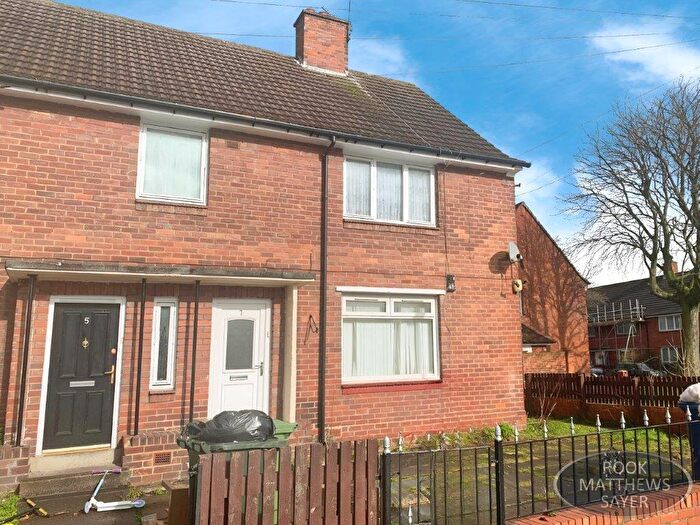
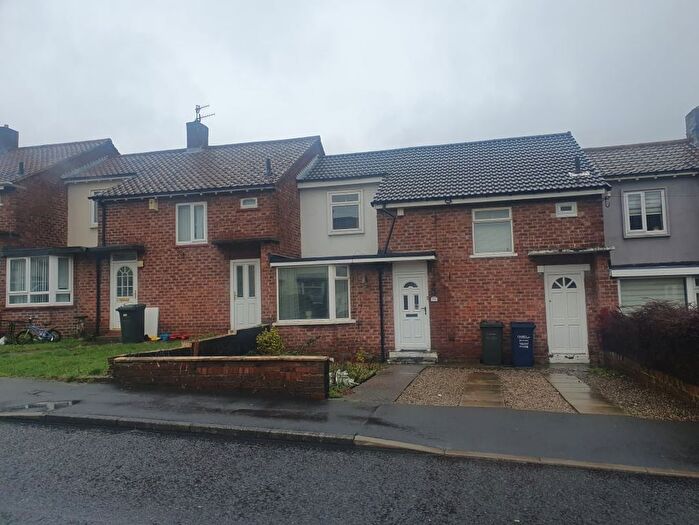
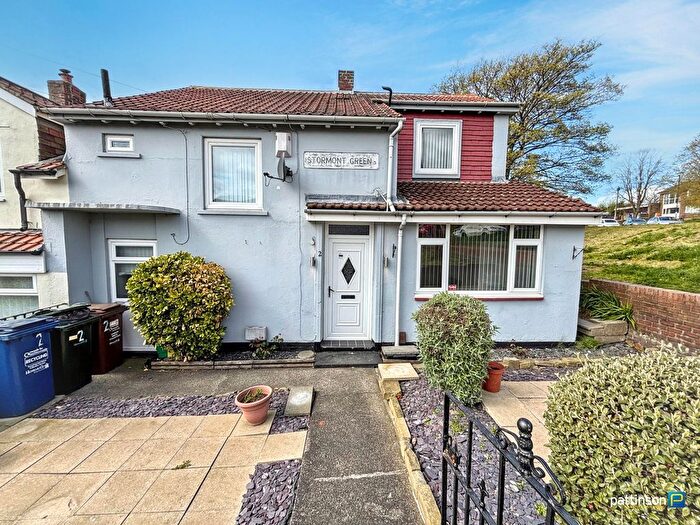
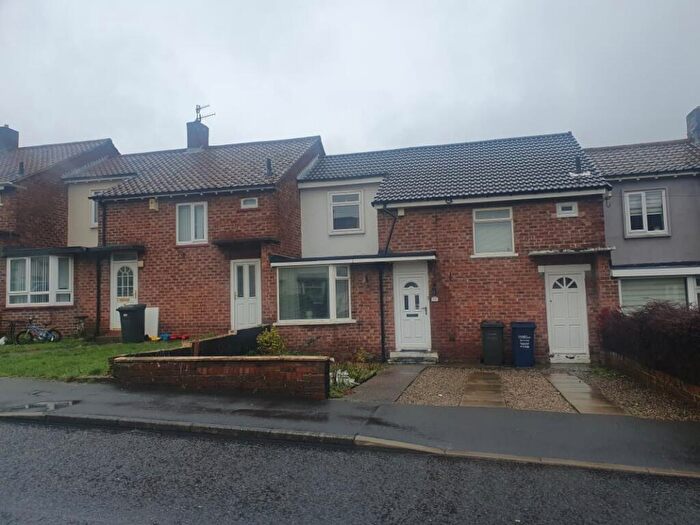
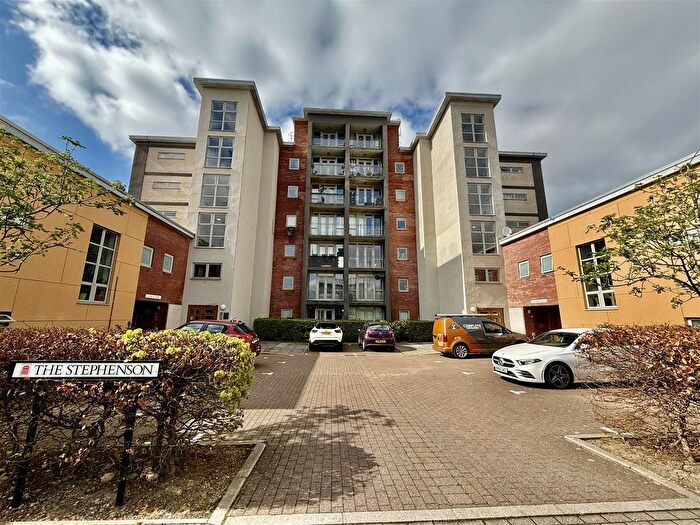
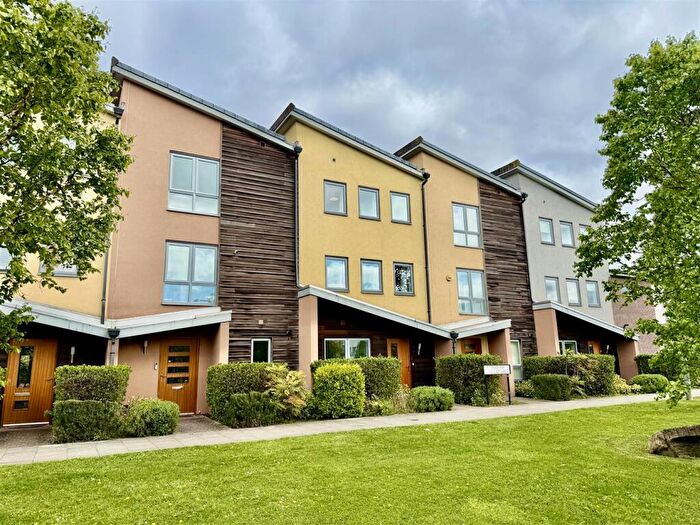
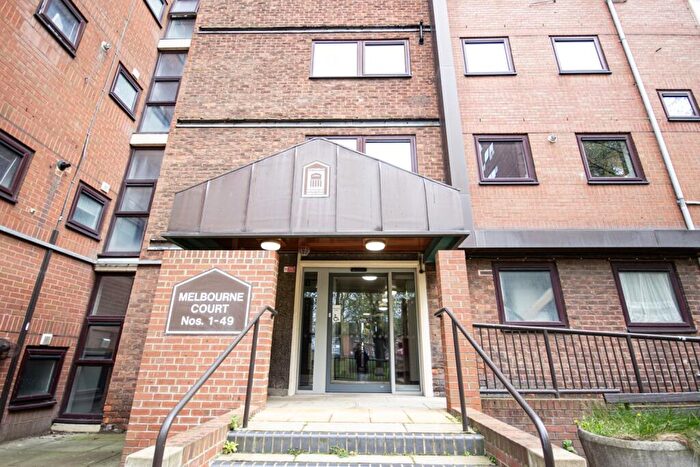
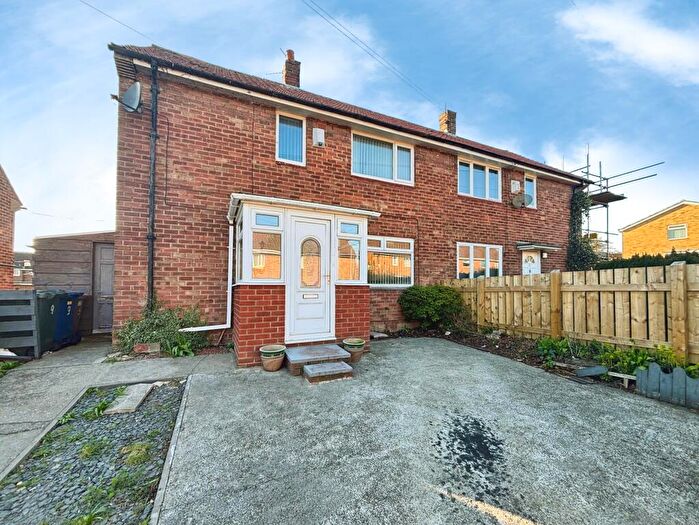
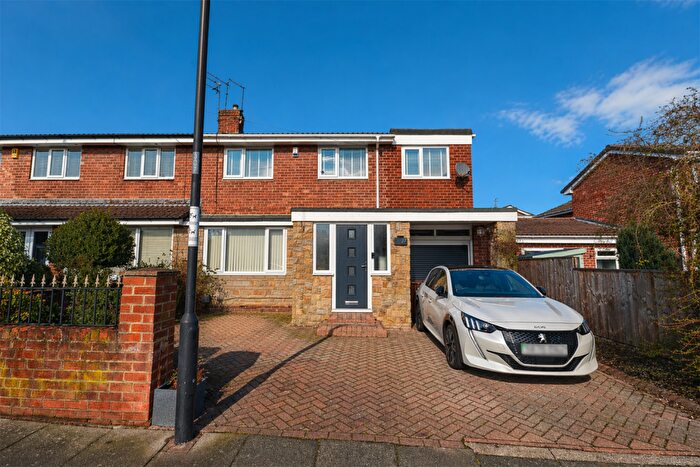
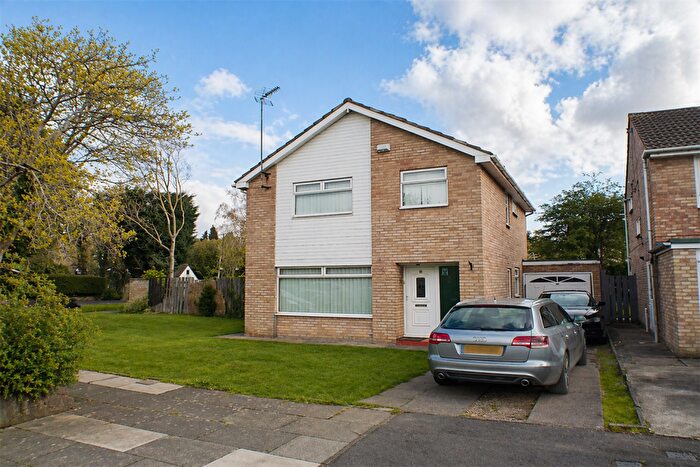
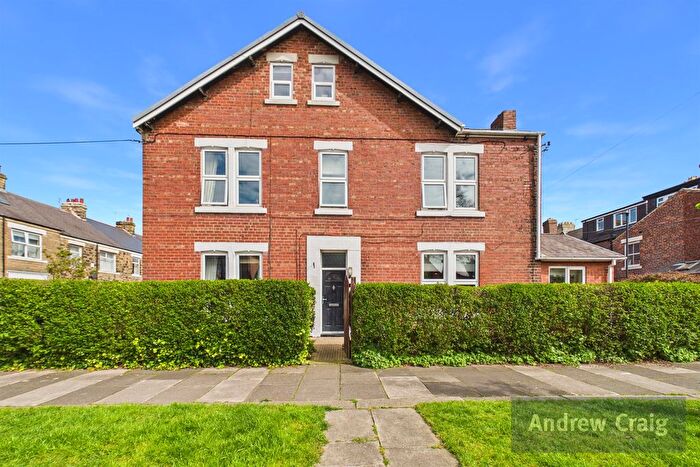
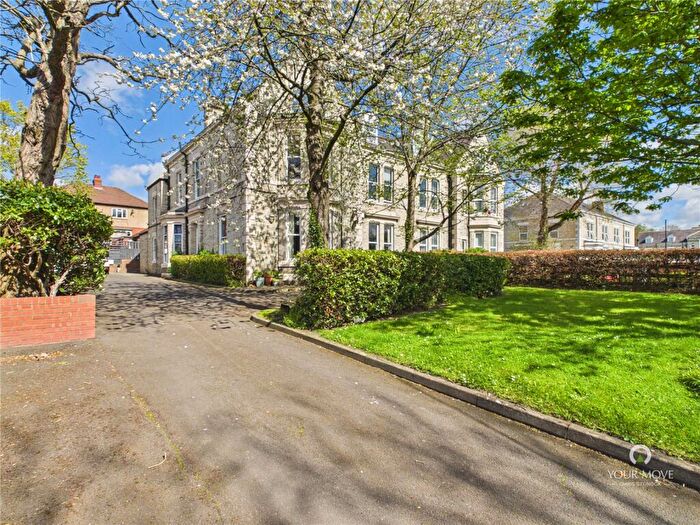
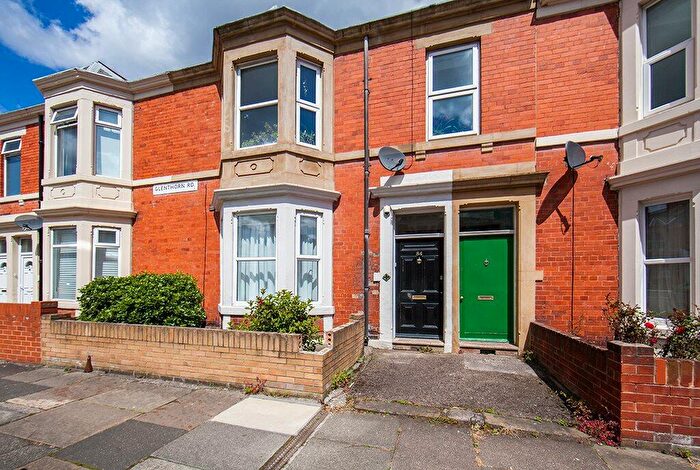
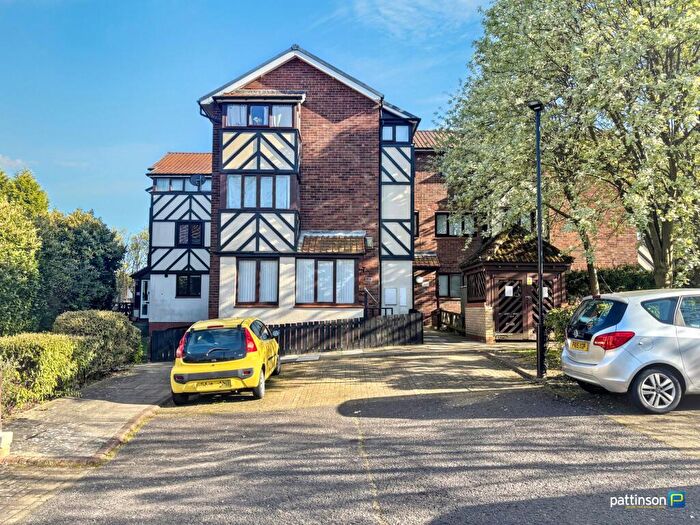
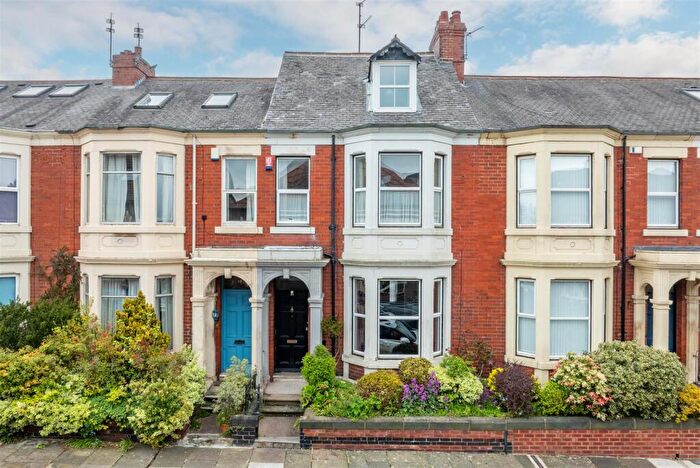
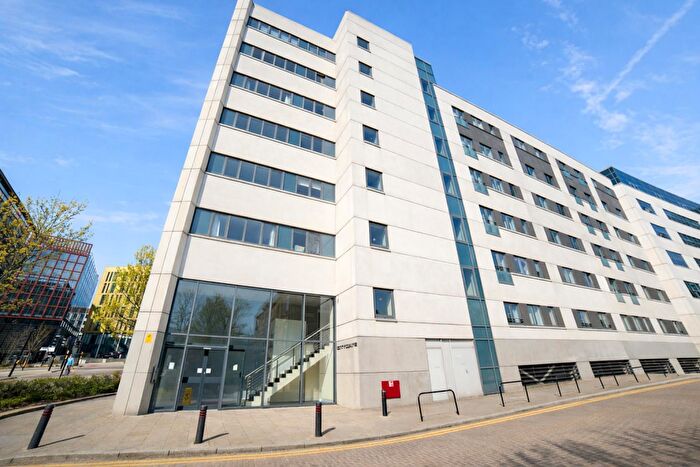
Properties for sale in Newcastle Upon Tyne
![]()
If you are looking to sell your house, let it out, or receive a property valuation, an expert can help you.
Click the button below to get started.

Neighbourhoods in Newcastle Upon Tyne
Navigate through our locations to find the location of your next house in Newcastle Upon Tyne, Newcastle upon Tyne for sale or to rent.
- Benwell And Scotswood
- Blakelaw
- Byker
- Castle
- Dene
- Denton
- East Gosforth
- Elswick
- Fawdon
- Fenham
- Kenton
- Lemington
- Newburn
- North Heaton
- North Jesmond
- Ouseburn
- Parklands
- South Heaton
- South Jesmond
- Walker
- Walkergate
- West Gosforth
- Westerhope
- Westgate
- Wingrove
- Woolsington
- Arthur's Hill
- Callerton & Throckley
- Benwell & Scotswood
- Chapel
- West Fenham
- Dene & South Gosforth
- Fawdon & West Gosforth
- Kingston Park South & Newbiggin Hall
- Denton & Westerhope
- Monument
- Gosforth
- Heaton
- Manor Park
Transport in Newcastle Upon Tyne
Please see below transportation links in this area:

- FAQ
- Price Paid By Year
- Property Type Price
Frequently asked questions about Newcastle Upon Tyne
What is the average price for a property for sale in Newcastle Upon Tyne?
The average price for a property for sale in Newcastle Upon Tyne is £236,821. There are more than 10,000 property listings for sale in Newcastle Upon Tyne.
What locations have the most expensive properties for sale in Newcastle Upon Tyne?
The locations with the most expensive properties for sale in Newcastle Upon Tyne are West Gosforth at an average of £435,024, Castle at an average of £409,174 and North Jesmond at an average of £399,205.
What locations have the most affordable properties for sale in Newcastle Upon Tyne?
The locations with the most affordable properties for sale in Newcastle Upon Tyne are Arthur's Hill at an average of £94,571, Elswick at an average of £113,834 and Walker at an average of £114,417.
Which train stations are available in or near Newcastle Upon Tyne?
Some of the train stations available in or near Newcastle Upon Tyne are Newcastle, Manors and MetroCentre.
Property Price Paid in Newcastle Upon Tyne by Year
The average sold property price by year was:
| Year | Average Sold Price | Price Change |
Sold Properties
|
|---|---|---|---|
| 2026 | £220,589 | -26% |
83 Properties |
| 2025 | £276,893 | 20% |
3,061 Properties |
| 2024 | £220,403 | 0,2% |
3,655 Properties |
| 2023 | £220,019 | -1% |
3,649 Properties |
| 2022 | £222,300 | 2% |
4,030 Properties |
| 2021 | £217,295 | 8% |
5,026 Properties |
| 2020 | £198,887 | 3% |
3,786 Properties |
| 2019 | £192,344 | 2% |
4,158 Properties |
| 2018 | £188,135 | 3% |
4,162 Properties |
| 2017 | £182,940 | -2% |
4,387 Properties |
| 2016 | £186,226 | 4% |
4,207 Properties |
| 2015 | £178,843 | 5% |
4,190 Properties |
| 2014 | £169,539 | 2% |
4,040 Properties |
| 2013 | £166,536 | -1% |
3,013 Properties |
| 2012 | £168,813 | 3% |
2,555 Properties |
| 2011 | £163,683 | -6% |
2,711 Properties |
| 2010 | £173,657 | 2% |
2,431 Properties |
| 2009 | £170,365 | -5% |
2,796 Properties |
| 2008 | £178,074 | 4% |
2,953 Properties |
| 2007 | £171,179 | 4% |
5,473 Properties |
| 2006 | £163,586 | 7% |
6,186 Properties |
| 2005 | £151,560 | 3% |
5,161 Properties |
| 2004 | £147,645 | 15% |
5,668 Properties |
| 2003 | £125,279 | 21% |
5,892 Properties |
| 2002 | £98,471 | 17% |
6,031 Properties |
| 2001 | £82,083 | 11% |
5,532 Properties |
| 2000 | £72,797 | 6% |
4,883 Properties |
| 1999 | £68,719 | 6% |
4,746 Properties |
| 1998 | £64,461 | 9% |
4,547 Properties |
| 1997 | £58,347 | 6% |
4,589 Properties |
| 1996 | £55,056 | 2% |
4,026 Properties |
| 1995 | £53,808 | - |
3,364 Properties |
Property Price per Property Type in Newcastle Upon Tyne
Here you can find historic sold price data in order to help with your property search.
The average Property Paid Price for specific property types in the last three years are:
| Property Type | Average Sold Price | Sold Properties |
|---|---|---|
| Semi Detached House | £235,355.00 | 2,939 Semi Detached Houses |
| Terraced House | £224,143.00 | 3,644 Terraced Houses |
| Detached House | £520,519.00 | 1,032 Detached Houses |
| Flat | £151,303.00 | 2,833 Flats |