
Houses for sale & to rent in Newcastle upon Tyne, England
House Prices in Newcastle upon Tyne
Properties in Newcastle upon Tyne have
an average house price of
£224k
and had 11,155 Property Transactions
within the last 3 years.¹
Newcastle upon Tyne is a location in
England with
116,561 households², where the most expensive property was sold for £5.35M.
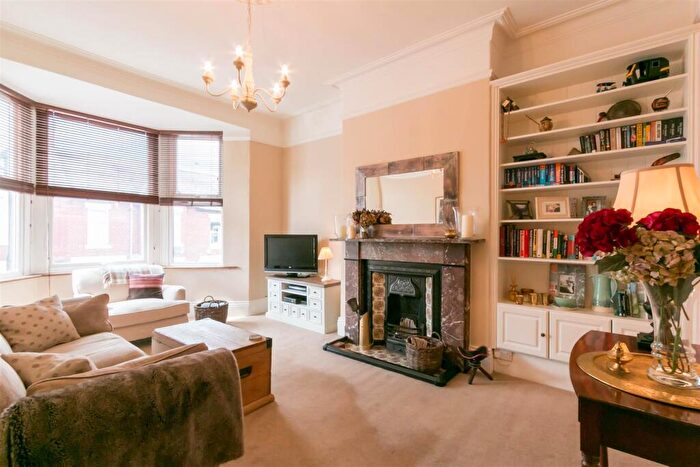
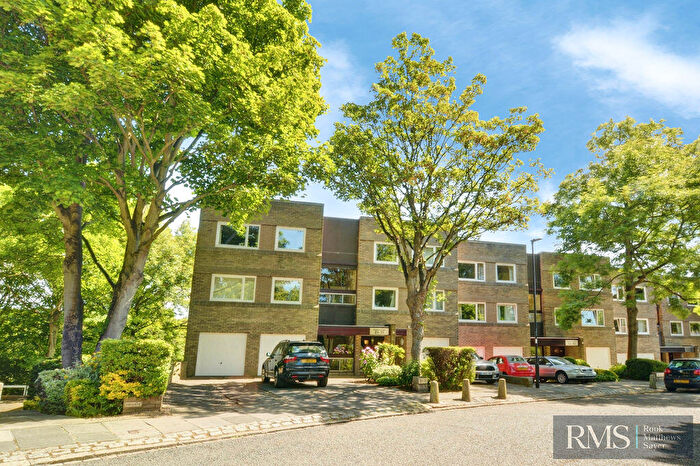
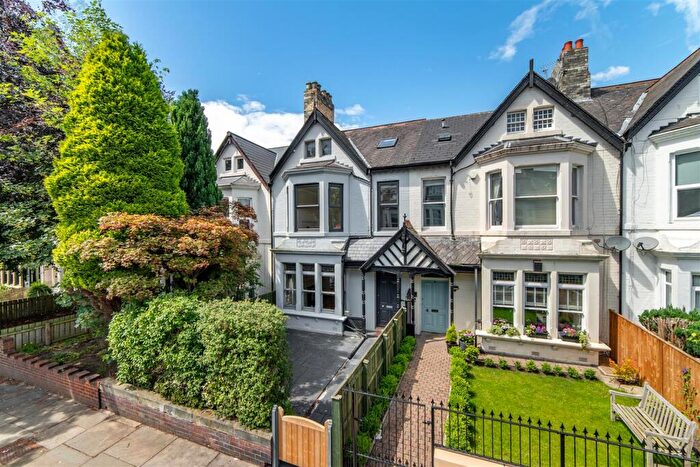
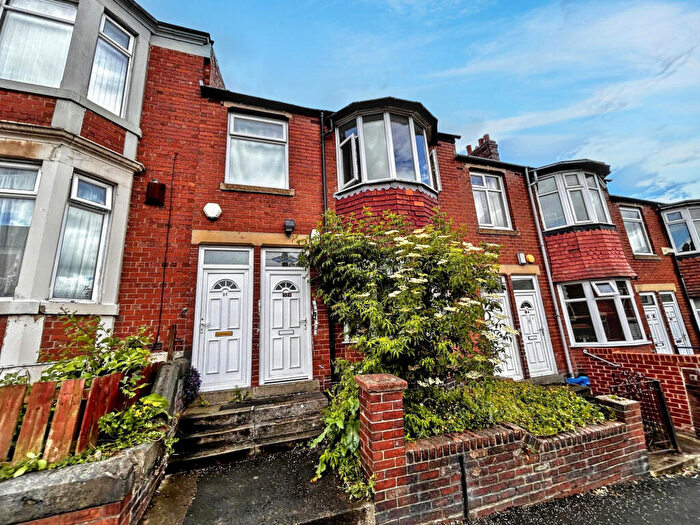
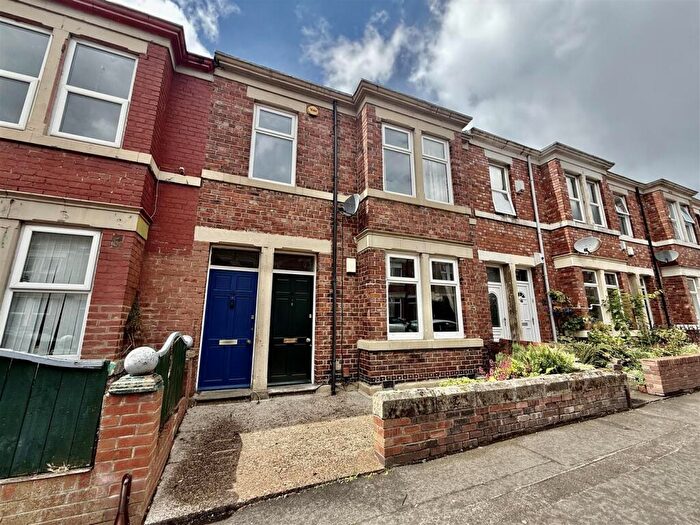
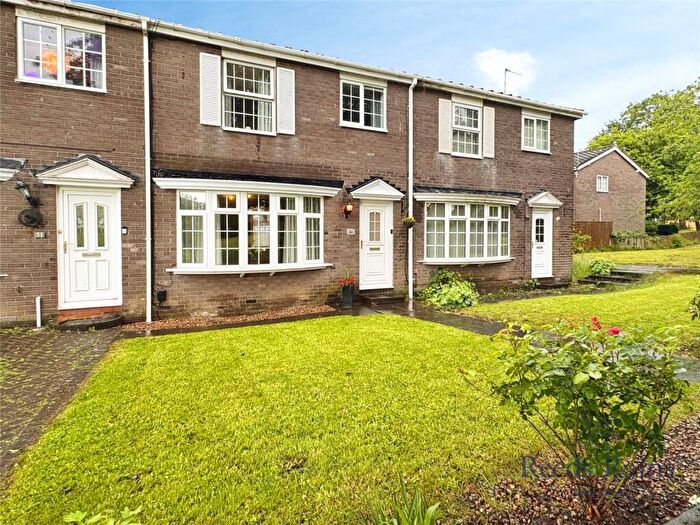
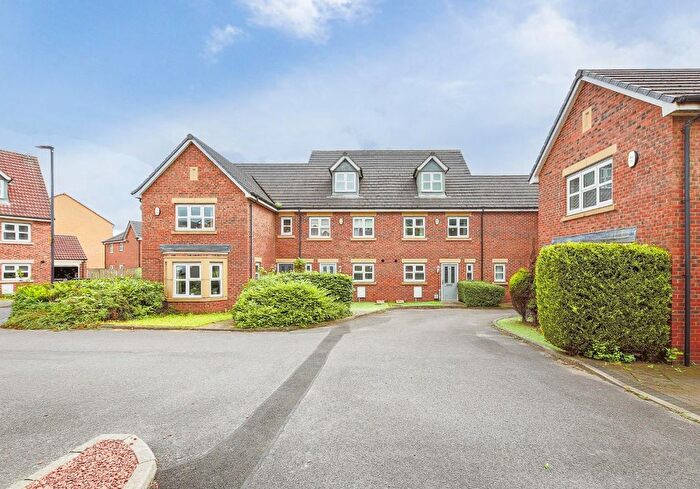
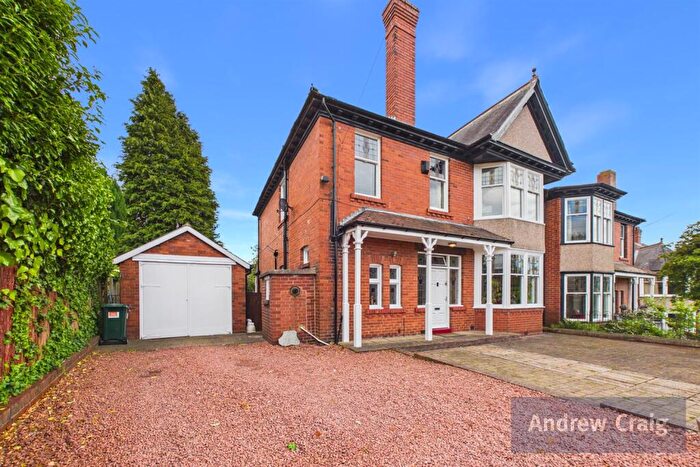
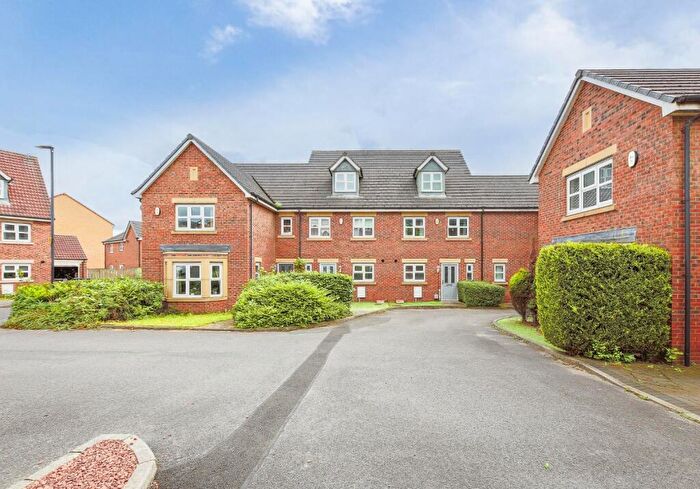
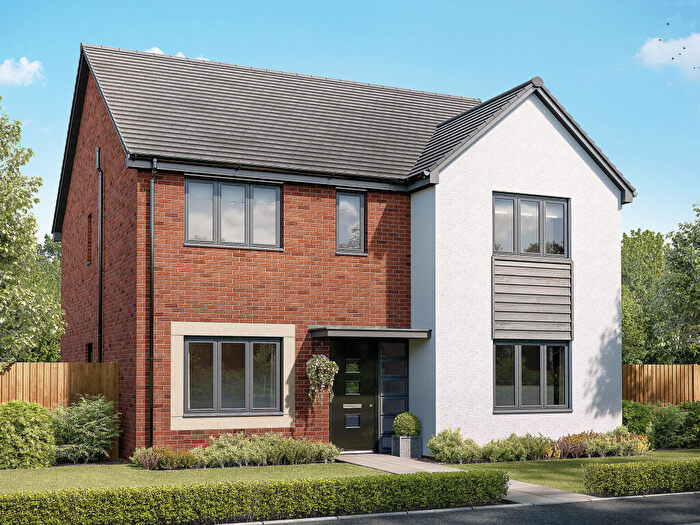
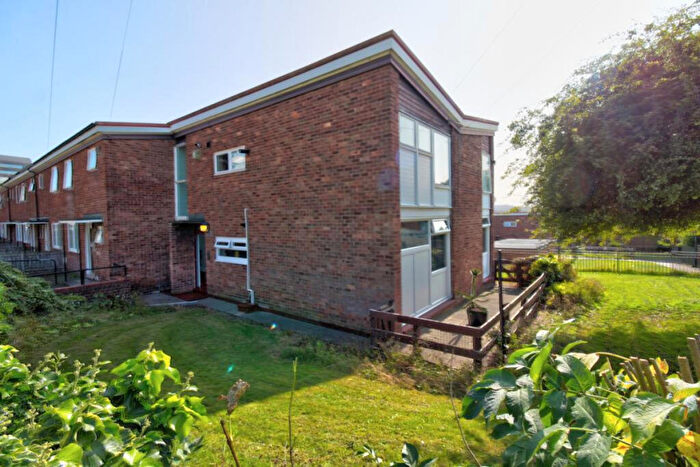
Properties for sale in Newcastle upon Tyne
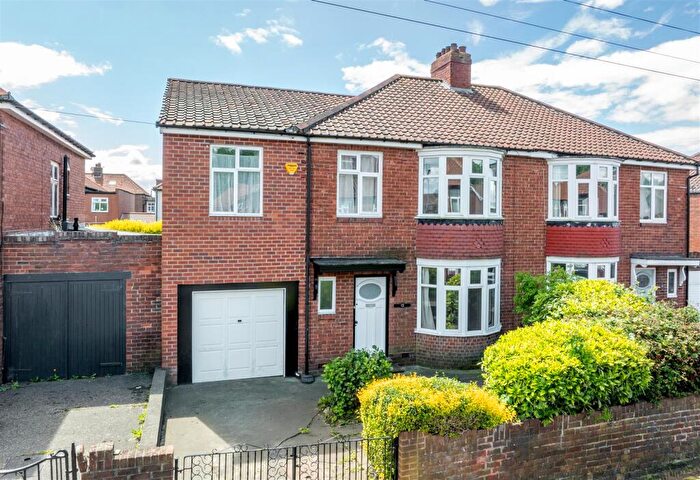
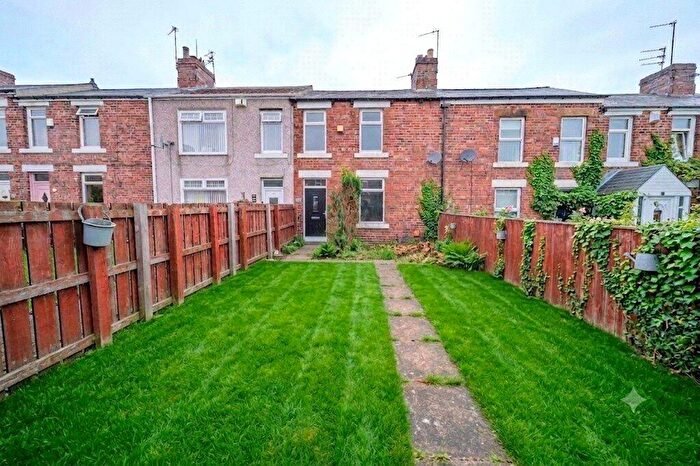
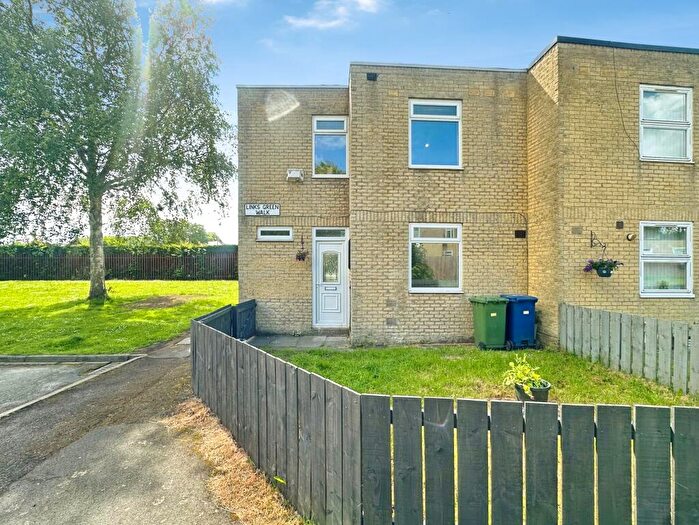
![]()
If you are looking to sell your house, let it out, or receive a property valuation, an expert can help you.
Click the button below to get started.
Towns in Newcastle upon Tyne
Navigate through our locations to find the location of your next house in Newcastle upon Tyne, England for sale or to rent.
Transport in Newcastle upon Tyne
Please see below transportation links in this area:

- FAQ
- Price Paid By Year
- Property Type Price
Frequently asked questions about Newcastle upon Tyne
What is the average price for a property for sale in Newcastle upon Tyne?
The average price for a property for sale in Newcastle upon Tyne is £223,762. This amount is 38% lower than the average price in England. There are more than 10,000 property listings for sale in Newcastle upon Tyne.
Which train stations are available in or near Newcastle upon Tyne?
Some of the train stations available in or near Newcastle upon Tyne are Newcastle, Manors and MetroCentre.
Property Price Paid in Newcastle upon Tyne by Year
The average sold property price by year was:
| Year | Average Sold Price | Price Change |
Sold Properties
|
|---|---|---|---|
| 2026 | £226,504 | -2% |
441 Properties |
| 2025 | £231,234 | 5% |
3,404 Properties |
| 2024 | £220,226 | 0,1% |
3,660 Properties |
| 2023 | £220,010 | -1% |
3,650 Properties |
| 2022 | £222,269 | 2% |
4,031 Properties |
| 2021 | £217,255 | 8% |
5,029 Properties |
| 2020 | £198,892 | 3% |
3,788 Properties |
| 2019 | £192,344 | 2% |
4,158 Properties |
| 2018 | £188,135 | 3% |
4,162 Properties |
| 2017 | £182,940 | -2% |
4,387 Properties |
| 2016 | £186,226 | 4% |
4,207 Properties |
| 2015 | £178,843 | 5% |
4,190 Properties |
| 2014 | £169,539 | 2% |
4,040 Properties |
| 2013 | £166,536 | -1% |
3,013 Properties |
| 2012 | £168,813 | 3% |
2,555 Properties |
| 2011 | £163,683 | -6% |
2,711 Properties |
| 2010 | £173,657 | 2% |
2,431 Properties |
| 2009 | £170,365 | -5% |
2,796 Properties |
| 2008 | £178,074 | 4% |
2,953 Properties |
| 2007 | £171,179 | 4% |
5,473 Properties |
| 2006 | £163,586 | 7% |
6,186 Properties |
| 2005 | £151,560 | 3% |
5,161 Properties |
| 2004 | £147,645 | 15% |
5,668 Properties |
| 2003 | £125,279 | 21% |
5,892 Properties |
| 2002 | £98,471 | 17% |
6,031 Properties |
| 2001 | £82,083 | 11% |
5,532 Properties |
| 2000 | £72,797 | 6% |
4,883 Properties |
| 1999 | £68,719 | 6% |
4,746 Properties |
| 1998 | £64,461 | 9% |
4,547 Properties |
| 1997 | £58,340 | 6% |
4,590 Properties |
| 1996 | £55,056 | 2% |
4,026 Properties |
| 1995 | £53,808 | - |
3,364 Properties |
Property Price per Property Type in Newcastle upon Tyne
Here you can find historic sold price data in order to help with your property search.
The average Property Paid Price for specific property types in the last three years are:
| Property Type | Average Sold Price | Sold Properties |
|---|---|---|
| Semi Detached House | £235,342.00 | 3,135 Semi Detached Houses |
| Terraced House | £223,746.00 | 3,893 Terraced Houses |
| Detached House | £391,123.00 | 1,098 Detached Houses |
| Flat | £151,132.00 | 3,029 Flats |