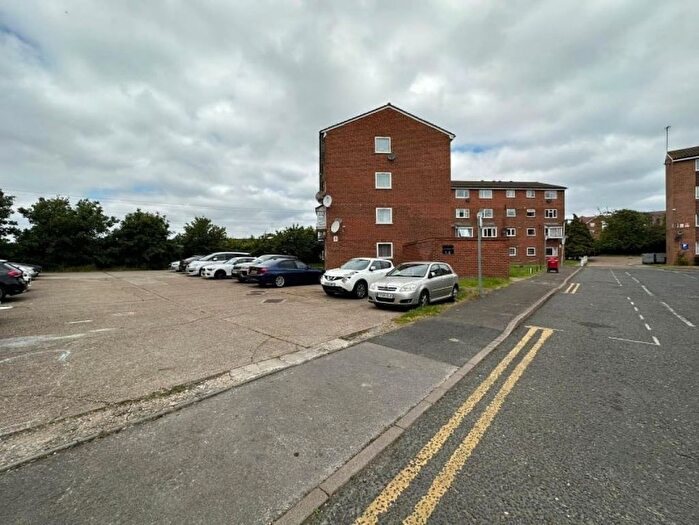
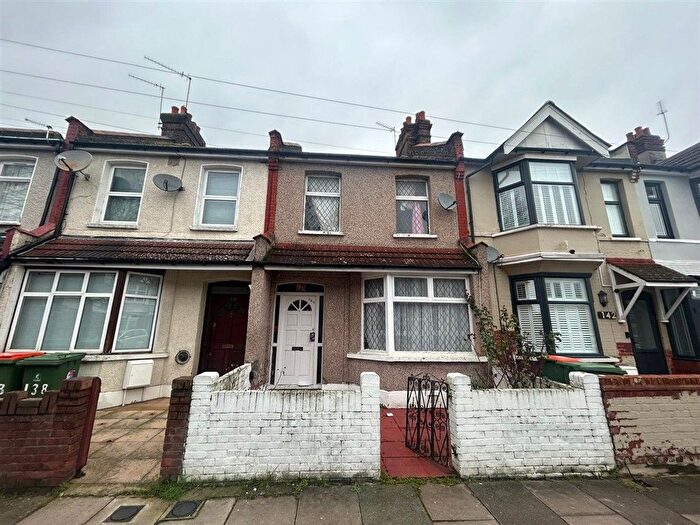
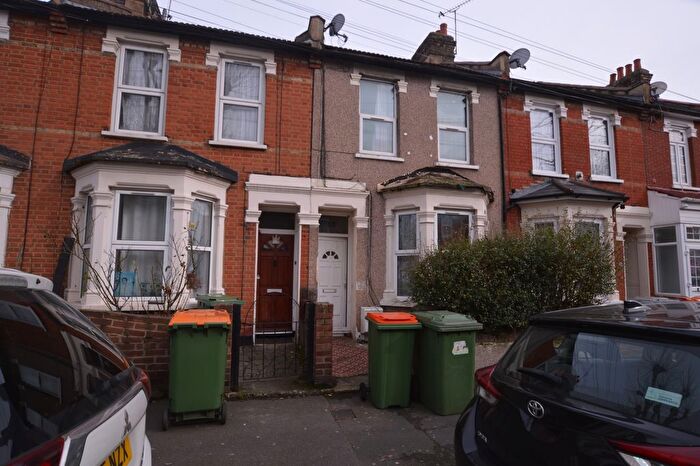
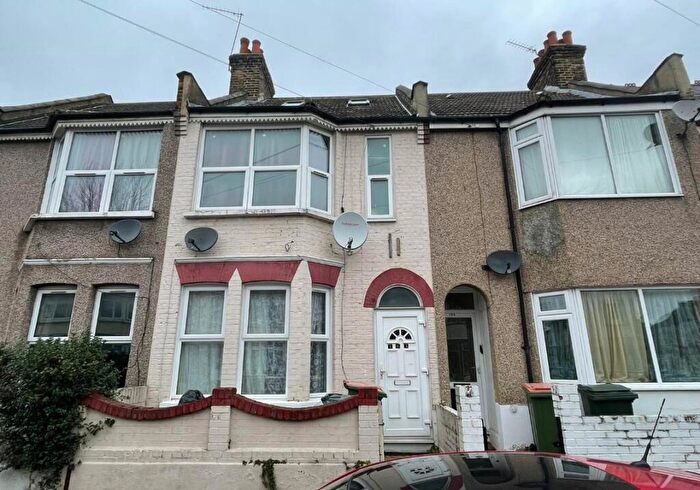
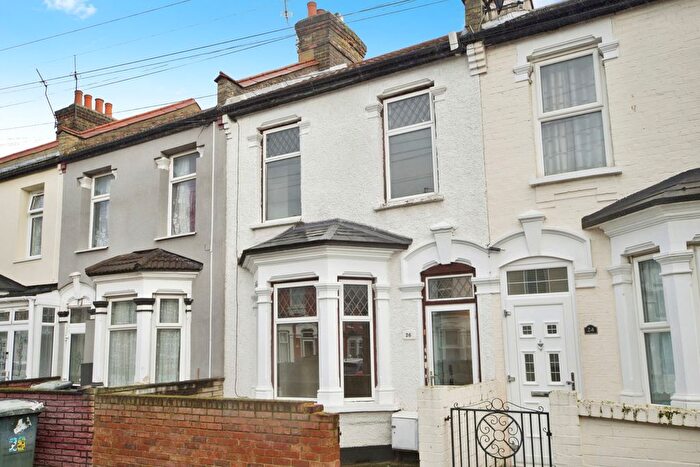
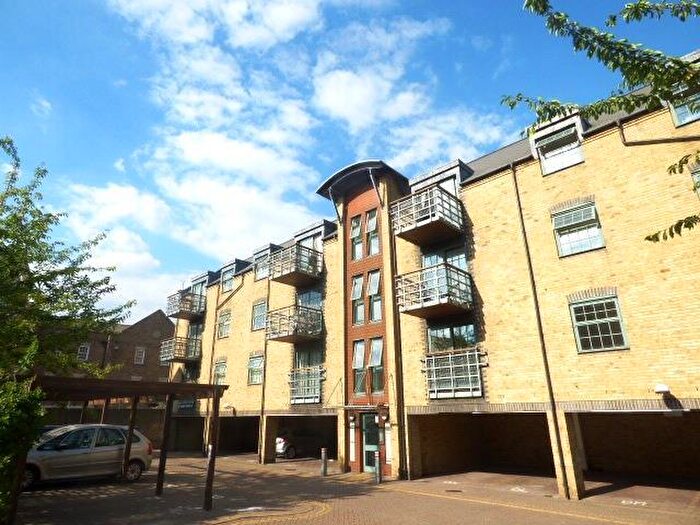
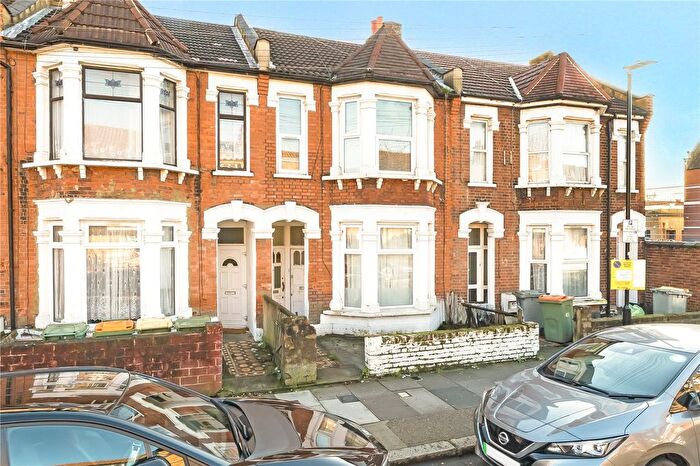
Houses for sale & to rent in Wall End, London
House Prices in Wall End
Properties in this part of Wall End within London have an average house price of £404,612.00 and had 190 Property Transactions within the last 3 years¹. This area has 4,256 households² , where the most expensive property was sold for £667,500.00.
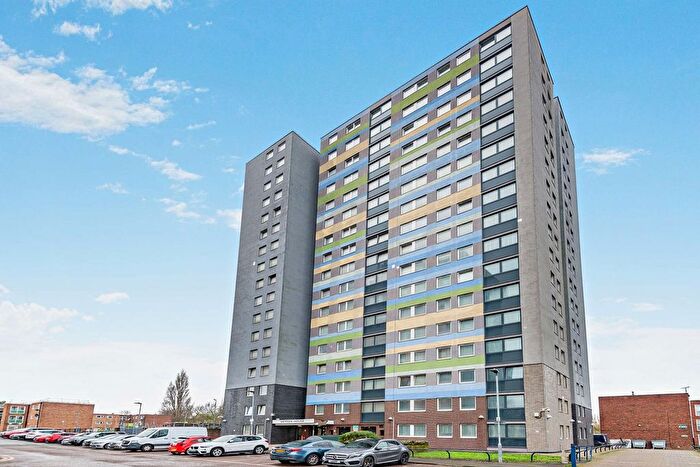
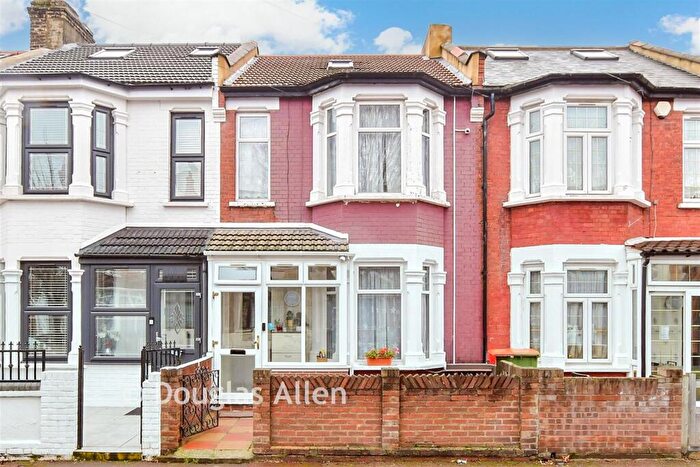
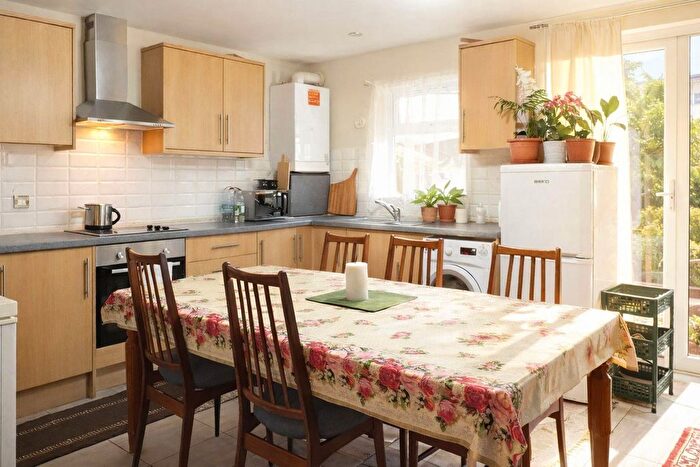
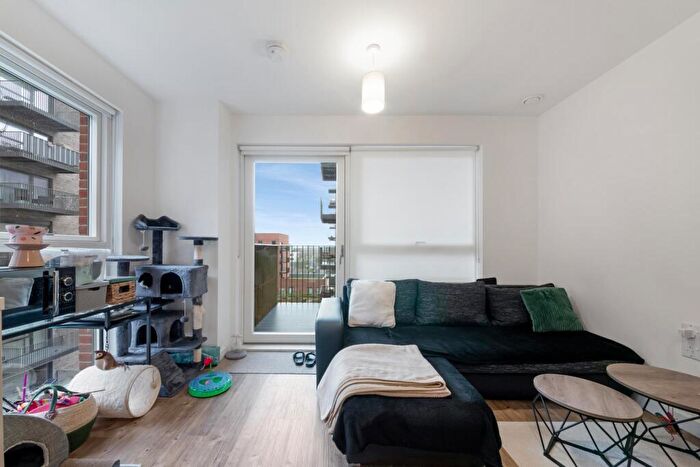
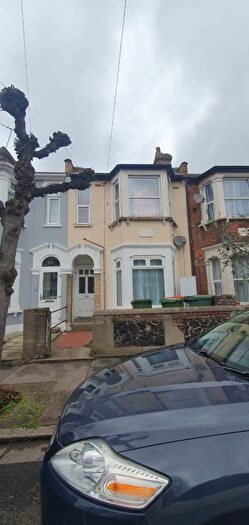
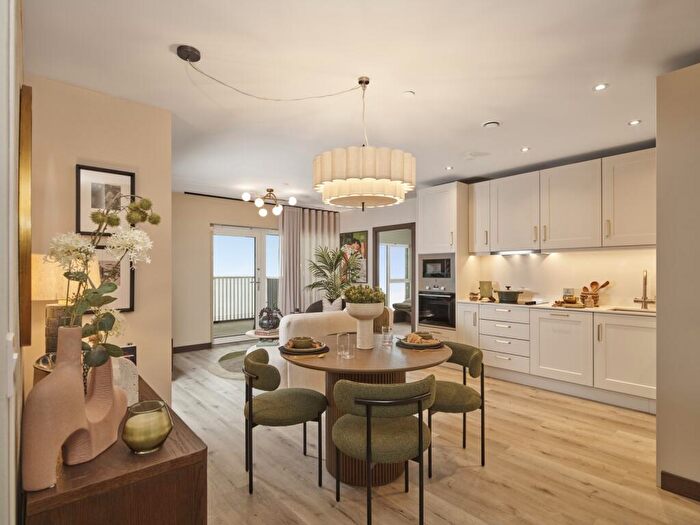
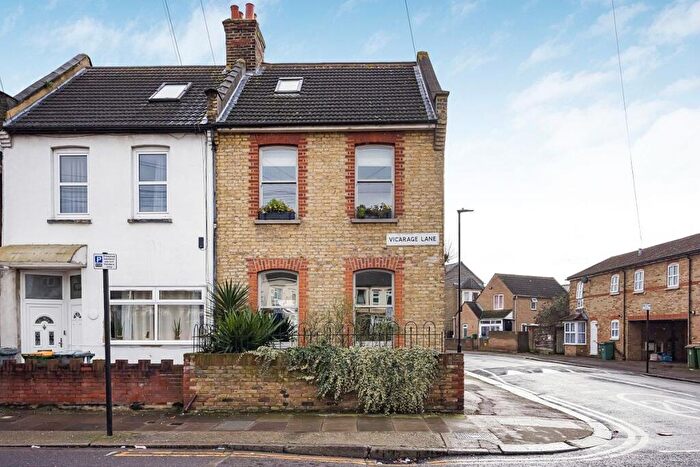
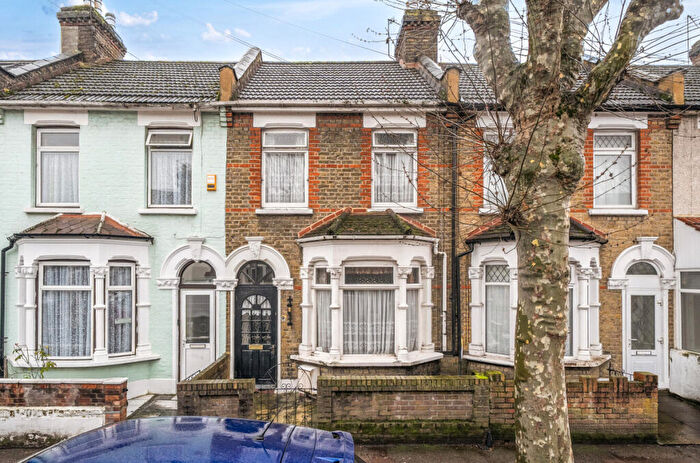
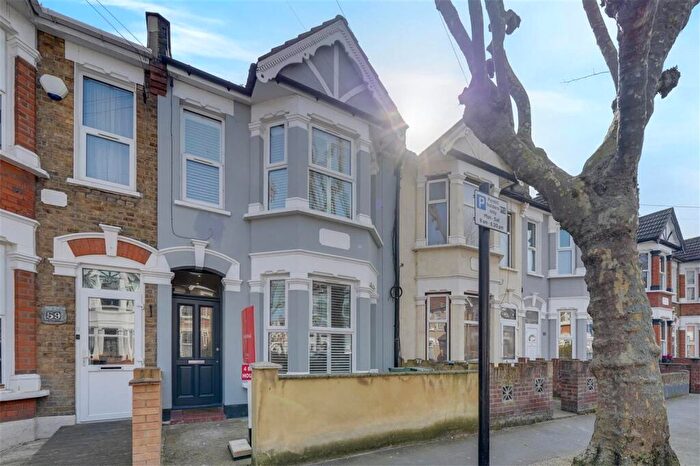
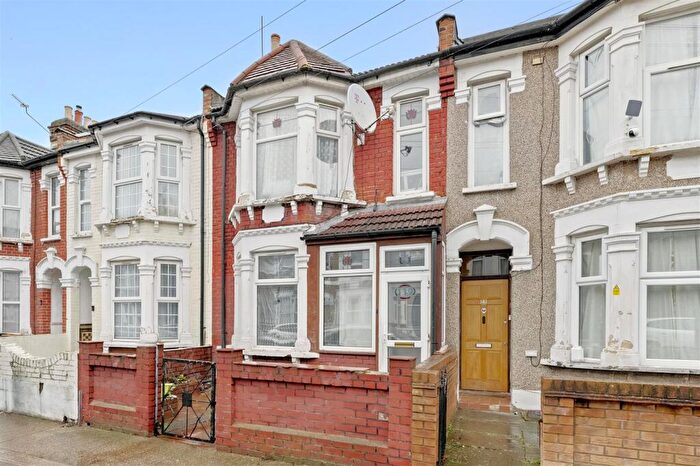
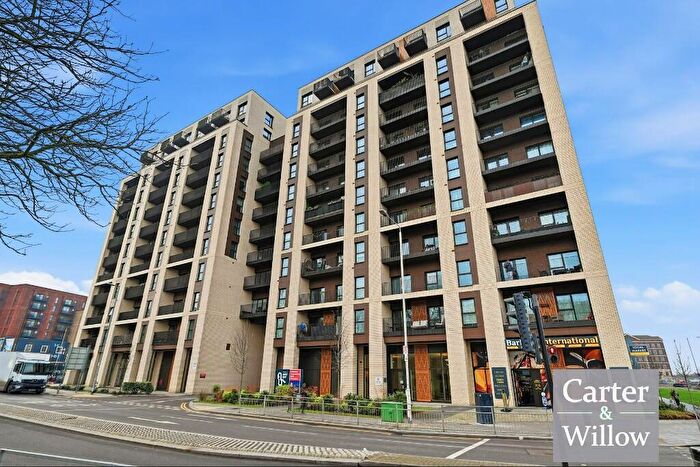
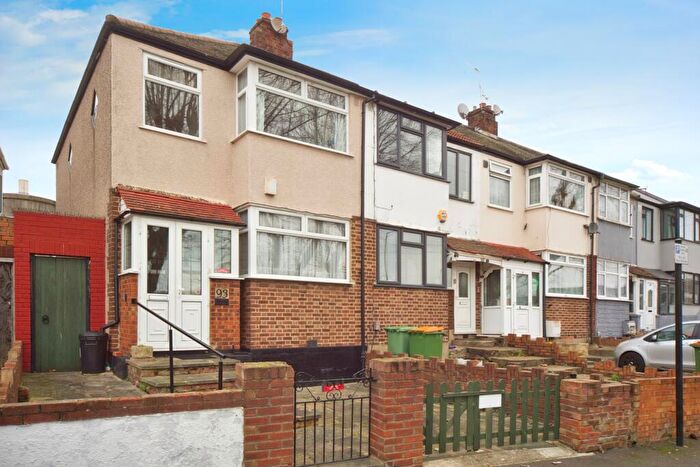
Properties for sale in Wall End
Roads and Postcodes in Wall End
Navigate through our locations to find the location of your next house in Wall End, London for sale or to rent.
| Streets | Postcodes |
|---|---|
| Altmore Avenue | E6 2AD E6 2AE E6 2BT E6 2BU E6 2BX E6 2BY |
| Anglia Walk | E6 2RS |
| Ashford Road | E6 2AP E6 2AW |
| Barking Road | E6 2LN E6 2LP E6 2LR E6 2LS E6 2LT E6 2LW E6 2RT E6 2SA |
| Bedford Road | E6 2NL E6 2NN |
| Bridge Road | E6 2AG |
| Burges Road | E6 2BH E6 2BJ E6 2BL E6 2BN E6 2BS E6 2BW E6 2EQ E6 2ES E6 2ET E6 2EU |
| Caledon Road | E6 2EX E6 2EZ E6 2HA E6 2HB E6 2HD |
| Calverton Road | E6 2NS E6 2NT |
| Canberra Road | E6 2RW |
| Caulfield Road | E6 2DG E6 2DH E6 2DJ E6 2DQ E6 2EL E6 2EN |
| Clements Road | E6 2DF E6 2DL E6 2DN E6 2DP E6 2DR E6 2DW |
| Didsbury Close | E6 2SX |
| Drakes Walk | E6 2RN |
| Dukes Road | E6 2NU |
| Flanders Road | E6 6BL |
| Hall Road | E6 2ND E6 2NG E6 2NQ |
| Holland Road | E6 2EP E6 2EW |
| Kempton Road | E6 2NE E6 2NF E6 2PB E6 2PD |
| Keppel Road | E6 2BE E6 2BG |
| Langdon Crescent | E6 2PP E6 2PW |
| Langdon Road | E6 2QB |
| Lathom Road | E6 2DX E6 2DY E6 2DZ E6 2EA E6 2EB |
| Leigh Road | E6 2AR E6 2AS |
| Lydeard Road | E6 2AB |
| Market Street | E6 2PU E6 2PX E6 2RB E6 2RD |
| Melbourne Road | E6 2RU E6 2RX |
| Napier Road | E6 2SE E6 2SF E6 2SG |
| Nelson Street | E6 2QA E6 2RJ |
| Norfolk Road | E6 2NH E6 2NJ |
| Northfield Road | E6 2AJ |
| Park Avenue | E6 2PN E6 2PY E6 2PZ E6 2SP E6 2SR |
| Ranelagh Road | E6 2SH E6 2SJ E6 2SL |
| Shoebury Road | E6 2AQ |
| Skeffington Road | E6 2NA E6 2NB |
| Southend Road | E6 2AA E6 2AL E6 2AN |
| Springfield Road | E6 2AH |
| St Olaves Road | E6 2NX E6 2PA |
| Stevenage Road | E6 2AT E6 2AU E6 2AX |
| Sussex Road | E6 2PS E6 2PT |
| Talbot Road | E6 2RY E6 2RZ |
| The Willows | E6 2EY |
| Wall End Road | E6 2NP E6 2NR E6 2NW |
| Walter Rodney Close | E6 2BA |
| Watson Avenue | E6 2BP E6 2DA |
| Wellington Road | E6 2RQ E6 6EB |
Transport near Wall End
-
East Ham Station
-
Barking Station
-
Upton Park Station
-
Woodgrange Park Station
-
Manor Park Station
-
Beckton Station
-
Ilford Station
-
Upney Station
-
Forest Gate Station
-
Wanstead Park Station
- FAQ
- Price Paid By Year
- Property Type Price
Frequently asked questions about Wall End
What is the average price for a property for sale in Wall End?
The average price for a property for sale in Wall End is £404,612. This amount is 6% lower than the average price in London. There are 2,073 property listings for sale in Wall End.
What streets have the most expensive properties for sale in Wall End?
The streets with the most expensive properties for sale in Wall End are Watson Avenue at an average of £595,000, Altmore Avenue at an average of £515,416 and Springfield Road at an average of £512,500.
What streets have the most affordable properties for sale in Wall End?
The streets with the most affordable properties for sale in Wall End are Stevenage Road at an average of £178,000, Melbourne Road at an average of £275,500 and Barking Road at an average of £283,062.
Which train stations are available in or near Wall End?
Some of the train stations available in or near Wall End are Barking, Woodgrange Park and Manor Park.
Which tube stations are available in or near Wall End?
Some of the tube stations available in or near Wall End are East Ham, Barking and Upton Park.
Property Price Paid in Wall End by Year
The average sold property price by year was:
| Year | Average Sold Price | Price Change |
Sold Properties
|
|---|---|---|---|
| 2025 | £424,690 | 4% |
67 Properties |
| 2024 | £407,374 | 7% |
64 Properties |
| 2023 | £378,815 | -4% |
59 Properties |
| 2022 | £395,776 | 6% |
74 Properties |
| 2021 | £370,747 | 1% |
91 Properties |
| 2020 | £368,162 | 5% |
51 Properties |
| 2019 | £349,829 | 1% |
75 Properties |
| 2018 | £345,937 | 0,5% |
85 Properties |
| 2017 | £344,348 | 2% |
69 Properties |
| 2016 | £337,213 | 18% |
82 Properties |
| 2015 | £276,362 | 13% |
148 Properties |
| 2014 | £240,205 | 13% |
113 Properties |
| 2013 | £208,865 | 0,4% |
82 Properties |
| 2012 | £208,078 | -2% |
61 Properties |
| 2011 | £211,573 | 3% |
78 Properties |
| 2010 | £205,742 | 4% |
65 Properties |
| 2009 | £197,631 | -11% |
57 Properties |
| 2008 | £219,310 | -2% |
114 Properties |
| 2007 | £222,634 | 7% |
226 Properties |
| 2006 | £206,673 | 6% |
224 Properties |
| 2005 | £194,890 | 2% |
190 Properties |
| 2004 | £190,150 | 10% |
217 Properties |
| 2003 | £171,097 | 20% |
288 Properties |
| 2002 | £137,050 | 21% |
266 Properties |
| 2001 | £107,846 | 16% |
303 Properties |
| 2000 | £90,090 | 21% |
233 Properties |
| 1999 | £71,262 | 10% |
247 Properties |
| 1998 | £64,148 | 13% |
215 Properties |
| 1997 | £55,814 | 13% |
225 Properties |
| 1996 | £48,687 | 4% |
188 Properties |
| 1995 | £46,914 | - |
164 Properties |
Property Price per Property Type in Wall End
Here you can find historic sold price data in order to help with your property search.
The average Property Paid Price for specific property types in the last three years are:
| Property Type | Average Sold Price | Sold Properties |
|---|---|---|
| Semi Detached House | £451,562.00 | 8 Semi Detached Houses |
| Terraced House | £435,481.00 | 150 Terraced Houses |
| Flat | £235,056.00 | 30 Flats |
| Detached House | £445,000.00 | 2 Detached Houses |

