Houses for sale & to rent in London, Newham London Borough
House Prices in London, Newham London Borough
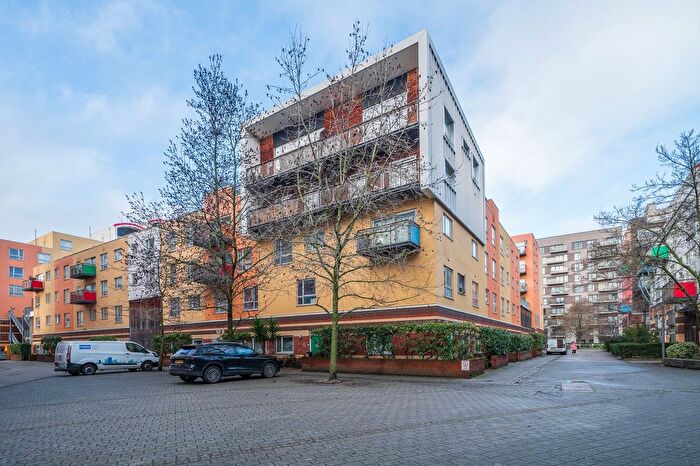
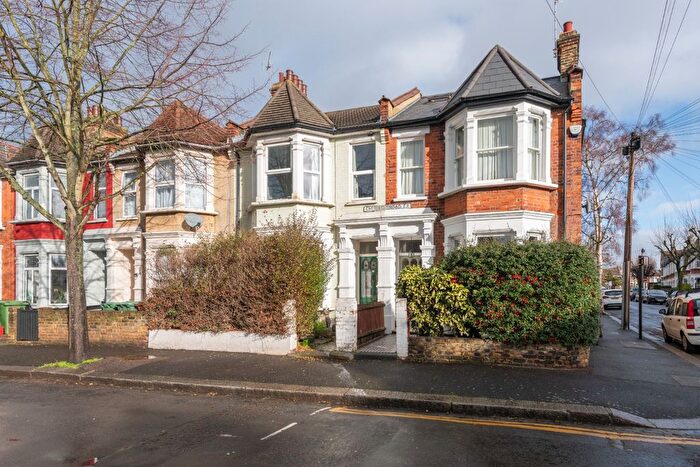
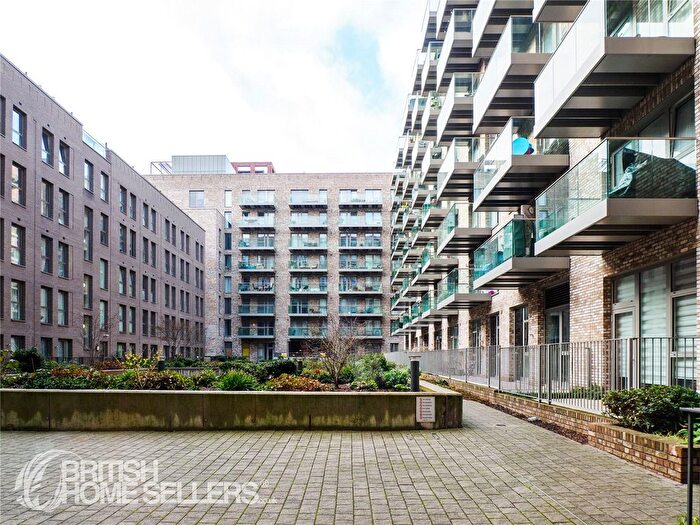
Properties in this part of London within the Newham London Borough have an average house price of £430,905.00 and had 5,418 Property Transactions within the last 3 years.¹ This area has 101,373 households² , where the most expensive property was sold for £2,625,000.00.
Properties for sale in London, Newham London Borough
Neighbourhoods in London, Newham London Borough
Navigate through our locations to find the location of your next house in London, Newham London Borough for sale or to rent.
- Boleyn
- Beckton
- Canning Town North
- Canning Town South
- Custom House
- East Ham Central
- East Ham North
- East Ham South
- Forest Gate North
- Forest Gate South
- Green Street East
- Green Street West
- Little Ilford
- Manor Park
- Plaistow North
- Plaistow South
- Royal Docks
- Stratford And New Town
- Wall End
- West Ham
- Maryland
- Stratford
- Royal Victoria
- Royal Albert
- Plaistow West & Canning Town East
- Stratford Olympic Park
- East Ham
Transport in London, Newham London Borough
Please see below transportation links in this area:
-
Upton Park Station
-
Plaistow Station
-
West Ham Station
-
East Ham Station
-
Abbey Road Station
-
Star Lane Station
-
Forest Gate Station
-
Woodgrange Park Station
-
Stratford High Street Station
-
Custom House Station
- FAQ
- Price Paid By Year
- Property Type Price
Frequently asked questions about London, Newham London Borough
What is the average price for a property for sale in London, Newham London Borough?
The average price for a property for sale in London, Newham London Borough is £430,905. There are more than 10,000 property listings for sale in London, Newham London Borough.
What locations have the most expensive properties for sale in London, Newham London Borough?
The locations with the most expensive properties for sale in London, Newham London Borough are Forest Gate North at an average of £525,557, Forest Gate South at an average of £494,813 and Manor Park at an average of £474,581.
What locations have the most affordable properties for sale in London, Newham London Borough?
The locations with the most affordable properties for sale in London, Newham London Borough are Canning Town North at an average of £369,004, Beckton at an average of £371,123 and Custom House at an average of £372,691.
Which train stations are available in or near London, Newham London Borough?
Some of the train stations available in or near London, Newham London Borough are West Ham, Forest Gate and Woodgrange Park.
Which tube stations are available in or near London, Newham London Borough?
Some of the tube stations available in or near London, Newham London Borough are Upton Park, Plaistow and West Ham.
Property Price Paid in London, Newham London Borough by Year
The average sold property price by year was:
| Year | Average Sold Price | Price Change |
Sold Properties
|
|---|---|---|---|
| 2025 | £433,498 | 0,4% |
1,549 Properties |
| 2024 | £431,953 | 1% |
2,041 Properties |
| 2023 | £427,537 | -3% |
1,828 Properties |
| 2022 | £440,166 | 5% |
2,261 Properties |
| 2021 | £419,399 | 3% |
2,689 Properties |
| 2020 | £406,158 | -10% |
1,950 Properties |
| 2019 | £448,698 | 4% |
3,302 Properties |
| 2018 | £431,453 | 7% |
3,877 Properties |
| 2017 | £400,545 | 8% |
4,520 Properties |
| 2016 | £368,306 | 16% |
3,288 Properties |
| 2015 | £309,540 | 14% |
3,415 Properties |
| 2014 | £266,582 | 13% |
3,222 Properties |
| 2013 | £231,902 | 6% |
2,427 Properties |
| 2012 | £218,925 | 2% |
1,709 Properties |
| 2011 | £214,899 | -2% |
1,617 Properties |
| 2010 | £219,947 | 6% |
1,692 Properties |
| 2009 | £206,424 | -18% |
1,411 Properties |
| 2008 | £243,163 | 5% |
2,700 Properties |
| 2007 | £230,947 | 8% |
4,395 Properties |
| 2006 | £211,909 | 4% |
4,486 Properties |
| 2005 | £203,377 | 6% |
3,941 Properties |
| 2004 | £191,578 | 7% |
4,472 Properties |
| 2003 | £178,082 | 18% |
5,280 Properties |
| 2002 | £145,637 | 19% |
5,570 Properties |
| 2001 | £117,262 | 17% |
5,527 Properties |
| 2000 | £97,278 | 23% |
4,903 Properties |
| 1999 | £75,326 | 13% |
4,418 Properties |
| 1998 | £65,285 | 12% |
4,035 Properties |
| 1997 | £57,420 | 13% |
3,818 Properties |
| 1996 | £50,086 | 5% |
3,401 Properties |
| 1995 | £47,541 | - |
2,970 Properties |
Property Price per Property Type in London, Newham London Borough
Here you can find historic sold price data in order to help with your property search.
The average Property Paid Price for specific property types in the last three years are:
| Property Type | Average Sold Price | Sold Properties |
|---|---|---|
| Semi Detached House | £535,993.00 | 161 Semi Detached Houses |
| Terraced House | £479,739.00 | 2,704 Terraced Houses |
| Detached House | £691,653.00 | 26 Detached Houses |
| Flat | £369,273.00 | 2,527 Flats |

