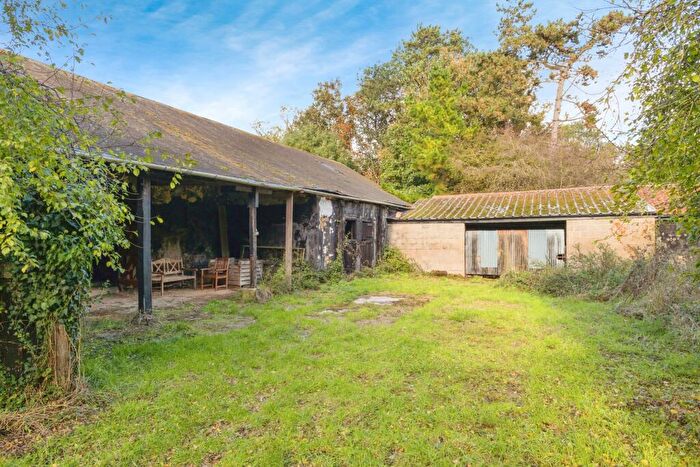
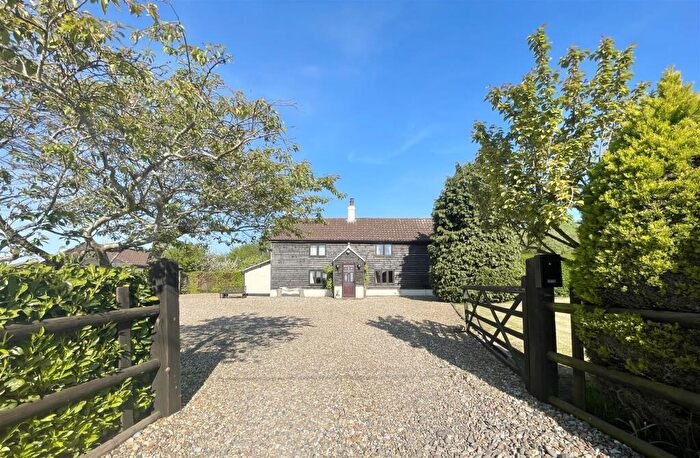
Houses for sale & to rent in All Saints, Attleborough
House Prices in All Saints
Properties in All Saints have an average house price of £433,861.00 and had 96 Property Transactions within the last 3 years¹.
All Saints is an area in Attleborough, Norfolk with 800 households², where the most expensive property was sold for £1,385,000.00.
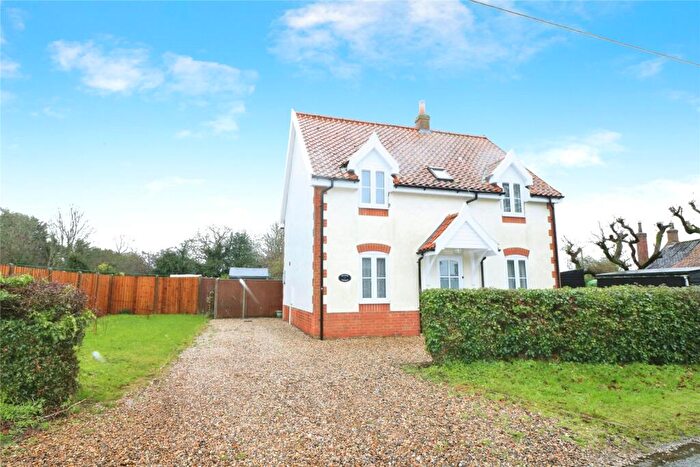
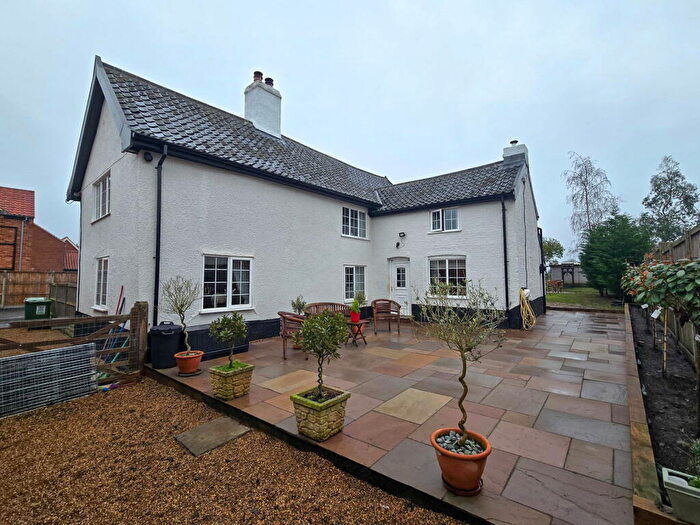
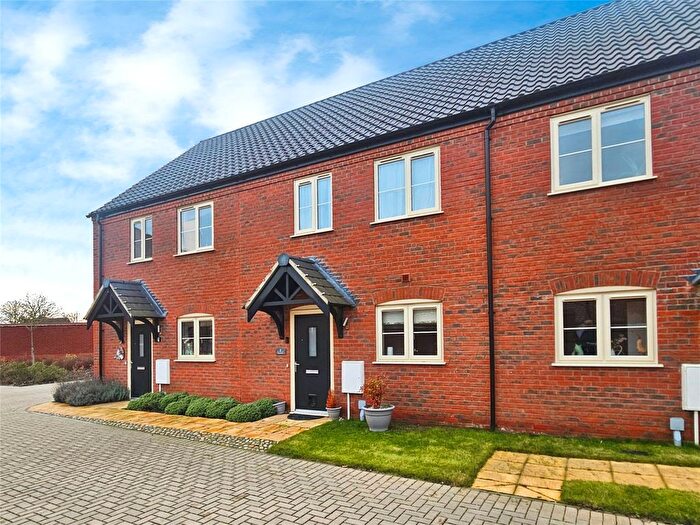
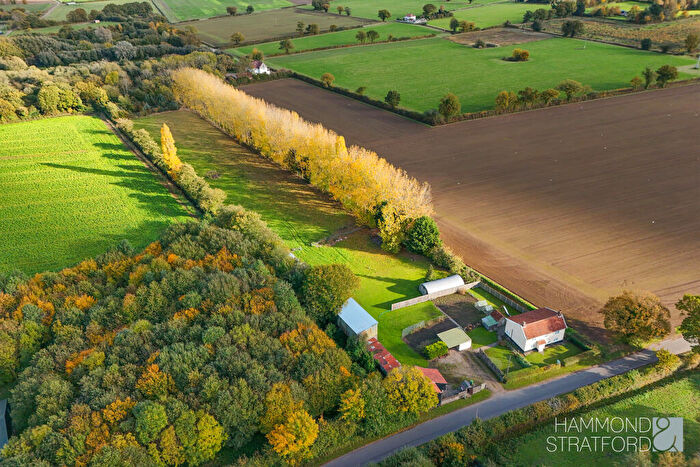
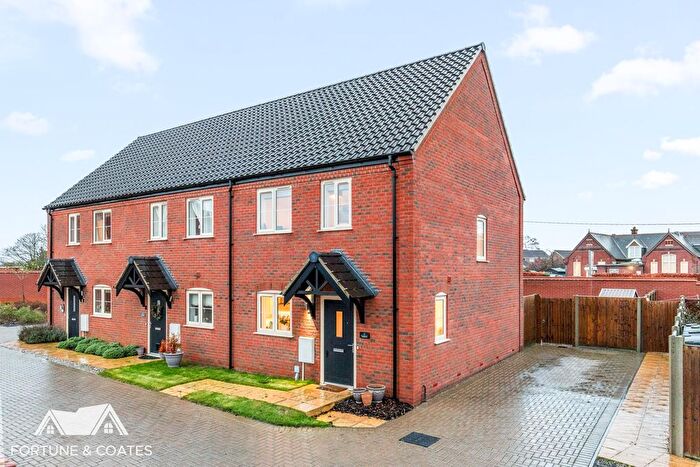
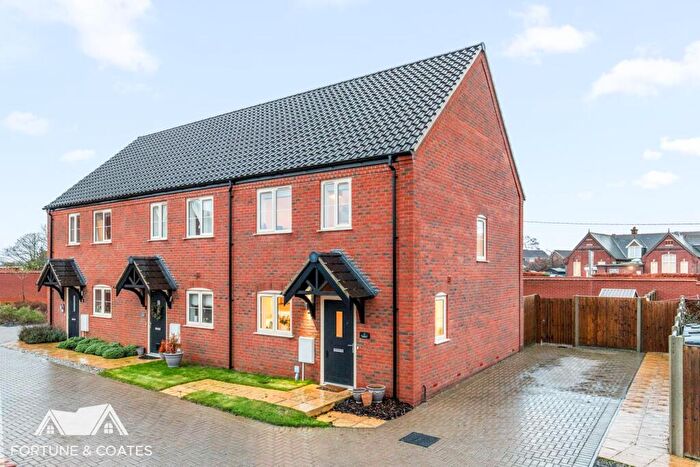
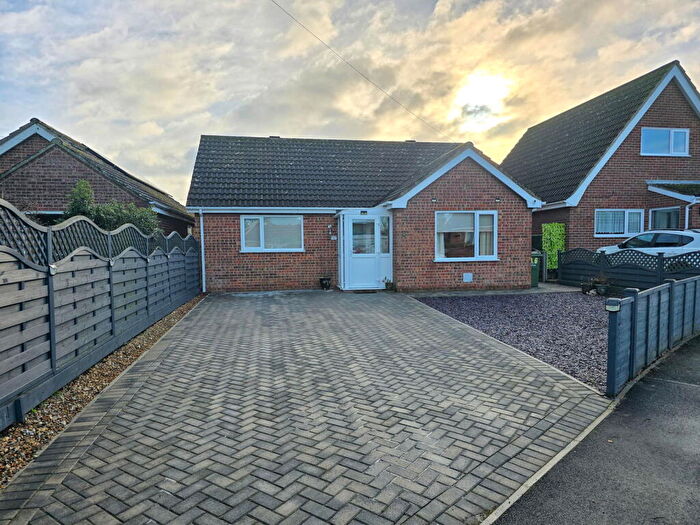
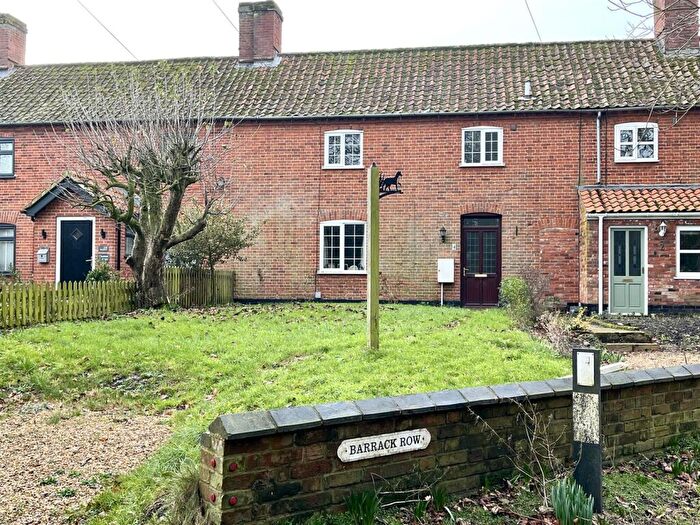
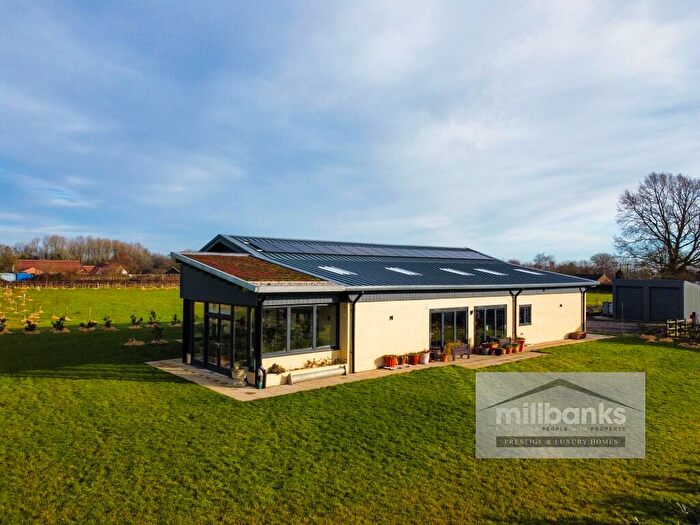
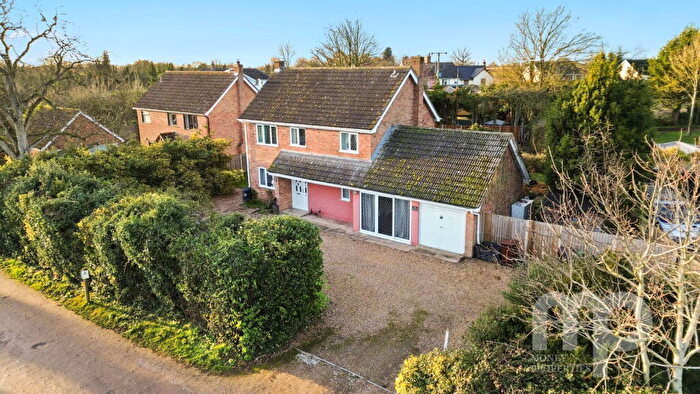
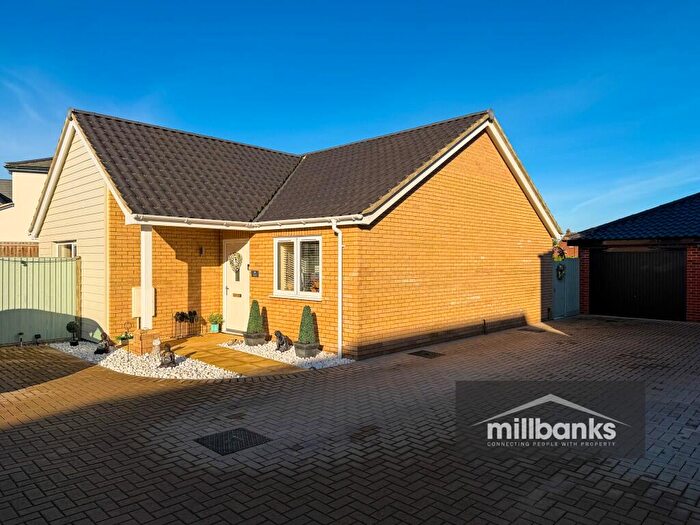
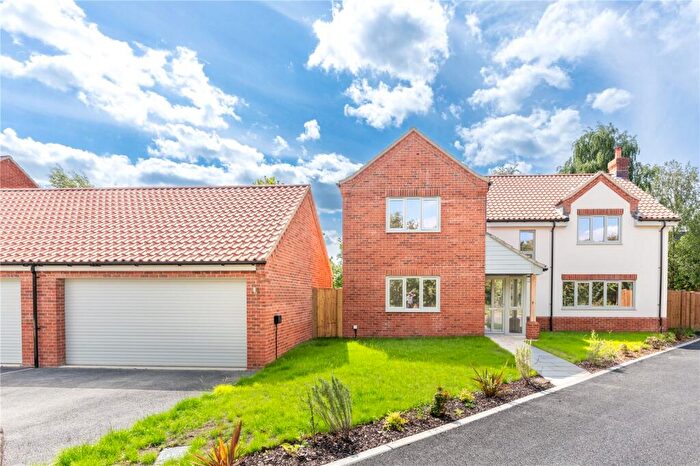
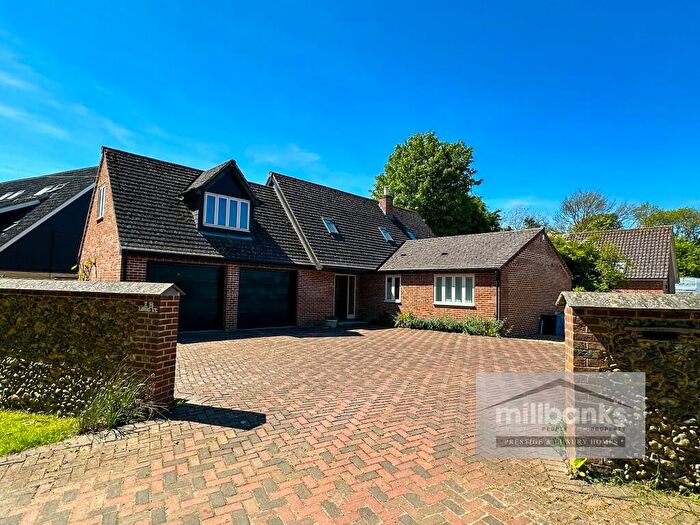
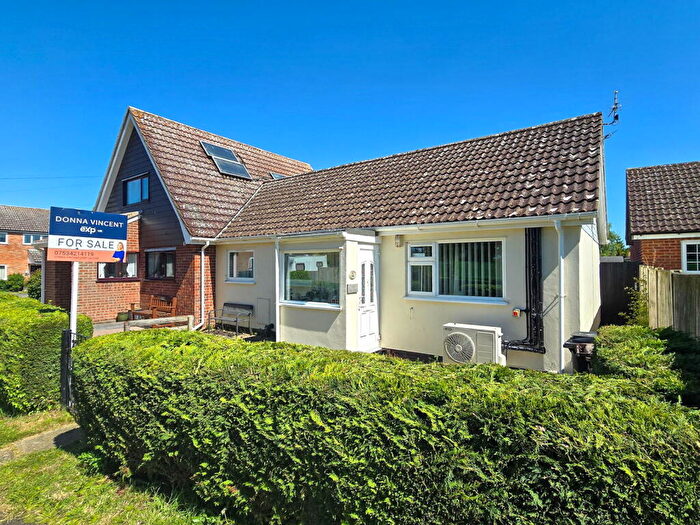
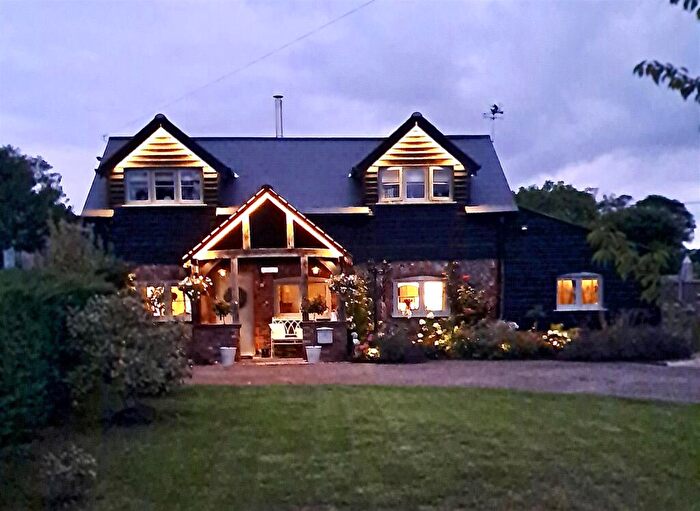
Properties for sale in All Saints
Roads and Postcodes in All Saints
Navigate through our locations to find the location of your next house in All Saints, Attleborough for sale or to rent.
| Streets | Postcodes |
|---|---|
| Anchor Corner | NR17 1JX |
| Attleborough Road | NR17 1JH NR17 1LF NR17 1LG NR17 1LQ NR17 1UE NR17 1UG |
| Barrack Row | NR17 1JJ |
| Bell Road | NR17 1UL |
| Bow Street | NR17 1JA NR17 1JB |
| Bush Green | NR17 1AG NR17 1AQ |
| Chapel Street | NR17 1UJ |
| Chequers Green Road | NR17 1HU |
| Chequers Lane | NR17 1HR NR17 1HS |
| Church Avenue | NR17 1JL |
| Church Road | NR17 1JN |
| Church Street | NR17 1LE |
| Crown Lane | NR17 1JS |
| Deopham Road | NR17 1LJ |
| Fen Street | NR17 1XE |
| Flymoor Lane | NR17 1BP |
| Goose Common | NR17 1JU |
| Green Lane | NR17 1UA |
| Hingham Road | NR17 1HX NR17 1HY NR17 1JD NR17 1JG |
| Home Close | NR17 1HW |
| Long Street | NR17 1LL NR17 1LN NR17 1LW |
| Low Lane | NR17 1TU |
| Magpie Lane | NR17 1UU |
| Mill Lane | NR17 1HT NR17 1TX NR17 1XR |
| Mount Pleasant | NR17 1XG NR17 1XQ |
| Nelsons Loke | NR17 1HG |
| Penhill Road | NR17 1LR NR17 1LS |
| Poplar Lane | NR17 1JT |
| Rectory Lane | NR17 1LD |
| Rectory Road | NR17 1XA NR17 1XD |
| Sandy Lane | NR17 1EN |
| Scoulton Road | NR17 1UW |
| St Peters Close | NR17 1UQ |
| Stalland Common | NR17 1JF |
| Swamp Lane | NR17 1LH |
| The Green | NR17 1LT |
| The Street | NR17 1TP NR17 1TR NR17 1TT NR17 1UX |
| The Woodcutters | NR17 1HQ |
| Thieves Lane | NR17 1UH |
| Town Green | NR17 1LP |
| Watton Road | NR17 1HZ NR17 1LA NR17 1LB |
| Wood Lane | NR17 1JZ |
| NR17 1JW NR17 1XN NR17 1XW |
Transport near All Saints
- FAQ
- Price Paid By Year
- Property Type Price
Frequently asked questions about All Saints
What is the average price for a property for sale in All Saints?
The average price for a property for sale in All Saints is £433,861. This amount is 35% higher than the average price in Attleborough. There are 365 property listings for sale in All Saints.
What streets have the most expensive properties for sale in All Saints?
The streets with the most expensive properties for sale in All Saints are Deopham Road at an average of £1,237,500, Mount Pleasant at an average of £1,020,000 and Penhill Road at an average of £985,000.
What streets have the most affordable properties for sale in All Saints?
The streets with the most affordable properties for sale in All Saints are Rectory Road at an average of £205,000, Church Avenue at an average of £229,600 and Rectory Lane at an average of £237,166.
Which train stations are available in or near All Saints?
Some of the train stations available in or near All Saints are Attleborough, Eccles Road and Spooner Row.
Property Price Paid in All Saints by Year
The average sold property price by year was:
| Year | Average Sold Price | Price Change |
Sold Properties
|
|---|---|---|---|
| 2025 | £490,499 | 21% |
28 Properties |
| 2024 | £388,014 | -12% |
34 Properties |
| 2023 | £433,064 | 1% |
34 Properties |
| 2022 | £430,032 | -1% |
25 Properties |
| 2021 | £432,846 | 21% |
49 Properties |
| 2020 | £343,753 | 6% |
33 Properties |
| 2019 | £322,423 | -23% |
26 Properties |
| 2018 | £395,196 | 20% |
33 Properties |
| 2017 | £315,360 | -9% |
25 Properties |
| 2016 | £343,000 | 14% |
28 Properties |
| 2015 | £295,874 | 11% |
40 Properties |
| 2014 | £264,603 | 9% |
38 Properties |
| 2013 | £240,079 | -6% |
36 Properties |
| 2012 | £255,295 | 14% |
22 Properties |
| 2011 | £220,082 | -23% |
29 Properties |
| 2010 | £270,125 | 13% |
16 Properties |
| 2009 | £234,991 | -2% |
21 Properties |
| 2008 | £239,267 | -7% |
31 Properties |
| 2007 | £255,633 | -3% |
39 Properties |
| 2006 | £262,309 | -0,4% |
41 Properties |
| 2005 | £263,434 | 5% |
32 Properties |
| 2004 | £251,396 | 6% |
33 Properties |
| 2003 | £236,464 | 37% |
42 Properties |
| 2002 | £148,922 | 16% |
40 Properties |
| 2001 | £125,092 | 14% |
32 Properties |
| 2000 | £107,617 | 13% |
31 Properties |
| 1999 | £93,643 | 15% |
44 Properties |
| 1998 | £79,491 | 4% |
24 Properties |
| 1997 | £76,319 | 17% |
39 Properties |
| 1996 | £63,263 | -20% |
30 Properties |
| 1995 | £75,685 | - |
24 Properties |
Property Price per Property Type in All Saints
Here you can find historic sold price data in order to help with your property search.
The average Property Paid Price for specific property types in the last three years are:
| Property Type | Average Sold Price | Sold Properties |
|---|---|---|
| Semi Detached House | £257,375.00 | 28 Semi Detached Houses |
| Detached House | £530,374.00 | 62 Detached Houses |
| Terraced House | £260,166.00 | 6 Terraced Houses |

