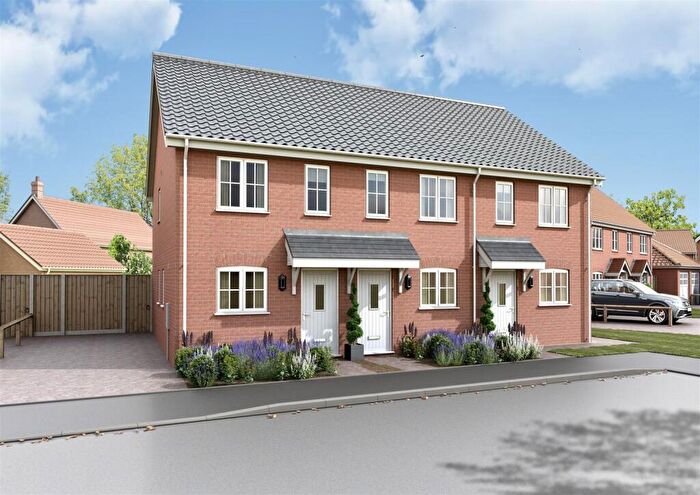
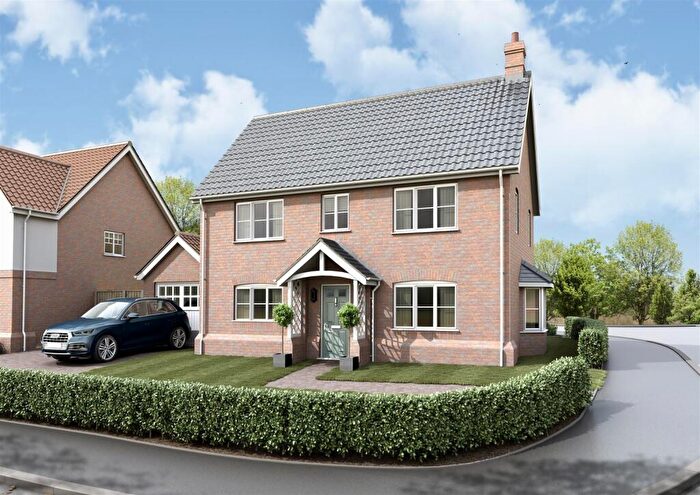
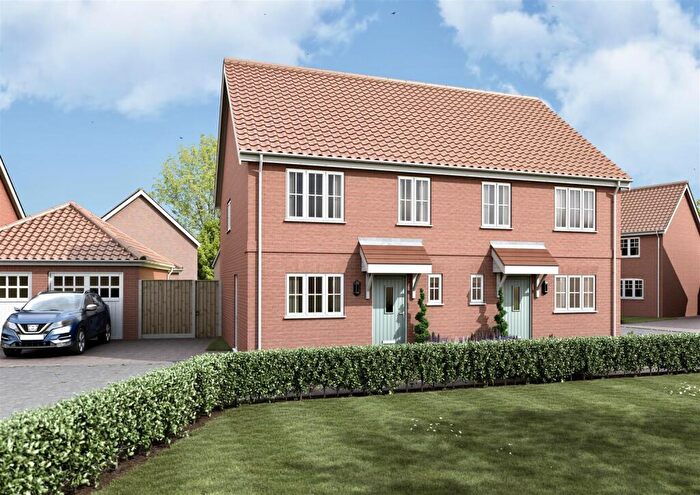
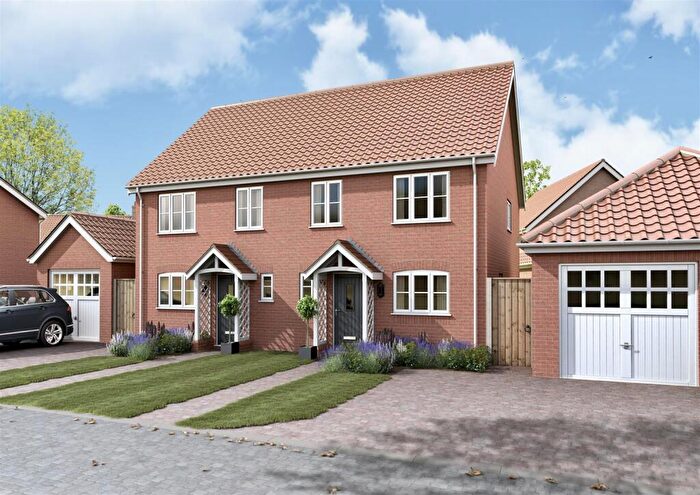
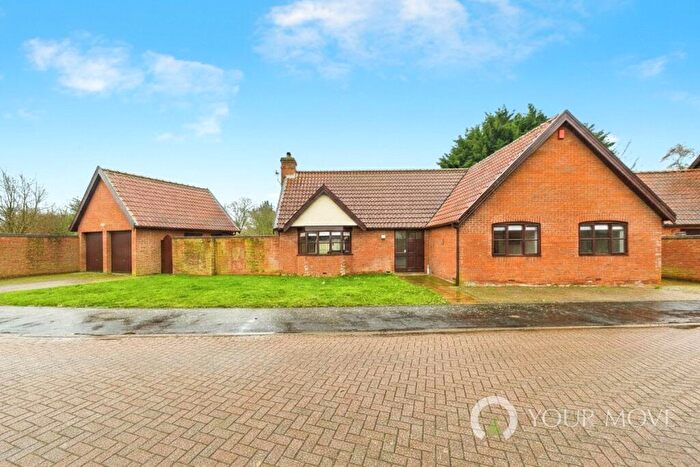
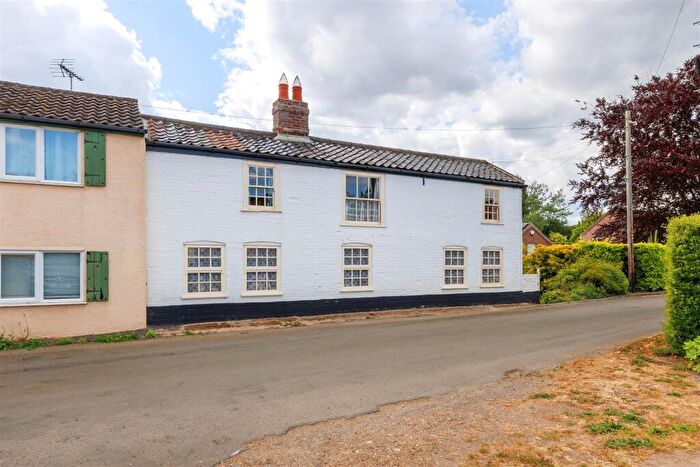
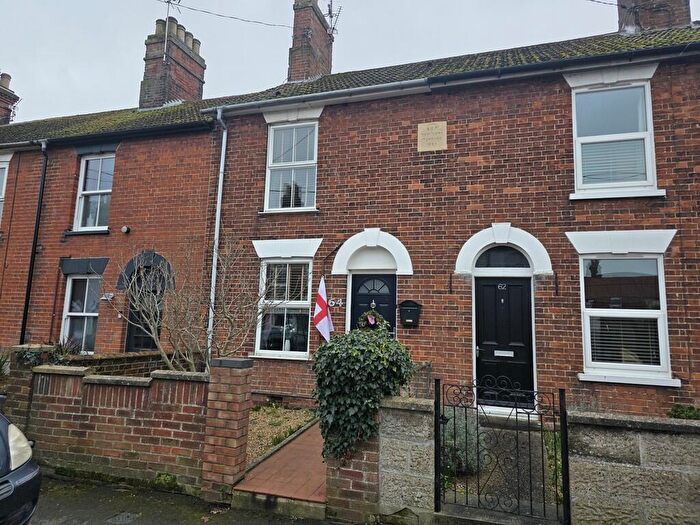
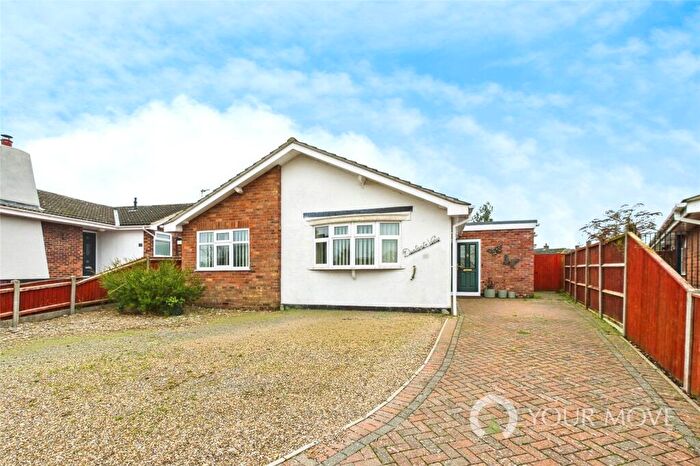
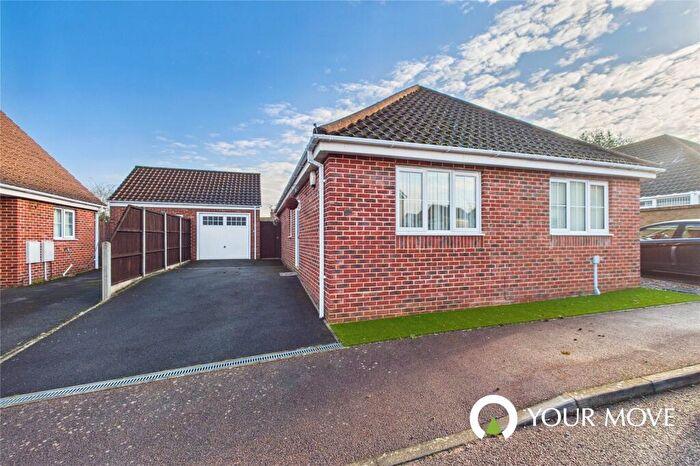
Houses for sale & to rent in Thurlton, Beccles
House Prices in Thurlton
Properties in Thurlton have an average house price of £419,363.00 and had 32 Property Transactions within the last 3 years¹.
Thurlton is an area in Beccles, Norfolk with 492 households², where the most expensive property was sold for £800,000.00.
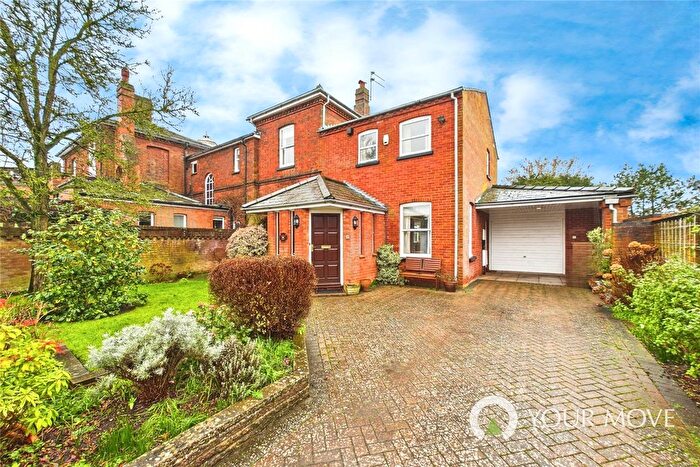
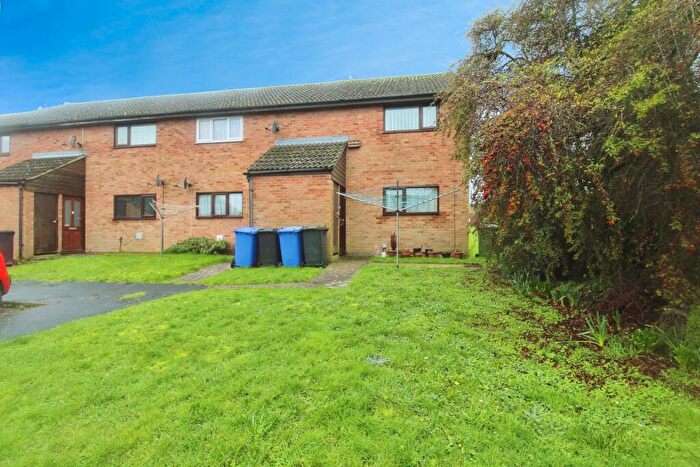
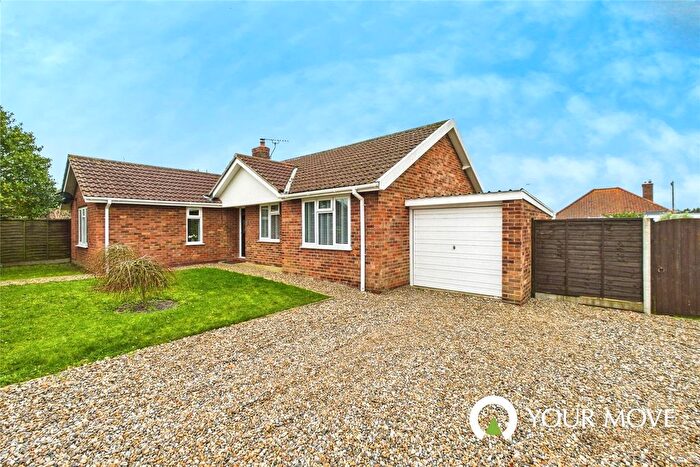
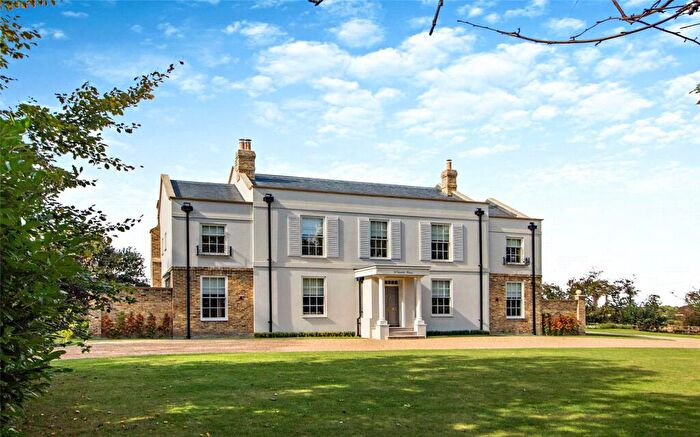
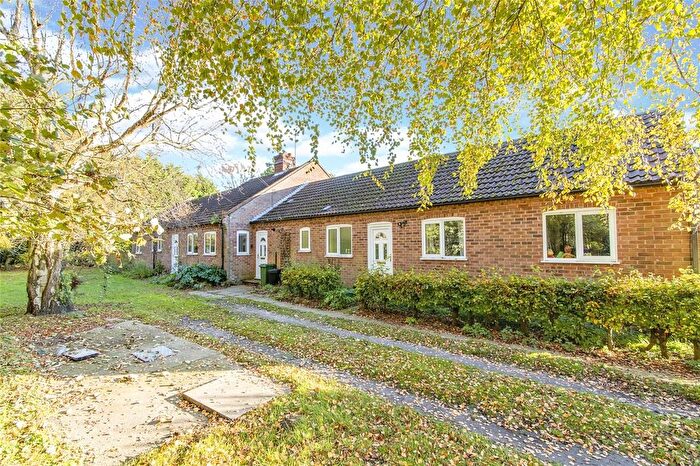
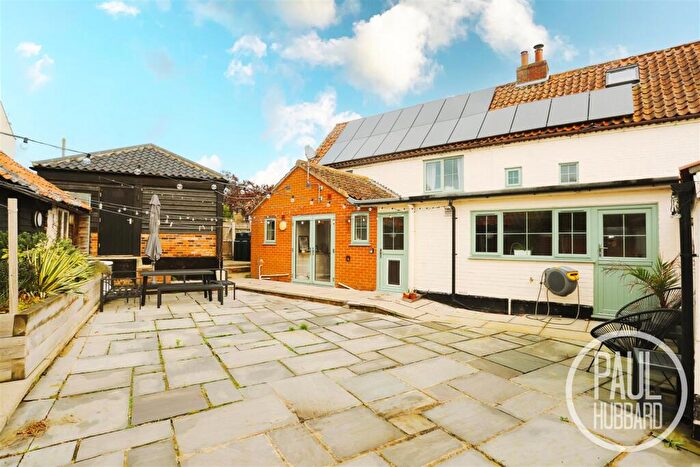
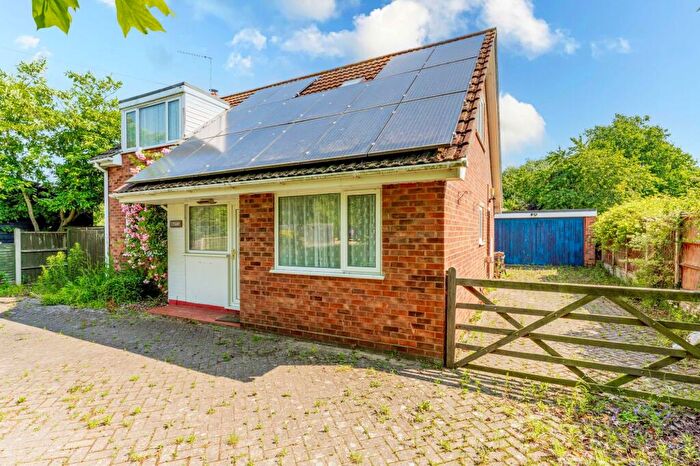
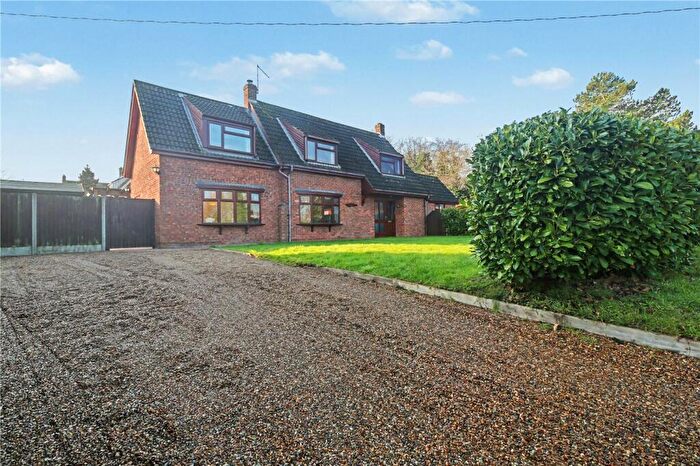
Properties for sale in Thurlton
Roads and Postcodes in Thurlton
Navigate through our locations to find the location of your next house in Thurlton, Beccles for sale or to rent.
| Streets | Postcodes |
|---|---|
| Beccles Road | NR34 0AA NR34 0AW NR34 0BS NR34 0EA NR34 0EQ |
| Bulls Green | NR34 0HA |
| Bulls Green Lane | NR34 0FR |
| Bulls Green Road | NR34 0DR |
| Burgh Road | NR34 0AD NR34 0BZ |
| Burrow Green | NR34 0DH |
| Church Lane | NR34 0AU NR34 0DG NR34 0DD |
| Church Road | NR34 0AR NR34 0AZ NR34 0ET |
| College Farm Cottages | NR34 0BD |
| Common Road | NR34 0BL |
| Crimp Cramp Lane | NR34 0BQ |
| Daisy Way | NR34 0HX |
| Dicks Mount | NR34 0BU |
| Dun Cow Road | NR34 0BE |
| East End Lane | NR34 0BF |
| Elms Road | NR34 0EJ |
| Fields Road | NR34 0EN |
| Fullers Close | NR34 0DN |
| Greys Cottages | NR34 0BB |
| Haddiscoe Road | NR34 0BX |
| Hollow Way Road | NR34 0AH |
| Kenyon Row | NR34 0AQ |
| Lily Lane | NR34 0BP |
| Loddon Road | NR34 0EU |
| Mardle Road | NR34 0ER |
| Maypole Green | NR34 0EY |
| Mill Road | NR34 0BA |
| New Road | NR34 0JW |
| Oaks Lane | NR34 0AX |
| Pit Road | NR34 0BG |
| Post Office Road | NR34 0EH |
| Pound Lane | NR34 0EX |
| Priory Lane | NR34 0EZ |
| Raveningham Road | NR34 0HB |
| Rectory Road | NR34 0BJ |
| St Benedicts Close | NR34 0HN |
| St Marys Road | NR34 0BH |
| St Marys Row | NR34 0AL |
| Staithe Road | NR34 0BN NR34 0BT NR34 0DE |
| Station Road | NR34 0BY NR34 0AS |
| Taylors Road | NR34 0RA |
| The Street | NR34 0AB |
| The Walks | NR34 0AY |
| Town Houses | NR34 0ES |
| Tulip Close | NR34 0HY |
| Wash Lane | NR34 0BW |
| Waterheath Road | NR34 0DQ NR34 0EL |
| Waveney Cottages | NR34 0AN |
| Wheatacre Marshes | NR34 0DL |
| Wood Lane | NR34 0DA |
| Yarmouth Road | NR34 0EP NR34 0EW |
| NR34 0AJ NR34 0AP NR34 0DB NR34 0AT NR34 0ED |
Transport near Thurlton
- FAQ
- Price Paid By Year
- Property Type Price
Frequently asked questions about Thurlton
What is the average price for a property for sale in Thurlton?
The average price for a property for sale in Thurlton is £419,363. This amount is 14% higher than the average price in Beccles. There are 887 property listings for sale in Thurlton.
What streets have the most expensive properties for sale in Thurlton?
The streets with the most expensive properties for sale in Thurlton are Burrow Green at an average of £675,000, Yarmouth Road at an average of £544,375 and Pound Lane at an average of £530,000.
What streets have the most affordable properties for sale in Thurlton?
The streets with the most affordable properties for sale in Thurlton are Beccles Road at an average of £260,000, Mardle Road at an average of £320,000 and Fullers Close at an average of £320,000.
Which train stations are available in or near Thurlton?
Some of the train stations available in or near Thurlton are Somerleyton, Beccles and Haddiscoe.
Property Price Paid in Thurlton by Year
The average sold property price by year was:
| Year | Average Sold Price | Price Change |
Sold Properties
|
|---|---|---|---|
| 2025 | £419,086 | 7% |
13 Properties |
| 2024 | £391,107 | -28% |
14 Properties |
| 2023 | £499,200 | 19% |
5 Properties |
| 2022 | £402,647 | -2% |
17 Properties |
| 2021 | £411,520 | 15% |
24 Properties |
| 2020 | £350,708 | 12% |
12 Properties |
| 2019 | £309,000 | -51% |
13 Properties |
| 2018 | £467,229 | 31% |
12 Properties |
| 2017 | £320,469 | 10% |
18 Properties |
| 2016 | £289,031 | 10% |
16 Properties |
| 2015 | £260,195 | -27% |
10 Properties |
| 2014 | £329,458 | 26% |
24 Properties |
| 2013 | £243,063 | -1% |
15 Properties |
| 2012 | £244,733 | -14% |
15 Properties |
| 2011 | £277,812 | 17% |
16 Properties |
| 2010 | £231,181 | -9% |
11 Properties |
| 2009 | £251,428 | 14% |
7 Properties |
| 2008 | £216,754 | -30% |
12 Properties |
| 2007 | £282,283 | 3% |
21 Properties |
| 2006 | £273,340 | 17% |
26 Properties |
| 2005 | £227,903 | 14% |
16 Properties |
| 2004 | £196,313 | -21% |
11 Properties |
| 2003 | £237,687 | 24% |
28 Properties |
| 2002 | £181,592 | 14% |
18 Properties |
| 2001 | £156,875 | -36% |
12 Properties |
| 2000 | £213,375 | 54% |
20 Properties |
| 1999 | £98,354 | 12% |
21 Properties |
| 1998 | £86,454 | -16% |
24 Properties |
| 1997 | £100,322 | 10% |
17 Properties |
| 1996 | £90,690 | 7% |
10 Properties |
| 1995 | £84,214 | - |
7 Properties |
Property Price per Property Type in Thurlton
Here you can find historic sold price data in order to help with your property search.
The average Property Paid Price for specific property types in the last three years are:
| Property Type | Average Sold Price | Sold Properties |
|---|---|---|
| Semi Detached House | £343,240.00 | 8 Semi Detached Houses |
| Detached House | £443,204.00 | 23 Detached Houses |
| Terraced House | £480,000.00 | 1 Terraced House |


