
Houses for sale in Thurlton, Norwich
House Prices in Thurlton
Properties in Thurlton have an average house price of £355k and had 48 Property Transactions within the last 3 years¹.
Thurlton is an area in Norwich, Norfolk with 658 households², where the most expensive property was sold for £1.13M.
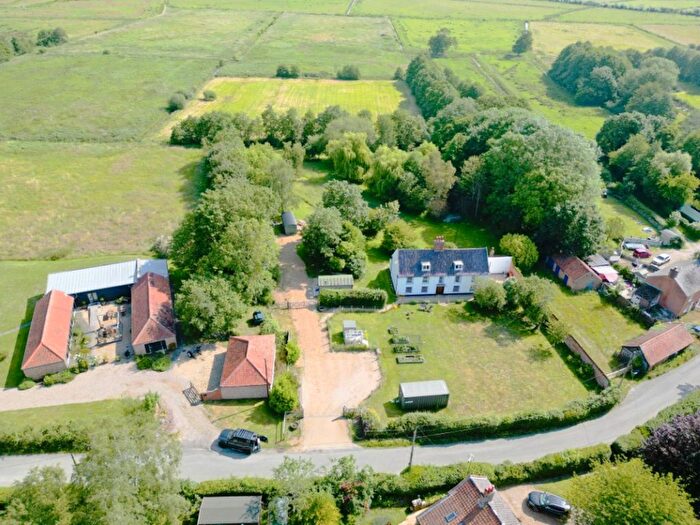
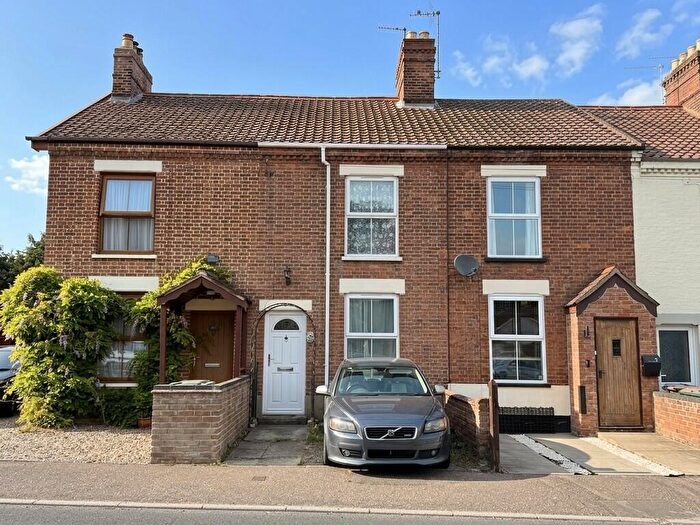
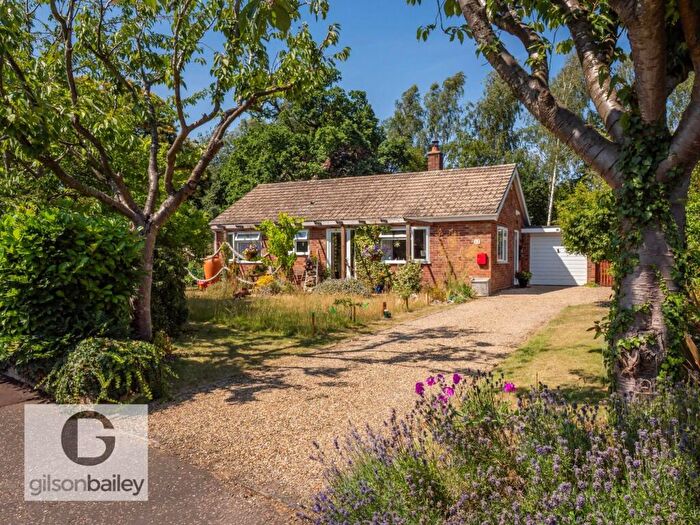
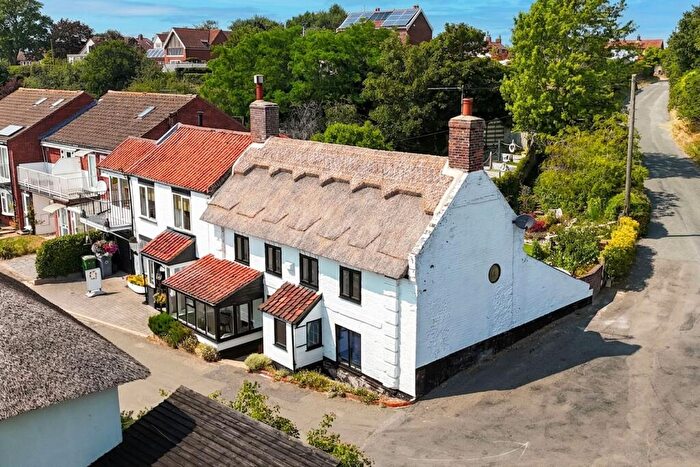
Properties for sale in Thurlton
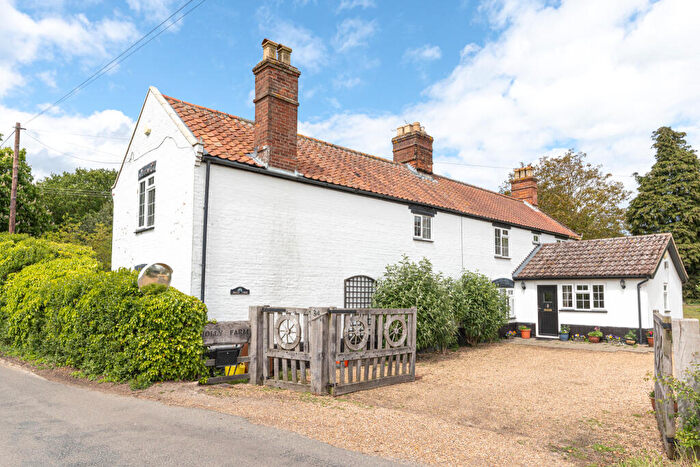
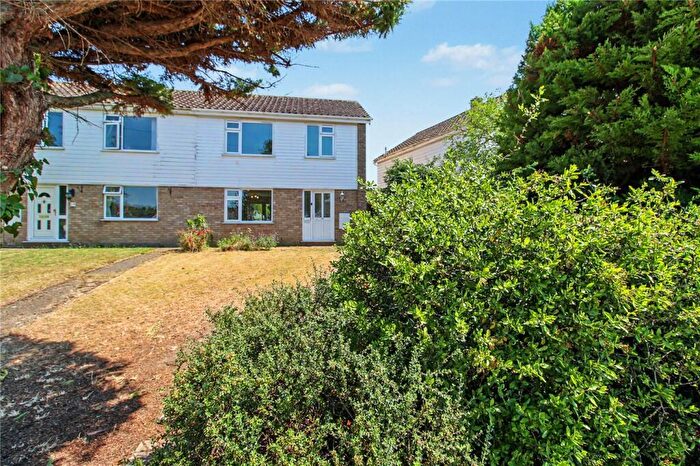
![]()
If you are looking to sell your house, let it out, or receive a property valuation, an expert can help you.
Click the button below to get started.
Roads and Postcodes in Thurlton
Navigate through our locations to find the location of your next house in Thurlton, Norwich for sale or to rent.
| Streets | Postcodes |
|---|---|
| Aldeby Road | NR14 6PH NR14 6PQ |
| Beccles Road | NR14 6AJ NR14 6QY NR14 6RE NR14 6RJ |
| Blacksmiths Gardens | NR14 6GJ |
| Church Hill | NR14 6PF |
| Church Lane | NR14 6PB |
| Church Road | NR14 6SJ NR14 6RN |
| College Road | NR14 6QZ |
| Council Houses | NR14 6PD |
| Croft Road | NR14 6RB |
| Crossway Farm Cottages | NR14 6NZ |
| Ferry Road | NR14 6SF |
| Gravel Pit Lane | NR14 6PS |
| Hall Estate | NR14 6PE |
| Hampton Avenue | NR14 6RH |
| Links Close | NR14 6RG |
| Links Way | NR14 6RF |
| Loddon Road | NR14 6RT |
| Low Road | NR14 6PJ NR14 6PZ NR14 6QD NR14 6RL NR14 6RZ NR14 6SA NR14 6SD |
| Meadow Close | NR14 6RQ |
| Mill Lane | NR14 6PA NR14 6PX |
| Mill Road | NR14 6QE |
| Mock Mile Terrace | NR14 6PL |
| Nogdam End | NR14 6SE |
| Norman Close | NR14 6SH |
| Priory Cottages | NR14 6QA |
| Queens Head Close | NR14 6TE |
| Rectory Lane | NR14 6NJ |
| Rectory Road | NR14 6PG |
| Sandy Lane | NR14 6QX |
| Slip Road | NR14 6QB |
| The Loke | NR14 6PR |
| The Street | NR14 6AA NR14 6PN NR14 6RP NR14 6RR NR14 6RS |
| Thorpe Road | NR14 6PP NR14 6PW NR14 6QQ |
| Tithebarn Lane | NR14 6RW |
| Yarmouth Road | NR14 6PU |
| NR13 3UB NR14 6PT NR14 6PY |
Property price trends in Thurlton
According to the latest Land Registry data, the average home in Thurlton sold for £244,666 in 2026. That figure comes from 721 sales logged over the past 31 years.
Prices have fallen back over the last three years. Compared with 2023, when the typical sale came in around £451,235, that's a fall of roughly 45.8%.
Looking back five years, average prices are down about 20.4% since 2021, a drop of around £62,808 in cash terms.
Zoom out to the past decade for the fuller picture. Back in 2016, homes here averaged £213,333, so the typical sold price has climbed about 14.7% since then, roughly 1.4% a year. Stretch the view to fifteen years and that annual pace edges up closer to 2.2%.
Frequently asked questions about Thurlton
What is the average price for a property for sale in Thurlton?
The average price for a property for sale in Thurlton is £355,489. This amount is 15% higher than the average price in Norwich. There are 364 property listings for sale in Thurlton.
What streets have the most expensive properties for sale in Thurlton?
The streets with the most expensive properties for sale in Thurlton are Slip Road at an average of £580,000, Low Road at an average of £433,555 and Thorpe Road at an average of £403,750.
What streets have the most affordable properties for sale in Thurlton?
The streets with the most affordable properties for sale in Thurlton are Meadow Close at an average of £212,500, Links Way at an average of £234,916 and Norman Close at an average of £240,000.
Which train stations are available in or near Thurlton?
Some of the train stations available in or near Thurlton are Haddiscoe, Reedham (Norfolk) and Somerleyton.
Property Price Paid in Thurlton by Year
The average sold property price by year was:
| Year | Average Sold Price | Price Change |
Sold Properties
|
|---|---|---|---|
| 2026 | £244,666 | -18% |
3 Properties |
| 2025 | £288,192 | -14% |
13 Properties |
| 2024 | £327,466 | -38% |
15 Properties |
| 2023 | £451,235 | 7% |
17 Properties |
| 2022 | £418,550 | 27% |
20 Properties |
| 2021 | £307,474 | 6% |
22 Properties |
| 2020 | £289,745 | -3% |
22 Properties |
| 2019 | £298,741 | 2% |
37 Properties |
| 2018 | £292,571 | 19% |
21 Properties |
| 2017 | £237,456 | 10% |
24 Properties |
Property Price per Property Type in Thurlton
Here you can find historic sold price data in order to help with your property search.
The average Property Paid Price for specific property types in the last three years are:
| Property Type | Average Sold Price | Sold Properties |
|---|---|---|
| Semi Detached House | £245,066.00 | 15 Semi Detached Houses |
| Detached House | £437,089.00 | 28 Detached Houses |
| Terraced House | £229,800.00 | 5 Terraced Houses |
