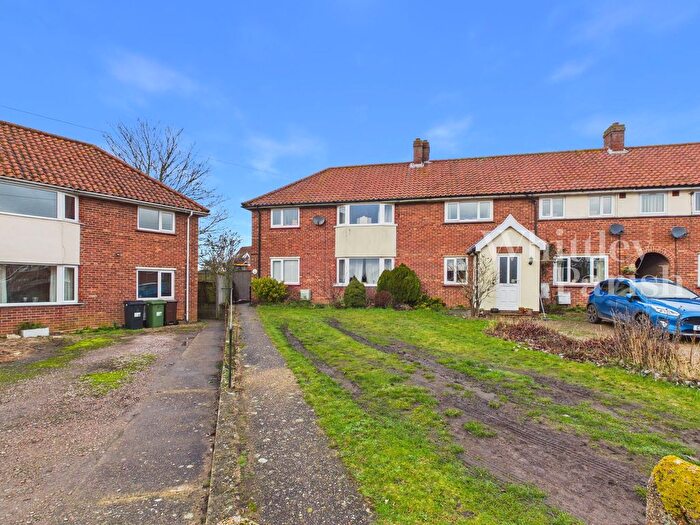
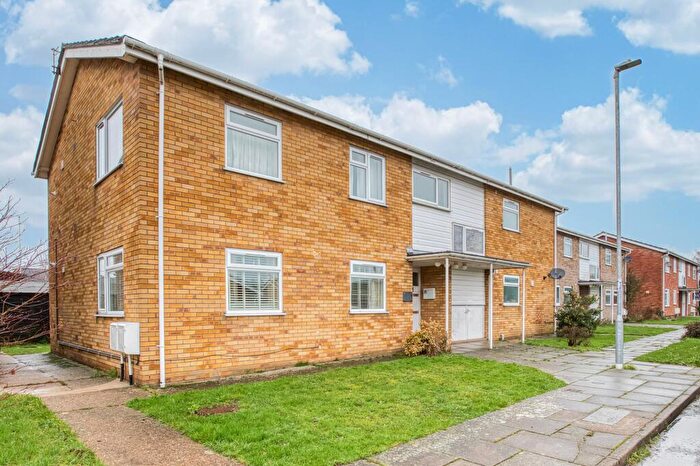
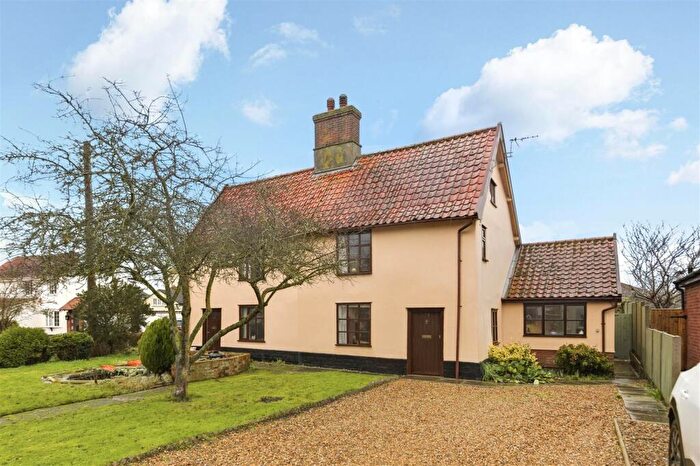
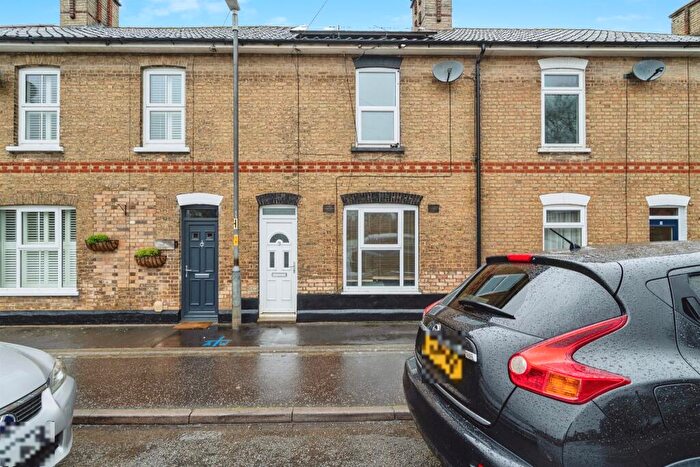
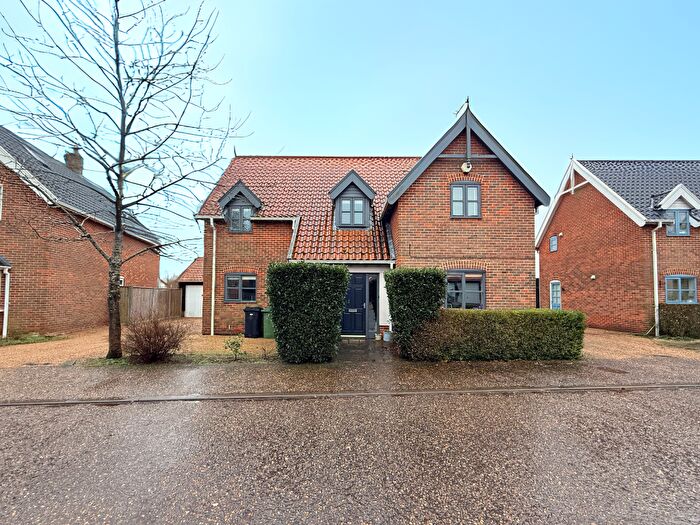
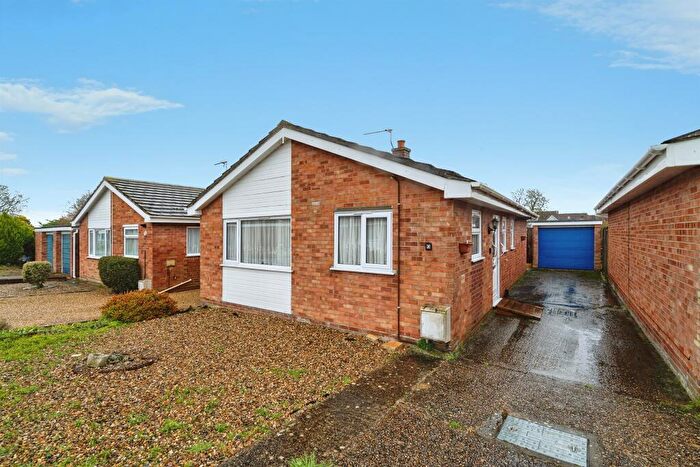
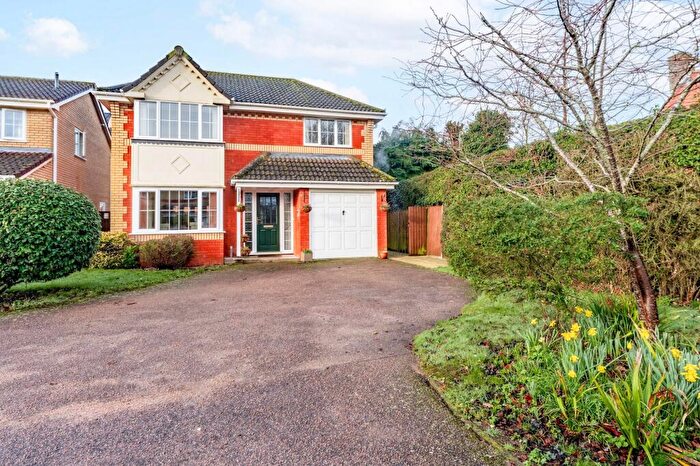
Houses for sale & to rent in Bressingham And Burston, Diss
House Prices in Bressingham And Burston
Properties in Bressingham And Burston have an average house price of £436,788.00 and had 60 Property Transactions within the last 3 years¹.
Bressingham And Burston is an area in Diss, Norfolk with 1,010 households², where the most expensive property was sold for £850,000.00.
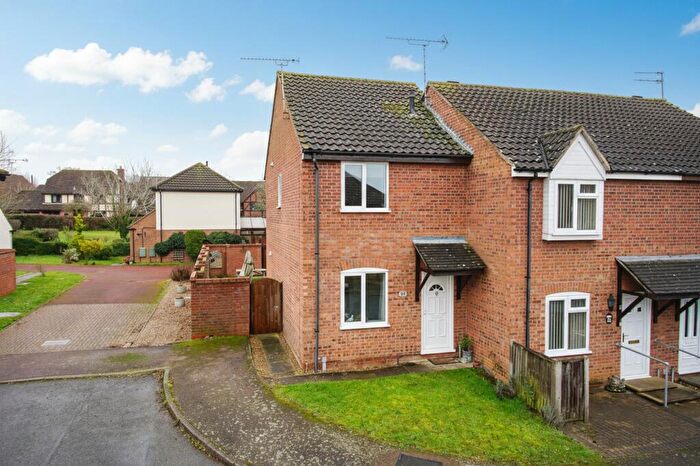
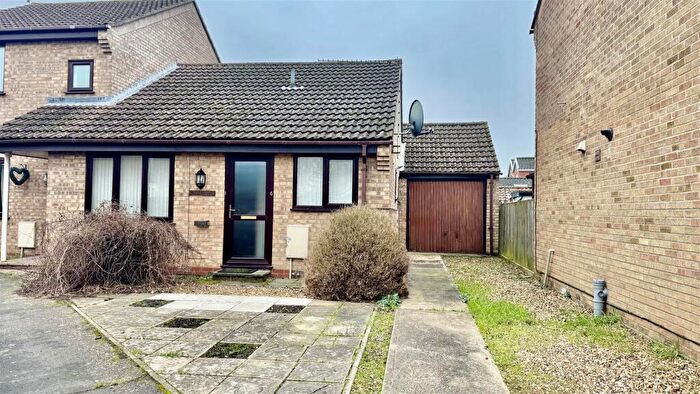
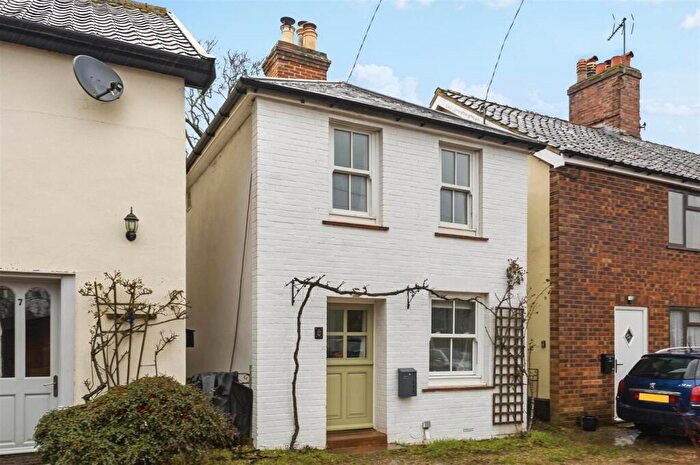
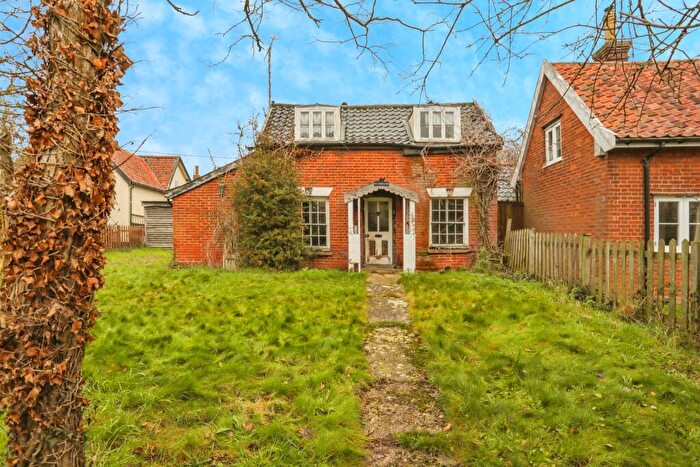
Properties for sale in Bressingham And Burston
Roads and Postcodes in Bressingham And Burston
Navigate through our locations to find the location of your next house in Bressingham And Burston, Diss for sale or to rent.
| Streets | Postcodes |
|---|---|
| Algar Road | IP22 2BQ |
| Audley End | IP22 5TX IP22 5TY |
| Back Heywood Road | IP22 5TE |
| Back Lane | IP22 5PF IP22 5TT |
| Bates Lane | IP22 2FB |
| Bressingham Road | IP22 5XW |
| Bridge Rise | IP22 5UP |
| Bridge Road | IP22 5TH |
| Burston Road | IP21 4UB IP22 5SX IP22 5UF |
| Chequers Lane | IP22 2AF IP22 5TL |
| Church Lane | IP22 2AE IP22 2EA |
| Church Road | IP22 2DG |
| Church Walk | IP22 2DU |
| Common Road | IP22 2AX IP22 2AY IP22 2AZ IP22 2BB IP22 2BD IP22 2DL IP22 2DP IP22 2DR IP22 2HD IP22 5UR |
| Crown Green | IP22 5TZ |
| Diamond Close | IP22 2EW |
| Dickleburgh Road | IP21 4UF IP21 4UJ |
| Diss Road | IP22 2DD IP22 2DX IP22 5TP IP22 5TS |
| Dog Lane | IP22 2HA |
| Druids Lane | IP22 2DW |
| Druids Lane Cottages | IP22 2DN |
| Durbidges Hill | IP22 5SY |
| Fen Street | IP22 2AQ |
| Fersfield Road | IP22 2AP IP22 2AW |
| Gissing Road | IP22 5UD |
| Goose Green | IP22 2ER |
| Goose Green Lane | IP22 2ET |
| Halford Lane | IP22 2AH |
| Hall Green | IP22 5UY |
| Hall Lane | IP21 4UH IP22 2BH IP22 2DE |
| Hall Road | IP22 2EJ IP22 2EP |
| Heath Road | IP22 2EU |
| Heywood Road | IP22 2DJ |
| Higdon Close | IP22 5UG |
| High London Lane | IP22 2EF IP22 2EG IP22 2FD |
| High Road | IP22 2AT IP22 2AU IP22 5XN |
| Lodge Lane | IP22 2BE |
| Long Lane | IP22 5UQ |
| Low Common | IP21 4UL |
| Low Road | IP22 2AA IP22 2AG |
| Lower Street | IP22 5UH IP22 5UJ |
| Market Lane | IP22 5TR |
| Mile Road | IP22 2EZ |
| Mill Green | IP22 5TG IP22 5TJ IP22 5TQ |
| Mill Road | IP22 2DZ IP22 5TW |
| Pug Street | IP21 4UU |
| Rectory Road | IP22 2DQ IP22 5TU IP22 5UU IP22 5UX IP22 5UZ IP22 5XB |
| School Road | IP22 2AD IP22 2AR |
| Short Green | IP22 2EE IP22 2EH |
| Station Road | IP21 4UA IP22 5UA IP22 5UB |
| Stone Lane | IP22 2BW |
| The Common | IP22 2BP |
| The Green | IP22 2DH |
| The Heywood | IP22 5TA IP22 5TB IP22 5TD |
| The Street | IP22 2BL IP22 2ED |
| Upper Street | IP22 5UN IP22 5UW |
| Valley Lane | IP21 4UE |
| Wash Lane | IP22 2DS |
| Wilney Green | IP22 2AJ |
| Winfarthing Road | IP22 2EQ |
| Wood Lane | IP22 2BN |
Transport near Bressingham And Burston
- FAQ
- Price Paid By Year
- Property Type Price
Frequently asked questions about Bressingham And Burston
What is the average price for a property for sale in Bressingham And Burston?
The average price for a property for sale in Bressingham And Burston is £436,788. This amount is 40% higher than the average price in Diss. There are 1,846 property listings for sale in Bressingham And Burston.
What streets have the most expensive properties for sale in Bressingham And Burston?
The streets with the most expensive properties for sale in Bressingham And Burston are Mill Green at an average of £740,000, Church Road at an average of £600,000 and Church Walk at an average of £575,000.
What streets have the most affordable properties for sale in Bressingham And Burston?
The streets with the most affordable properties for sale in Bressingham And Burston are Druids Lane at an average of £220,000, Low Road at an average of £250,000 and Burston Road at an average of £255,000.
Which train stations are available in or near Bressingham And Burston?
Some of the train stations available in or near Bressingham And Burston are Diss, Eccles Road and Attleborough.
Property Price Paid in Bressingham And Burston by Year
The average sold property price by year was:
| Year | Average Sold Price | Price Change |
Sold Properties
|
|---|---|---|---|
| 2025 | £419,105 | -4% |
19 Properties |
| 2024 | £436,754 | -3% |
14 Properties |
| 2023 | £449,250 | 14% |
27 Properties |
| 2022 | £386,202 | -11% |
26 Properties |
| 2021 | £429,140 | 11% |
47 Properties |
| 2020 | £383,457 | 12% |
33 Properties |
| 2019 | £336,274 | -11% |
24 Properties |
| 2018 | £372,125 | -1% |
20 Properties |
| 2017 | £377,067 | -1% |
37 Properties |
| 2016 | £379,583 | 14% |
42 Properties |
| 2015 | £325,387 | 10% |
36 Properties |
| 2014 | £291,876 | -9% |
49 Properties |
| 2013 | £319,563 | 4% |
23 Properties |
| 2012 | £308,300 | -9% |
20 Properties |
| 2011 | £336,674 | 32% |
20 Properties |
| 2010 | £228,887 | -15% |
33 Properties |
| 2009 | £262,836 | -5% |
34 Properties |
| 2008 | £276,817 | 1% |
26 Properties |
| 2007 | £274,073 | 2% |
42 Properties |
| 2006 | £267,338 | 7% |
51 Properties |
| 2005 | £248,198 | 3% |
42 Properties |
| 2004 | £241,247 | 24% |
33 Properties |
| 2003 | £182,291 | -4% |
36 Properties |
| 2002 | £190,263 | 23% |
39 Properties |
| 2001 | £147,182 | 10% |
52 Properties |
| 2000 | £131,755 | 23% |
47 Properties |
| 1999 | £101,505 | -3% |
53 Properties |
| 1998 | £105,029 | 20% |
32 Properties |
| 1997 | £83,945 | -2% |
41 Properties |
| 1996 | £85,611 | 12% |
36 Properties |
| 1995 | £75,404 | - |
26 Properties |
Property Price per Property Type in Bressingham And Burston
Here you can find historic sold price data in order to help with your property search.
The average Property Paid Price for specific property types in the last three years are:
| Property Type | Average Sold Price | Sold Properties |
|---|---|---|
| Semi Detached House | £304,617.00 | 17 Semi Detached Houses |
| Detached House | £507,520.00 | 40 Detached Houses |
| Terraced House | £242,666.00 | 3 Terraced Houses |

