
Houses for sale in Roydon, Diss
House Prices in Roydon
Properties in Roydon have an average house price of £301k and had 86 Property Transactions within the last 3 years¹.
Roydon is an area in Diss, Norfolk with 1,049 households², where the most expensive property was sold for £700k.
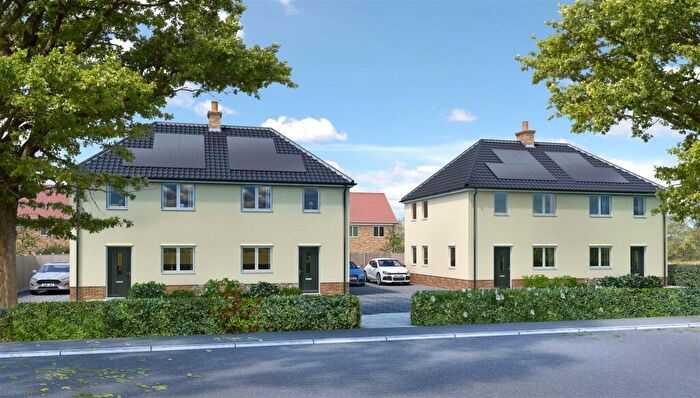
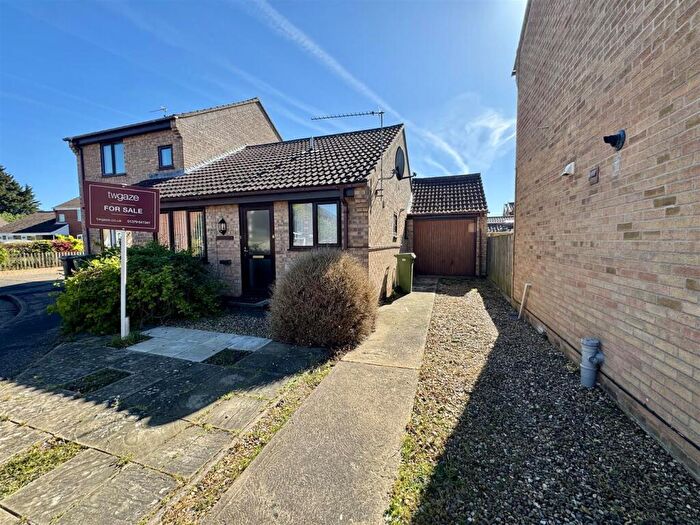
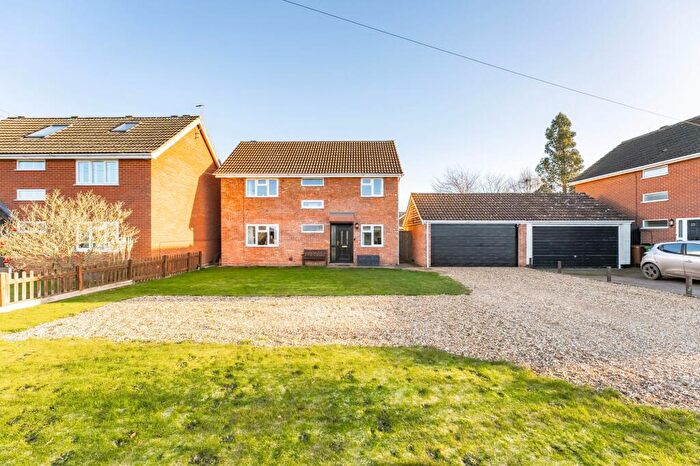
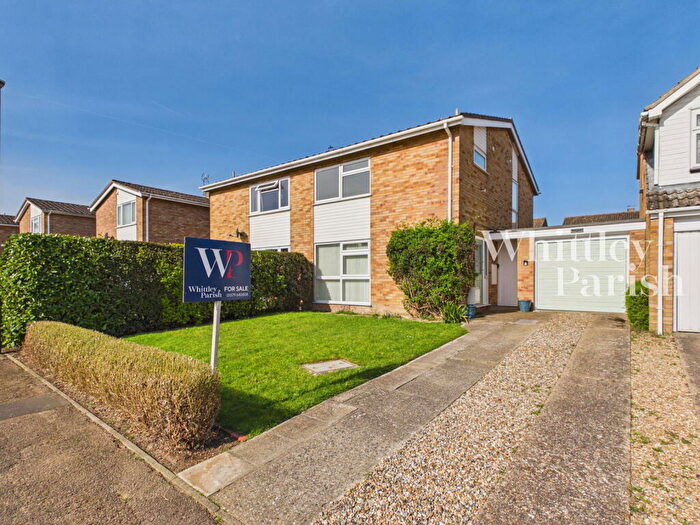
Properties for sale in Roydon
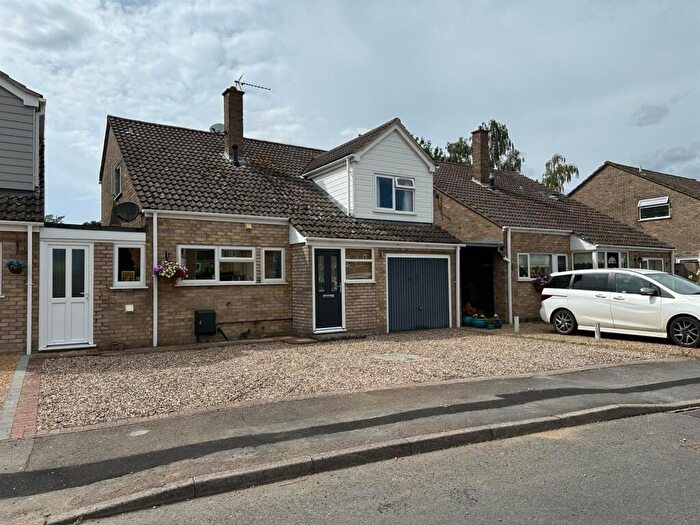

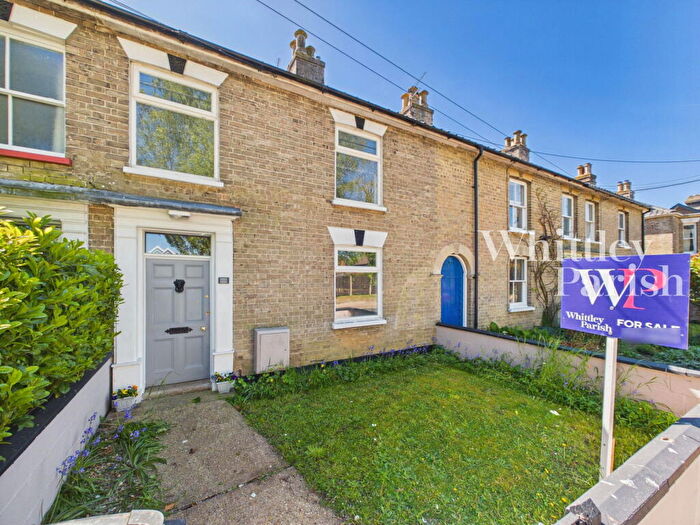
![]()
If you are looking to sell your house, let it out, or receive a property valuation, an expert can help you.
Click the button below to get started.
Previously listed properties in Roydon
Roads and Postcodes in Roydon
Navigate through our locations to find the location of your next house in Roydon, Diss for sale or to rent.
| Streets | Postcodes |
|---|---|
| Aldrich Way | IP22 4FJ |
| Appletree Lane | IP22 4FL IP22 4TL |
| Baynards Lane | IP22 5RX |
| Bellrope Lane | IP22 5RG |
| Blenheim Way | IP22 5RJ |
| Brewers Green | IP22 5SD |
| Brushmakers Way | IP22 4QZ |
| By Wortham Ling | IP22 1SU |
| Charles Terrace | IP22 4BH |
| Church Close | IP22 5RQ |
| Copeman Road | IP22 5RH |
| Cricks Walk | IP22 5SN |
| Darrow Lane | IP22 5SA |
| De Morley Close | IP22 5SH |
| Denmark Lane | IP22 4BL |
| Factory Lane | IP22 4EG IP22 5QW |
| Farm Close | IP22 4EE |
| Frere Corner | IP22 5RS |
| Hall Lane | IP22 5XL |
| High Road | IP22 5RB IP22 5RU |
| Horner Close | IP22 5SJ |
| Hose Avenue | IP22 5RN |
| Lewis Drive | IP22 5SL |
| Linden Grove | IP22 4GJ |
| Long Meadow Drive | IP22 4QS |
| Louies Lane | IP22 4EQ IP22 4QN |
| Manor Drive | IP22 5QY |
| Manor Road | IP22 5QS IP22 5QU |
| Mansell Close | IP22 5RT |
| Millway Avenue | IP22 4QL |
| Newstead Walk | IP22 5RY |
| Nicholls Way | IP22 5SW |
| Old High Road | IP22 5XJ |
| Old Rectory Close | IP22 5RR |
| Pavilion Court | IP22 5SP |
| Poplar Cottages | IP22 5QR |
| Potash Lane | IP22 5SG |
| Queensway | IP22 5QT |
| Roydon Fen | IP22 5SE |
| Roydon Gardens | IP22 5QX |
| Sandstone Way | IP22 4EB |
| Shelfanger Road | IP22 5XT IP22 4DY IP22 4DZ |
| Snow Street | IP22 5RZ IP22 5SB |
| Steggles Drive | IP22 4FH |
| Store Street | IP22 4ED |
| Swamp Lane | IP22 5FY |
| The Close | IP22 5RE |
| Tottington Lane | IP22 5BJ IP22 5SF |
| Tudor Avenue | IP22 5SQ |
| Twiss Close | IP22 5RW |
| Waterloo Avenue | IP22 5RL |
| William Brown Way | IP22 5ZF |
Property price trends in Roydon
According to the latest Land Registry data, the average home in Roydon sold for £347,000 in 2026. That figure comes from 1,592 sales logged over the past 31 years.
Prices have continued to climb over the last three years. Compared with 2023, when the typical sale came in around £302,428, that's a rise of roughly 14.7%.
Looking back five years, average prices are up about 16.9% since 2021, a gain of around £50,104 in cash terms.
Zoom out to the past decade for the fuller picture. Back in 2016, homes here averaged £225,224, so the typical sold price has climbed about 54.1% since then, roughly 4.4% a year. Stretch the view to fifteen years and that annual pace holds at about 4.5%.
Frequently asked questions about Roydon
What is the average price for a property for sale in Roydon?
The average price for a property for sale in Roydon is £300,591. This amount is 4% lower than the average price in Diss. There are 336 property listings for sale in Roydon.
What streets have the most expensive properties for sale in Roydon?
The streets with the most expensive properties for sale in Roydon are Manor Road at an average of £700,000, Hall Lane at an average of £562,500 and Snow Street at an average of £545,000.
What streets have the most affordable properties for sale in Roydon?
The streets with the most affordable properties for sale in Roydon are Nicholls Way at an average of £190,000, Long Meadow Drive at an average of £201,475 and Shelfanger Road at an average of £203,000.
Which train stations are available in or near Roydon?
Some of the train stations available in or near Roydon are Diss, Eccles Road and Harling Road.
Property Price Paid in Roydon by Year
The average sold property price by year was:
| Year | Average Sold Price | Price Change |
Sold Properties
|
|---|---|---|---|
| 2026 | £347,000 | 16% |
3 Properties |
| 2025 | £291,260 | -4% |
25 Properties |
| 2024 | £302,010 | -0,1% |
30 Properties |
| 2023 | £302,428 | -14% |
28 Properties |
| 2022 | £344,148 | 14% |
32 Properties |
| 2021 | £296,896 | 16% |
57 Properties |
| 2020 | £248,605 | -3% |
38 Properties |
| 2019 | £256,849 | -0,1% |
40 Properties |
| 2018 | £257,029 | 4% |
29 Properties |
| 2017 | £246,667 | 9% |
34 Properties |
Property Price per Property Type in Roydon
Here you can find historic sold price data in order to help with your property search.
The average Property Paid Price for specific property types in the last three years are:
| Property Type | Average Sold Price | Sold Properties |
|---|---|---|
| Semi Detached House | £259,464.00 | 28 Semi Detached Houses |
| Detached House | £358,878.00 | 41 Detached Houses |
| Terraced House | £227,754.00 | 17 Terraced Houses |
