
Houses for sale & to rent in Downham Old Town, Downham Market
House Prices in Downham Old Town
Properties in Downham Old Town have an average house price of £232k and had 146 Property Transactions within the last 3 years¹.
Downham Old Town is an area in Downham Market, Norfolk with 1,183 households², where the most expensive property was sold for £725k.
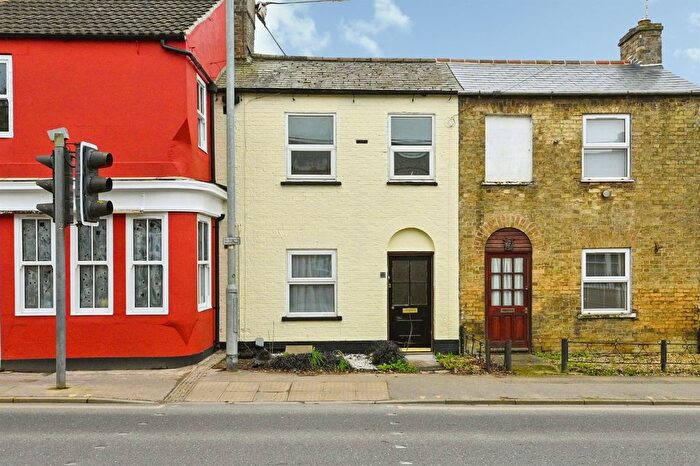
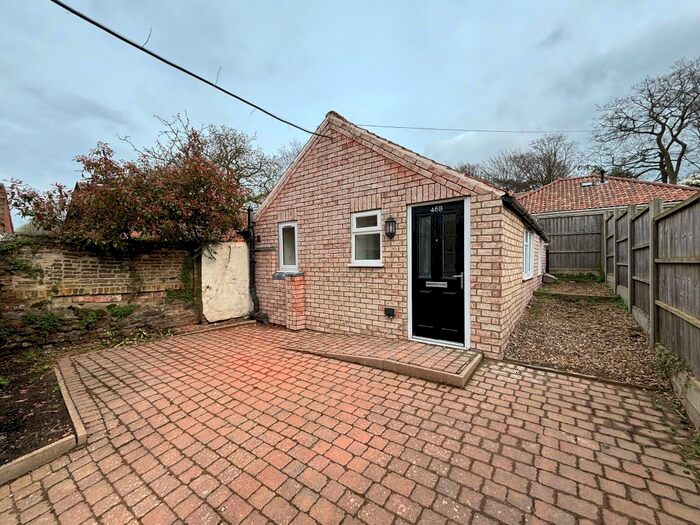
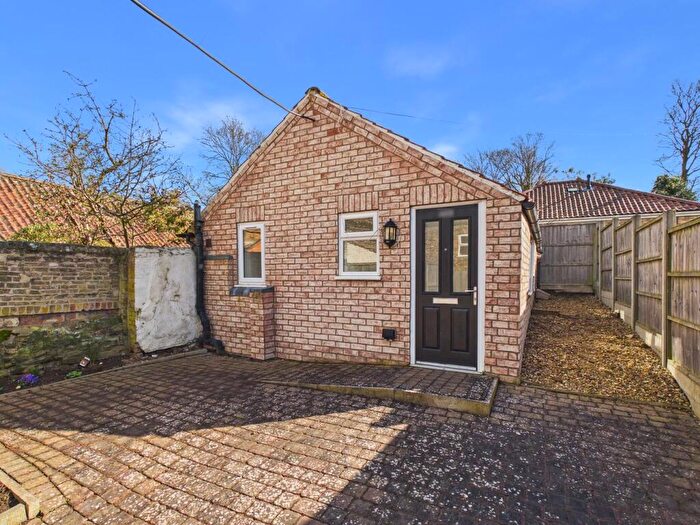
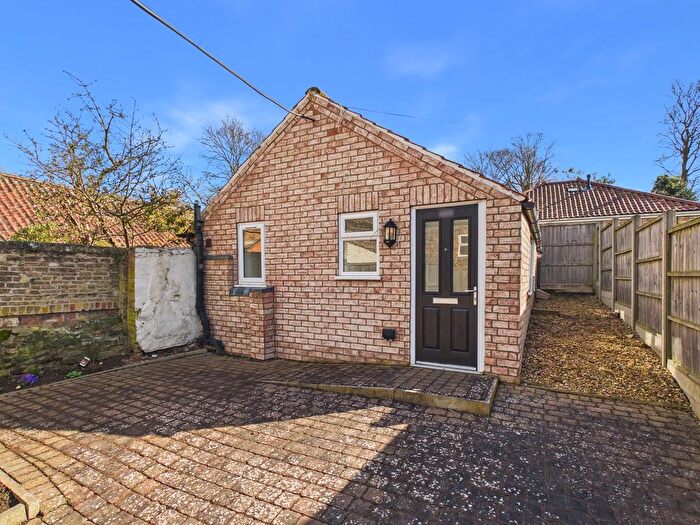
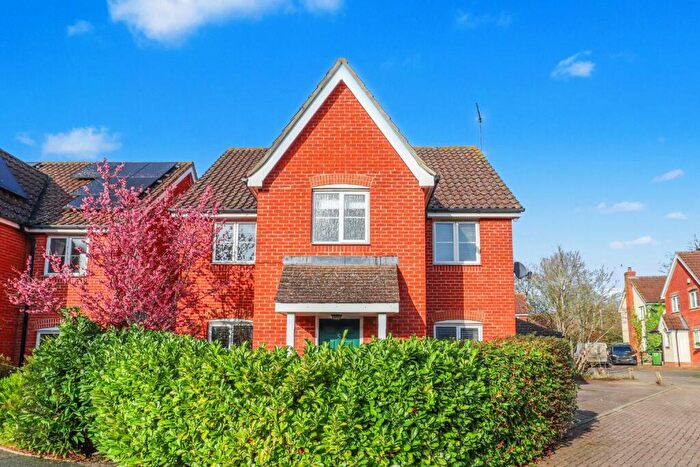
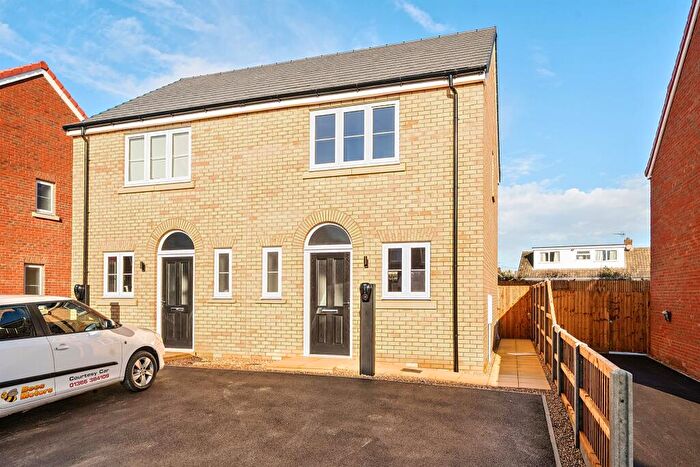
Properties for sale in Downham Old Town
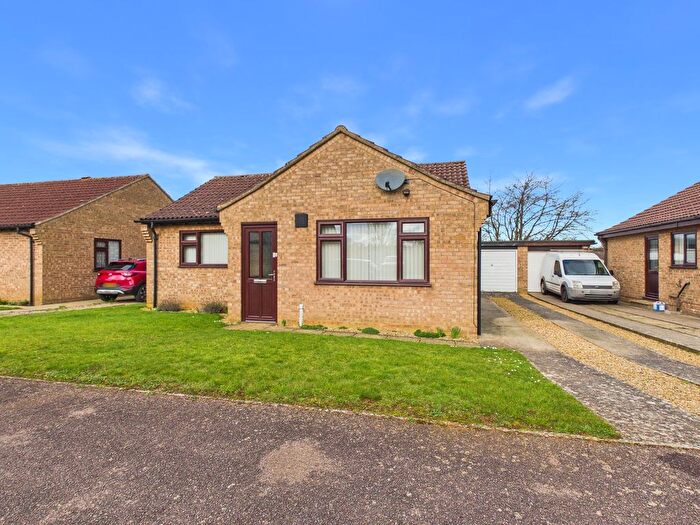
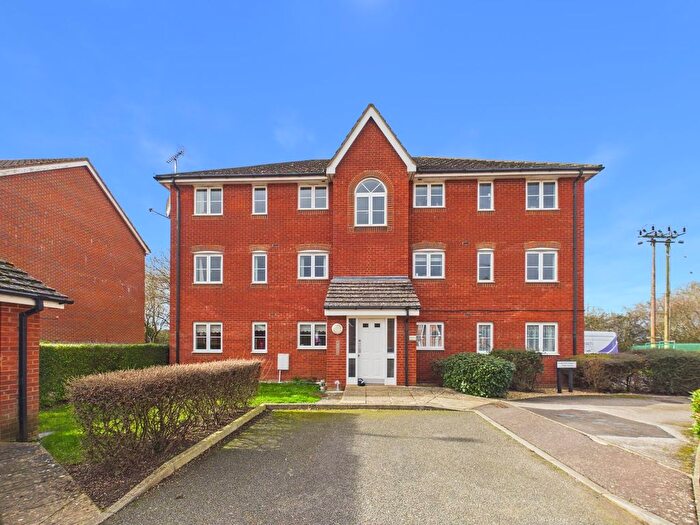
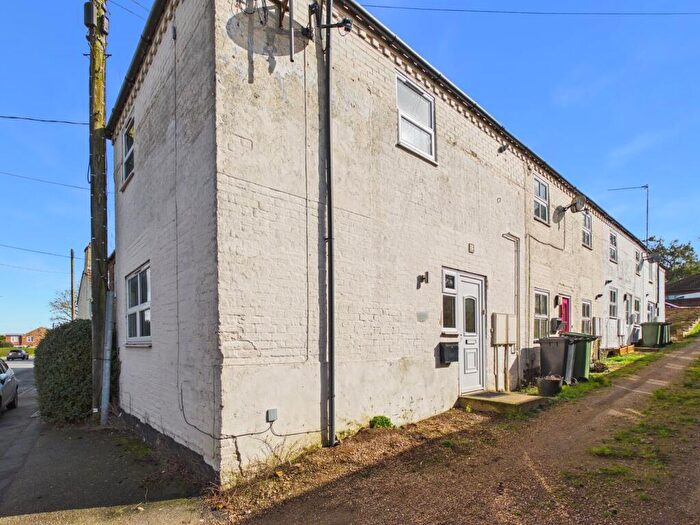

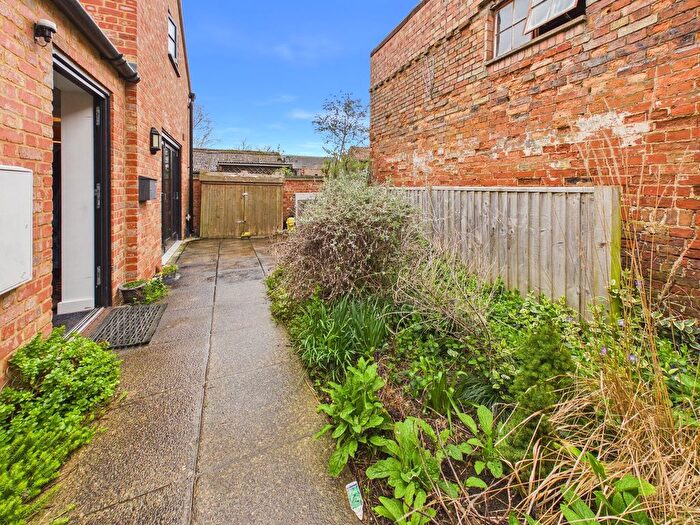
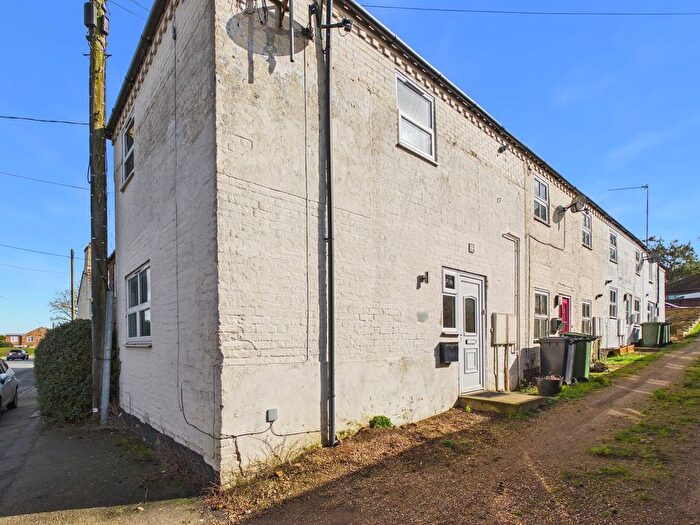
![]()
If you are looking to sell your house, let it out, or receive a property valuation, an expert can help you.
Click the button below to get started.


Roads and Postcodes in Downham Old Town
Navigate through our locations to find the location of your next house in Downham Old Town, Downham Market for sale or to rent.
Transport near Downham Old Town
-
 Downham Market Station
 -
Watlington Station
-
Littleport Station
-
King's Lynn Station
-
Manea Station
-
Shippea Hill Station
-
March Station
-
Lakenheath Station
-
Brandon Station
- FAQ
- Price Paid By Year
- Property Type Price
Frequently asked questions about Downham Old Town
What is the average price for a property for sale in Downham Old Town?
The average price for a property for sale in Downham Old Town is £232,410. This amount is 16% lower than the average price in Downham Market. There are 1,189 property listings for sale in Downham Old Town.
What streets have the most expensive properties for sale in Downham Old Town?
The streets with the most expensive properties for sale in Downham Old Town are The Rowans at an average of £572,500, Snape Lane at an average of £515,000 and Kings Walk at an average of £510,000.
What streets have the most affordable properties for sale in Downham Old Town?
The streets with the most affordable properties for sale in Downham Old Town are Fairfield Road at an average of £126,500, Priory Road at an average of £128,454 and Rushmeadow Crescent at an average of £141,250.
Which train stations are available in or near Downham Old Town?
Some of the train stations available in or near Downham Old Town are Downham Market, Watlington and Littleport.
Property Price Paid in Downham Old Town by Year
The average sold property price by year was:
| Year | Average Sold Price | Price Change |
Sold Properties
|
|---|---|---|---|
| 2025 | £248,000 | 10% |
47 Properties |
| 2024 | £224,214 | -1% |
44 Properties |
| 2023 | £225,645 | -1% |
55 Properties |
| 2022 | £228,764 | -6% |
55 Properties |
| 2021 | £241,782 | 9% |
79 Properties |
| 2020 | £221,080 | 9% |
64 Properties |
| 2019 | £202,053 | -2% |
72 Properties |
| 2018 | £206,232 | 8% |
57 Properties |
| 2017 | £189,480 | 7% |
74 Properties |
| 2016 | £176,312 | 4% |
87 Properties |
| 2015 | £168,969 | 5% |
93 Properties |
| 2014 | £160,358 | 0,3% |
72 Properties |
| 2013 | £159,816 | 18% |
72 Properties |
| 2012 | £130,685 | 4% |
63 Properties |
| 2011 | £125,529 | -6% |
70 Properties |
| 2010 | £133,602 | -8% |
69 Properties |
| 2009 | £143,820 | -6% |
40 Properties |
| 2008 | £152,881 | 3% |
41 Properties |
| 2007 | £148,109 | -2% |
80 Properties |
| 2006 | £151,516 | 14% |
92 Properties |
| 2005 | £130,620 | 3% |
67 Properties |
| 2004 | £126,701 | 4% |
98 Properties |
| 2003 | £122,034 | 18% |
75 Properties |
| 2002 | £99,764 | 19% |
58 Properties |
| 2001 | £80,590 | -2% |
62 Properties |
| 2000 | £82,208 | 31% |
83 Properties |
| 1999 | £56,487 | 6% |
56 Properties |
| 1998 | £53,287 | 1% |
36 Properties |
| 1997 | £52,747 | 28% |
57 Properties |
| 1996 | £37,736 | -15% |
36 Properties |
| 1995 | £43,545 | - |
33 Properties |
Property Price per Property Type in Downham Old Town
Here you can find historic sold price data in order to help with your property search.
The average Property Paid Price for specific property types in the last three years are:
| Property Type | Average Sold Price | Sold Properties |
|---|---|---|
| Semi Detached House | £231,291.00 | 36 Semi Detached Houses |
| Detached House | £401,014.00 | 35 Detached Houses |
| Terraced House | £184,724.00 | 29 Terraced Houses |
| Flat | £135,064.00 | 46 Flats |