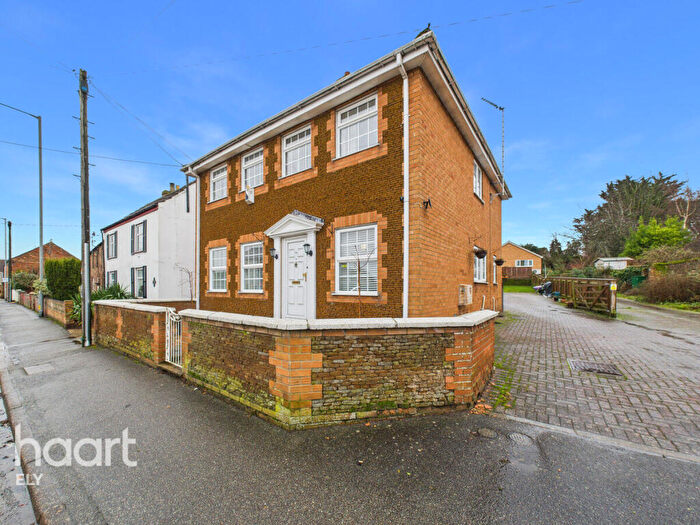
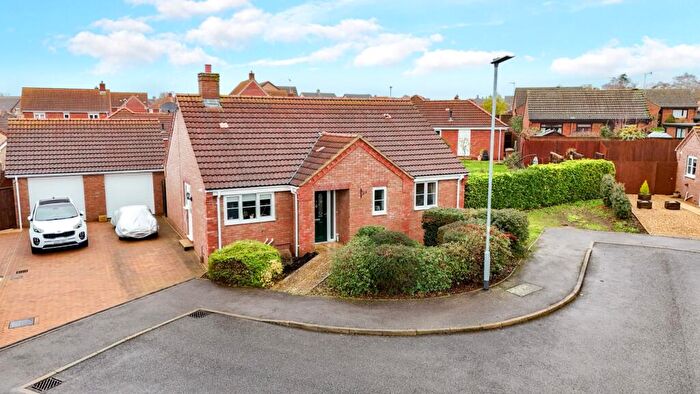
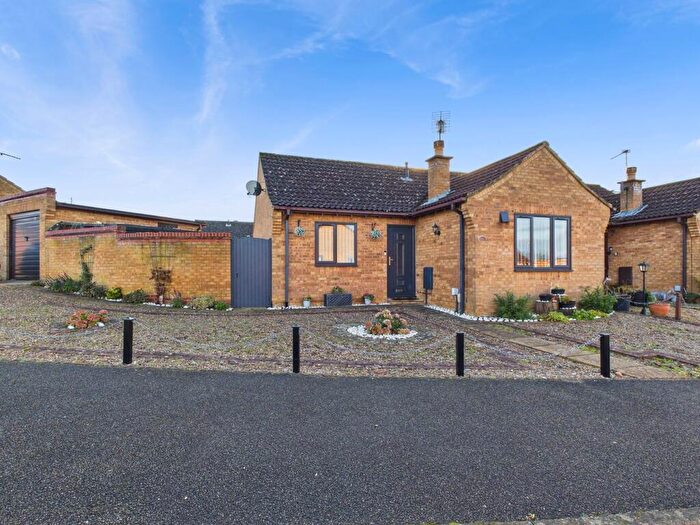
Houses for sale & to rent in South Downham, Downham Market
House Prices in South Downham
Properties in South Downham have an average house price of £305,356.00 and had 143 Property Transactions within the last 3 years¹.
South Downham is an area in Downham Market, Norfolk with 1,198 households², where the most expensive property was sold for £940,000.00.
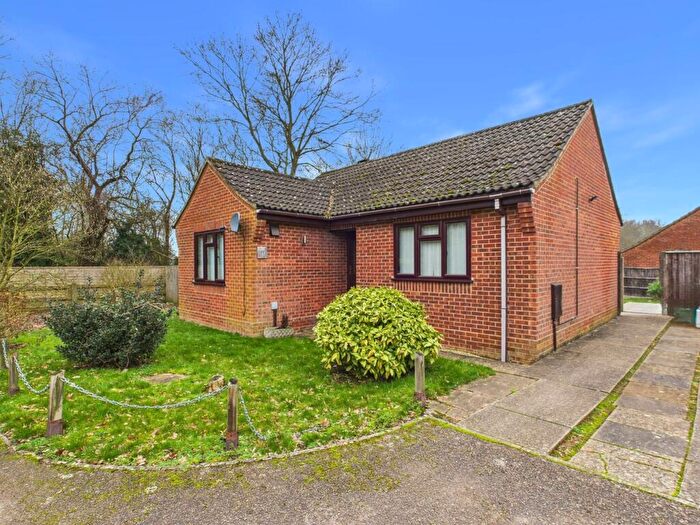
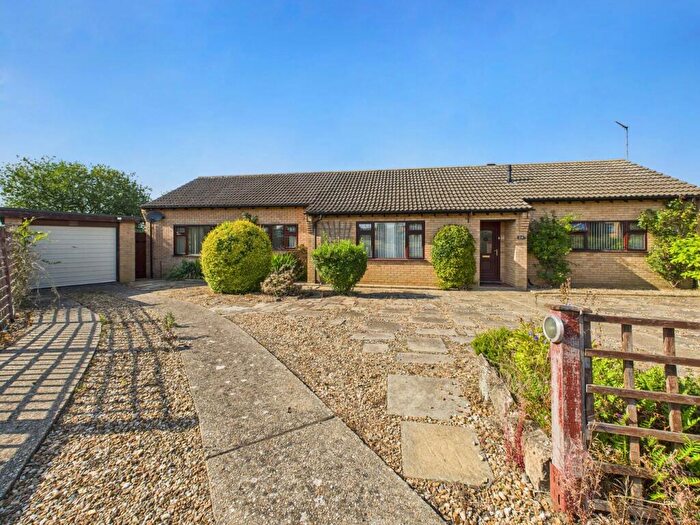
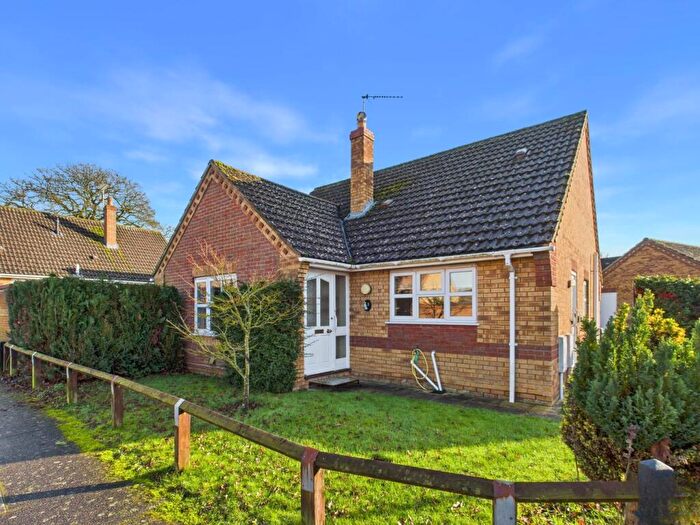
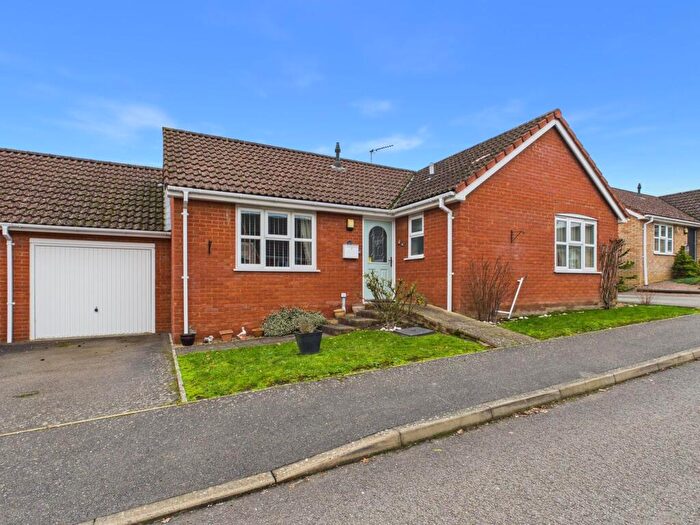
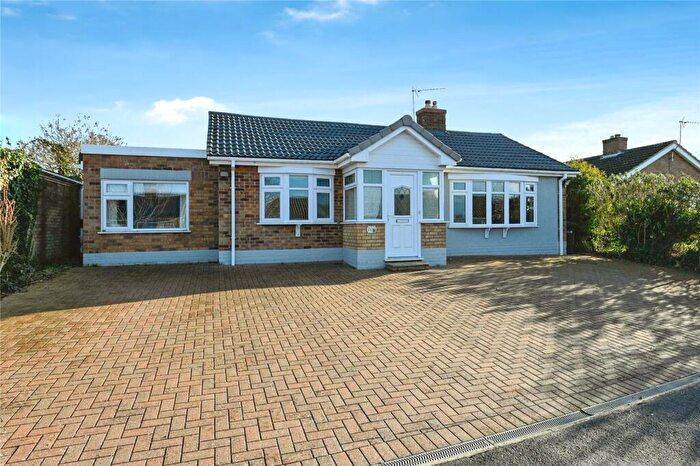
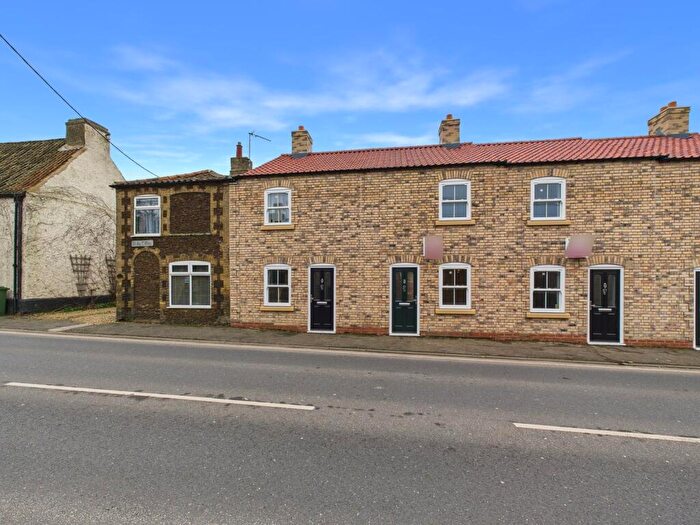
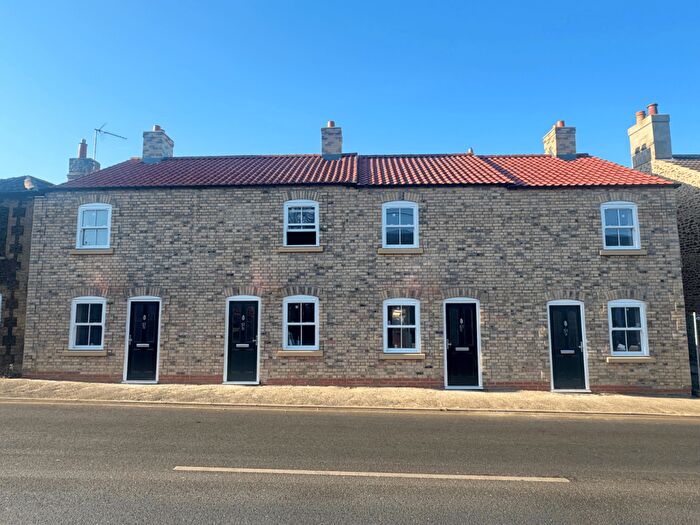
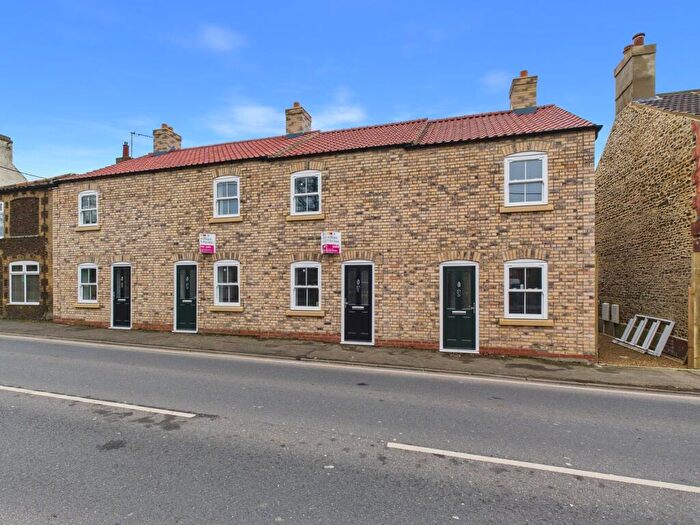
Properties for sale in South Downham
Roads and Postcodes in South Downham
Navigate through our locations to find the location of your next house in South Downham, Downham Market for sale or to rent.
| Streets | Postcodes |
|---|---|
| Admiralty Close | PE38 9SP |
| Alexandra Way | PE38 9TF |
| Bartons Drove | PE38 9ER |
| Belsize Close | PE38 9TD |
| Brickfields Lane | PE38 9ED |
| Burdock Close | PE38 9AZ |
| Burnham Road | PE38 9SD PE38 9SF |
| Buttercup Drive | PE38 9GJ |
| Campion Place | PE38 9TX |
| Churchill Way | PE38 9RS PE38 9RW |
| Collingwood Road | PE38 9SB |
| Crow Hall Estate | PE38 0DG |
| Dennis Sneezum Court | PE38 9RL |
| Denver Hill | PE38 9BE |
| Finsbury Close | PE38 9TH |
| Flax Close | PE38 9TL |
| Foxglove Court | PE38 9GW |
| Greenwich Close | PE38 9TW PE38 9TZ |
| Hamilton Way | PE38 9SR |
| Hardy Close | PE38 9RX |
| Harebell Road | PE38 9SS |
| High Hatters Close | PE38 9RP |
| Horse Fair Close | PE38 0QR |
| Kensington Road | PE38 9SX |
| Kew Road | PE38 9TG |
| Larkspur Close | PE38 9RJ |
| London Road | PE38 9AT PE38 9BP PE38 9BQ |
| Low Hatters Close | PE38 9RR |
| Manby Road | PE38 9SQ |
| Nightingale Lane | PE38 9FD |
| Nile Road | PE38 9SA |
| Oakfield Close | PE38 9BN |
| Palmer Way | PE38 9UY PE38 9UZ |
| Park Lane | PE38 9RN PE38 9SH |
| Priory Road | PE38 9JW |
| Ravensway | PE38 0DB |
| Regent Road | PE38 9TJ PE38 9TN |
| Revell Road | PE38 9SE |
| Richmond Road | PE38 9TA PE38 9TB |
| Russell Close | PE38 9TY |
| Ryston Close | PE38 9BD |
| Ryston End | PE38 9BA PE38 9BB PE38 9BG |
| Snowdrop Grove | PE38 9GS |
| Sorrel Way | PE38 9UD |
| Sovereign Way | PE38 9SW |
| St James Drive | PE38 9SZ |
| St Johns Way | PE38 0QQ |
| Syon Close | PE38 9SY |
| Trafalgar Road | PE38 9JP PE38 9RT PE38 9RY PE38 9RZ |
| Victory Road | PE38 9RU |
| West Way | PE38 9SG |
| Wimbledon Way | PE38 9ST |
| Wingfields | PE38 9AR |
| Woodsage Drive | PE38 9UG |
| PE38 9SU |
Transport near South Downham
- FAQ
- Price Paid By Year
- Property Type Price
Frequently asked questions about South Downham
What is the average price for a property for sale in South Downham?
The average price for a property for sale in South Downham is £305,356. This amount is 10% higher than the average price in Downham Market. There are 1,089 property listings for sale in South Downham.
What streets have the most expensive properties for sale in South Downham?
The streets with the most expensive properties for sale in South Downham are Ryston End at an average of £575,000, London Road at an average of £462,444 and Ravensway at an average of £416,250.
What streets have the most affordable properties for sale in South Downham?
The streets with the most affordable properties for sale in South Downham are Crow Hall Estate at an average of £135,000, Finsbury Close at an average of £210,000 and Regent Road at an average of £213,750.
Which train stations are available in or near South Downham?
Some of the train stations available in or near South Downham are Downham Market, Watlington and Littleport.
Property Price Paid in South Downham by Year
The average sold property price by year was:
| Year | Average Sold Price | Price Change |
Sold Properties
|
|---|---|---|---|
| 2025 | £321,903 | 8% |
39 Properties |
| 2024 | £296,665 | -2% |
53 Properties |
| 2023 | £301,735 | -9% |
51 Properties |
| 2022 | £327,693 | 20% |
61 Properties |
| 2021 | £262,955 | 6% |
68 Properties |
| 2020 | £246,449 | -2% |
60 Properties |
| 2019 | £252,069 | 4% |
65 Properties |
| 2018 | £242,894 | 3% |
60 Properties |
| 2017 | £234,437 | 11% |
68 Properties |
| 2016 | £209,737 | 1% |
91 Properties |
| 2015 | £207,005 | -1% |
84 Properties |
| 2014 | £209,867 | 18% |
62 Properties |
| 2013 | £172,788 | 9% |
45 Properties |
| 2012 | £157,401 | -6% |
46 Properties |
| 2011 | £166,194 | -11% |
46 Properties |
| 2010 | £184,399 | 10% |
40 Properties |
| 2009 | £165,355 | -12% |
28 Properties |
| 2008 | £185,178 | 5% |
39 Properties |
| 2007 | £176,170 | 3% |
59 Properties |
| 2006 | £171,106 | -11% |
83 Properties |
| 2005 | £189,584 | 10% |
79 Properties |
| 2004 | £170,215 | 11% |
79 Properties |
| 2003 | £151,840 | 30% |
45 Properties |
| 2002 | £105,660 | 19% |
90 Properties |
| 2001 | £85,827 | 14% |
81 Properties |
| 2000 | £73,874 | 4% |
74 Properties |
| 1999 | £70,942 | -0,2% |
63 Properties |
| 1998 | £71,119 | 10% |
52 Properties |
| 1997 | £63,827 | 4% |
69 Properties |
| 1996 | £61,345 | 1% |
83 Properties |
| 1995 | £60,808 | - |
78 Properties |
Property Price per Property Type in South Downham
Here you can find historic sold price data in order to help with your property search.
The average Property Paid Price for specific property types in the last three years are:
| Property Type | Average Sold Price | Sold Properties |
|---|---|---|
| Semi Detached House | £239,809.00 | 21 Semi Detached Houses |
| Detached House | £323,817.00 | 115 Detached Houses |
| Terraced House | £217,800.00 | 5 Terraced Houses |
| Flat | £151,000.00 | 2 Flats |

