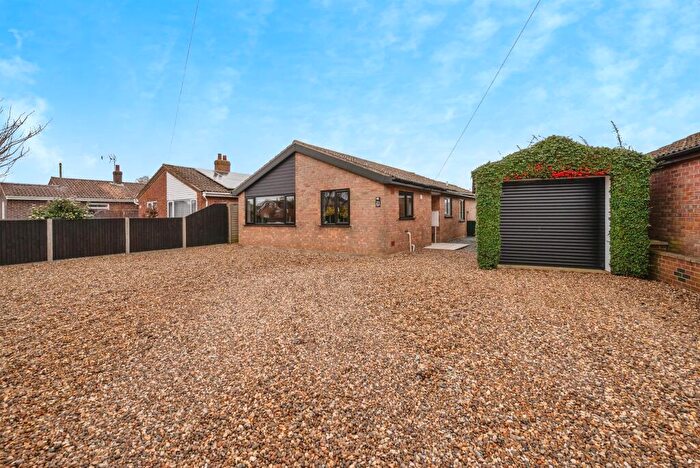
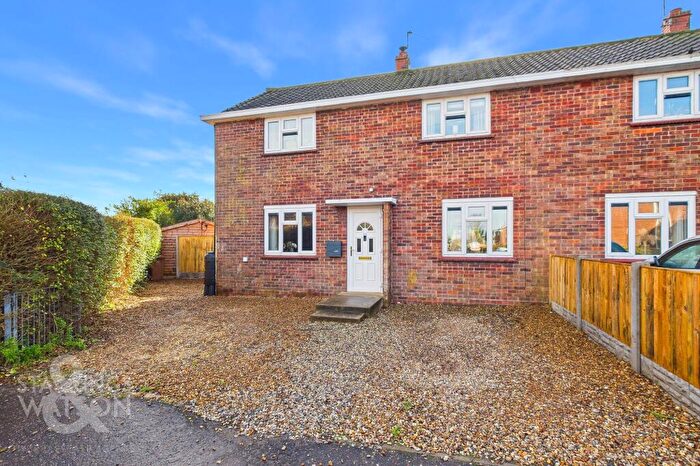
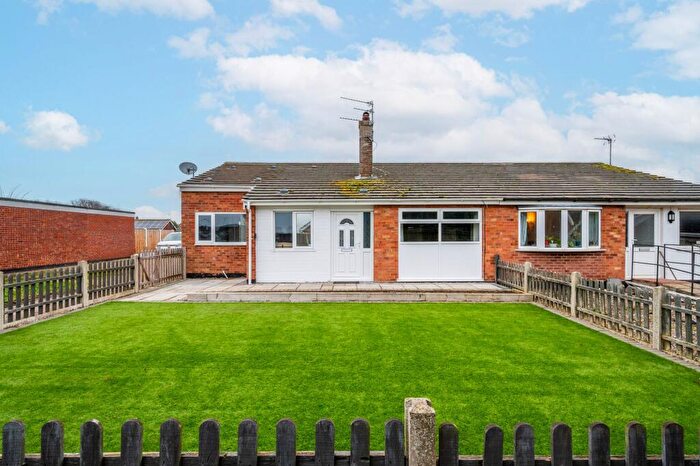
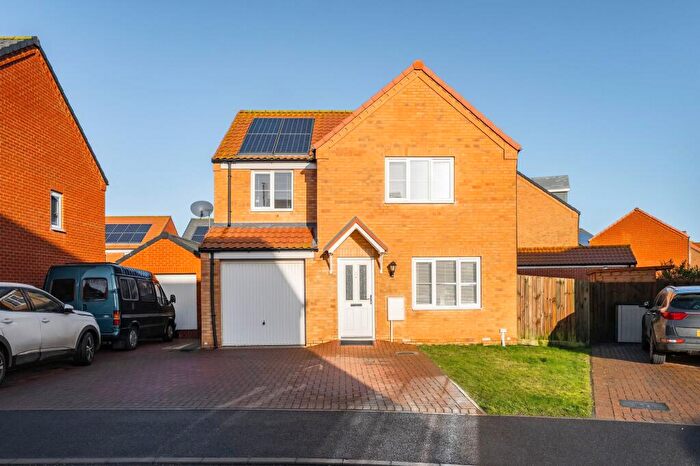
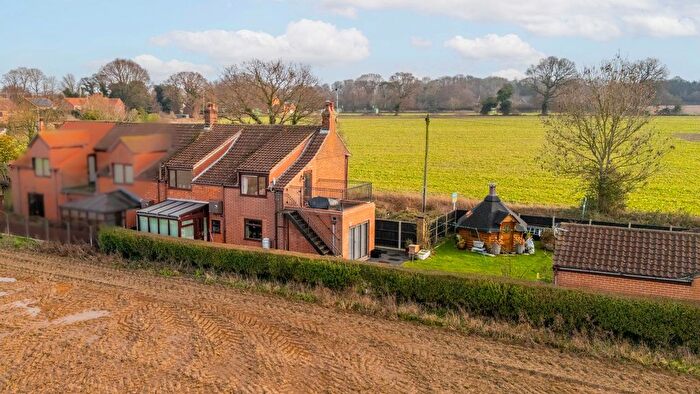
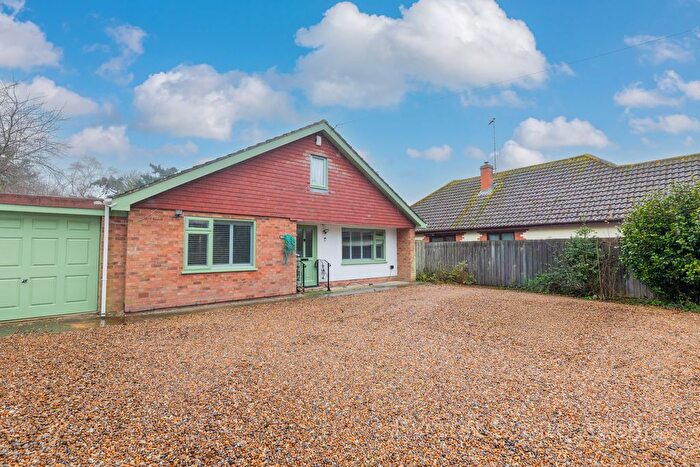
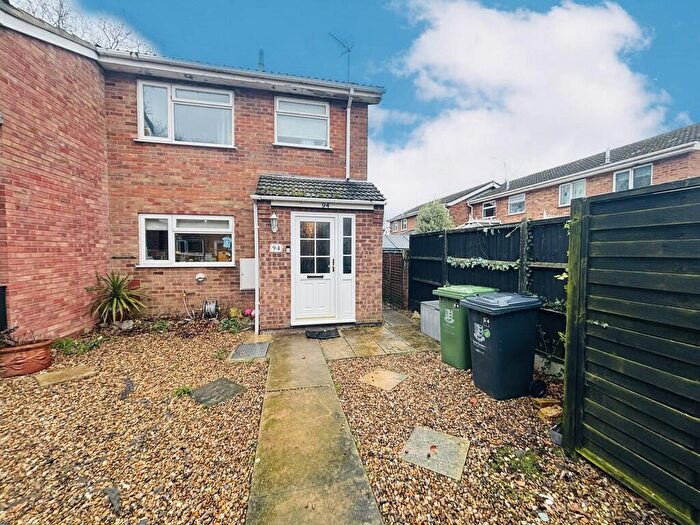
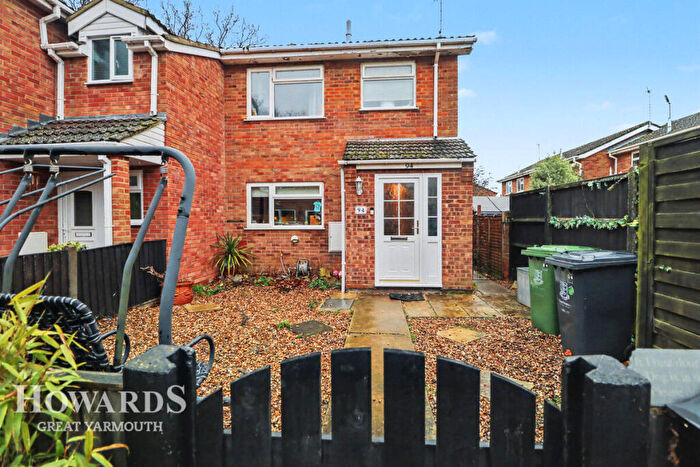
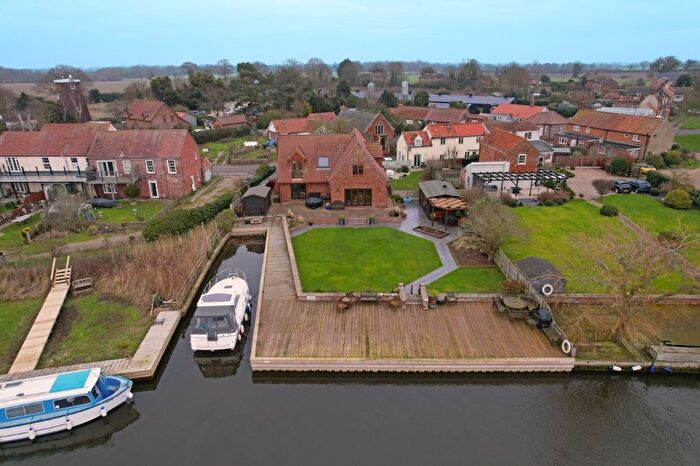
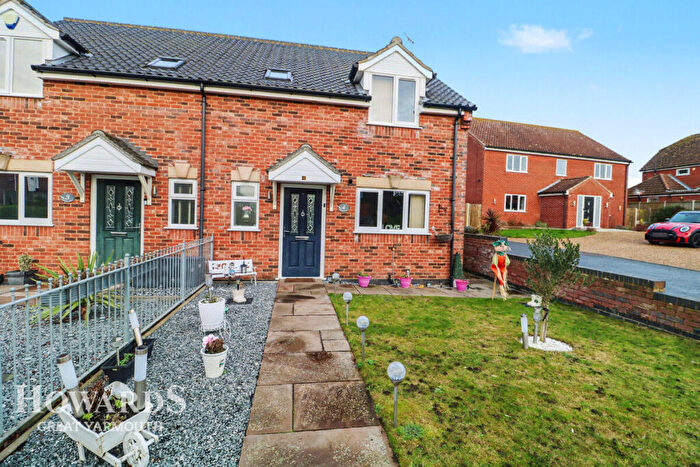
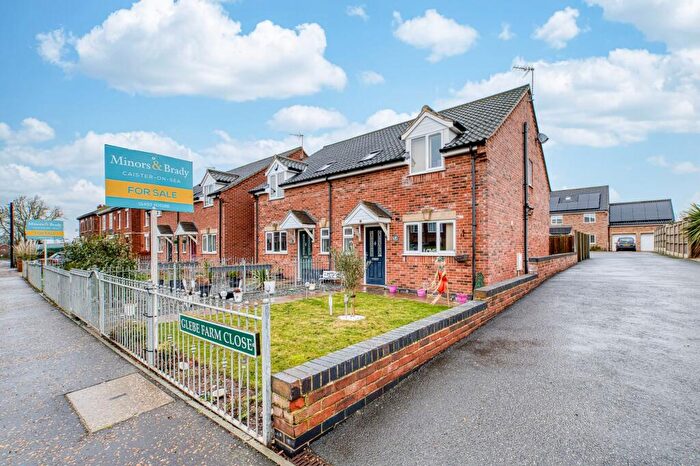
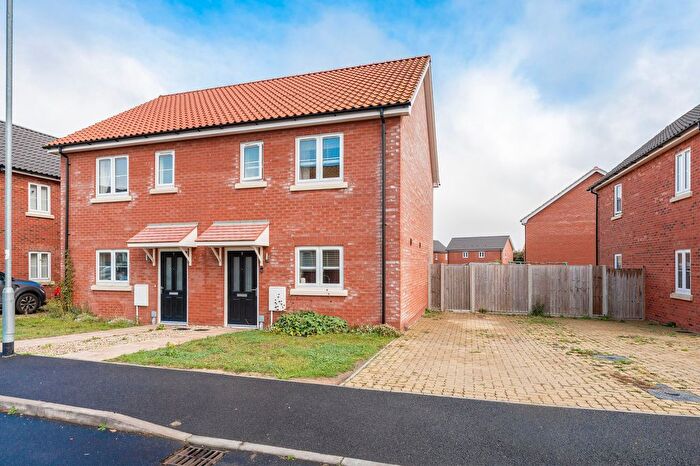
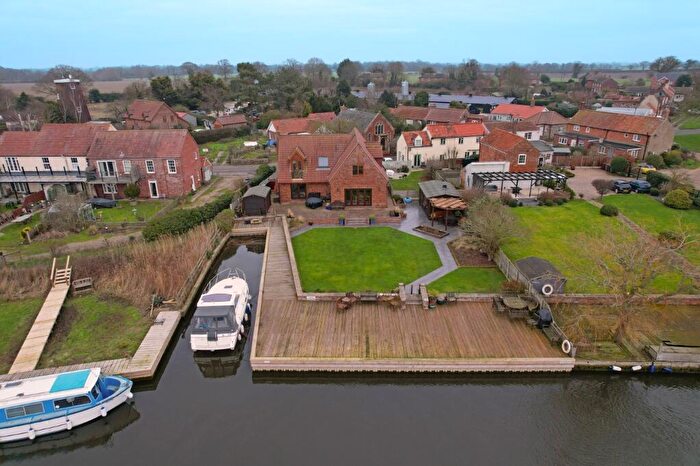
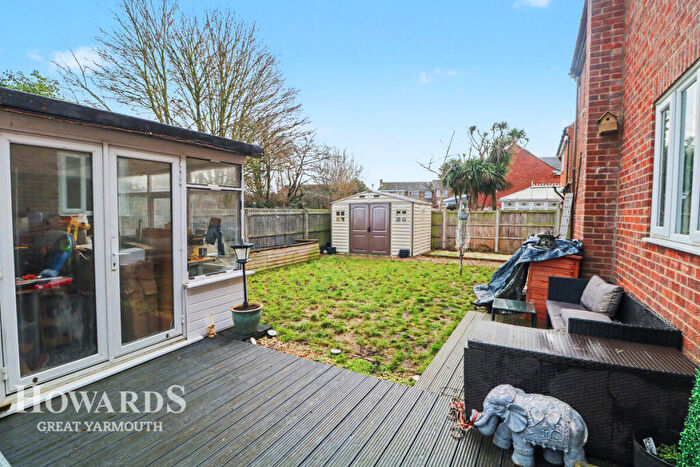
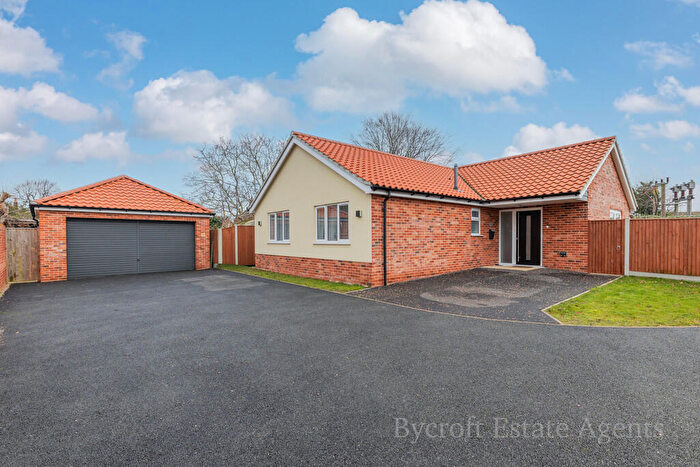
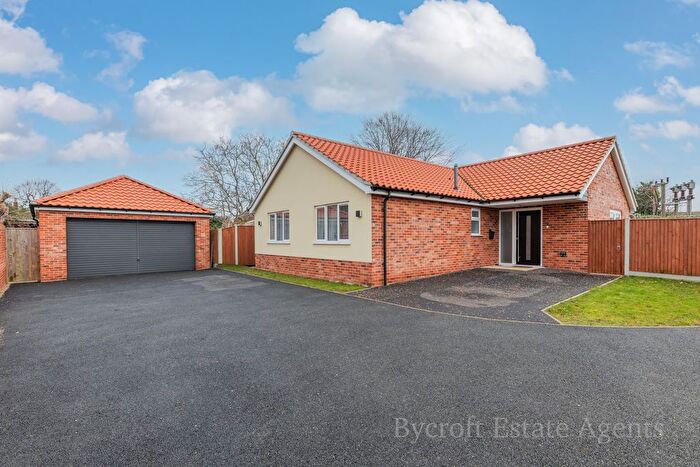
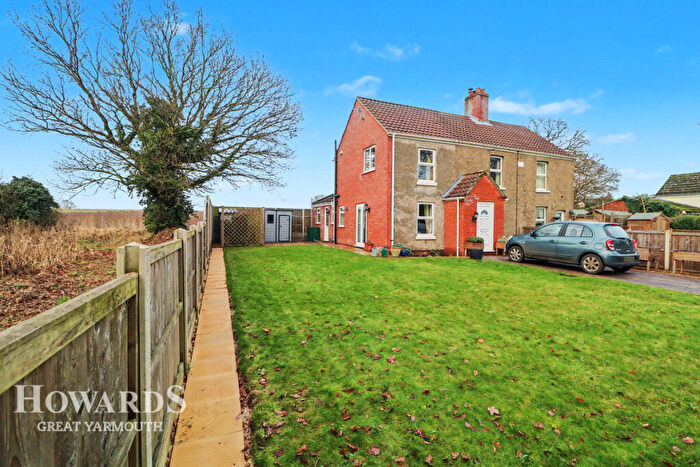
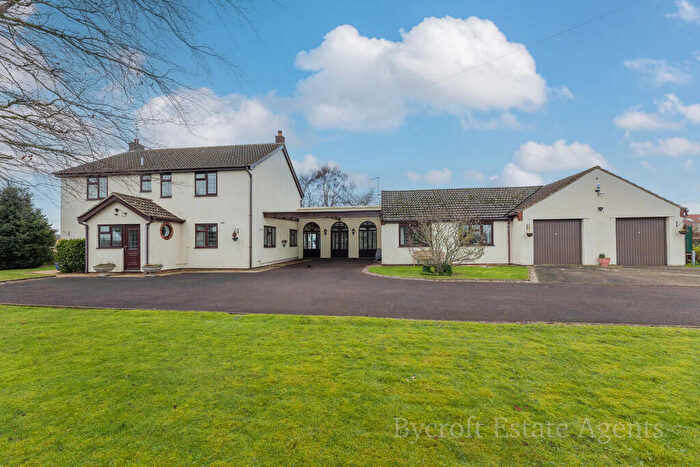
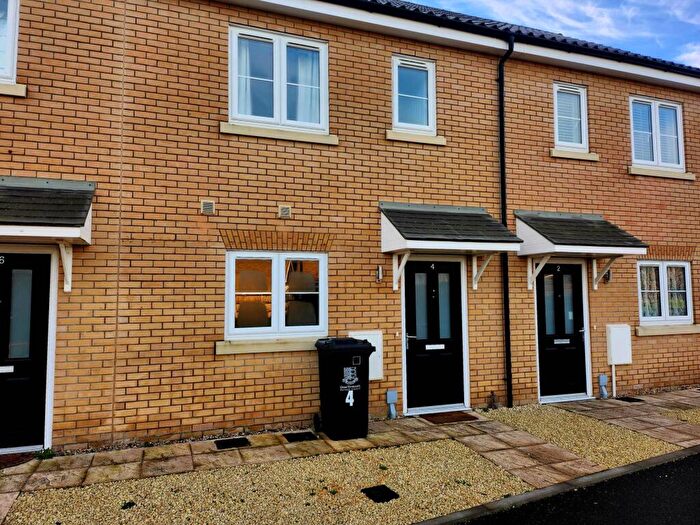
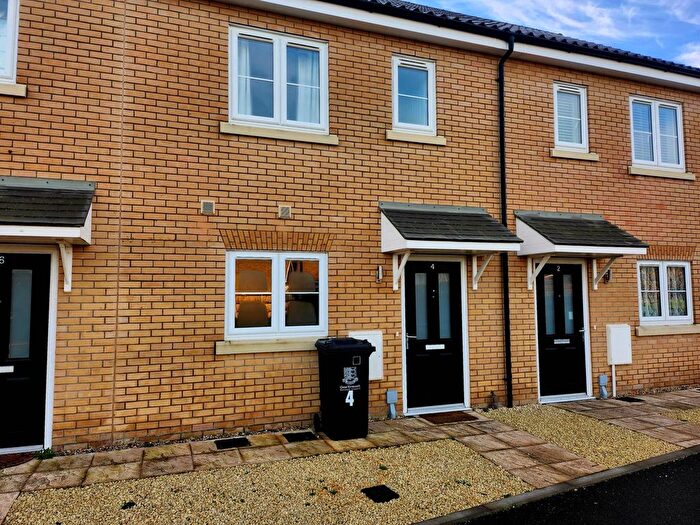
Houses for sale & to rent in Fleggburgh, Great Yarmouth
House Prices in Fleggburgh
Properties in Fleggburgh have an average house price of £423,469.00 and had 57 Property Transactions within the last 3 years¹.
Fleggburgh is an area in Great Yarmouth, Norfolk with 1,012 households², where the most expensive property was sold for £995,000.00.
Properties for sale in Fleggburgh
Roads and Postcodes in Fleggburgh
Navigate through our locations to find the location of your next house in Fleggburgh, Great Yarmouth for sale or to rent.
| Streets | Postcodes |
|---|---|
| Autumn Close | NR29 3FQ |
| Barn Lane | NR29 3EF |
| Bessey Close | NR29 3HQ |
| Blanks Close | NR29 3JF |
| Broad Lane | NR29 3HH |
| Broad Road | NR29 3DD |
| Browns Lane | NR29 3JQ |
| Bygone Close | NR29 3FA |
| Chapel Road | NR29 3HA |
| Church Lane | NR29 3HW NR29 3EL |
| Church Terrace | NR29 3BJ |
| Church View | NR29 3DJ |
| Claxton's Gardens | NR29 3BF |
| Common Lane | NR29 3HL |
| Croft Hill | NR29 3EU |
| Filby Close | NR29 3HT |
| Filby Road | NR29 3DR NR29 3ET NR29 3DG |
| Fir Tree Close | NR29 3DU |
| Furze Hill | NR29 3EZ |
| Gate House Close | NR29 3FE |
| Glebe Corner | NR29 3ED |
| Grange Farm Close | NR29 3JH |
| Hall Close | NR29 3FD |
| Hall Road | NR29 3BL |
| Homestead Gardens | NR29 3HE |
| Lacons Corner | NR29 3JB |
| Low Road | NR29 3EQ |
| Main Road | NR29 3AA NR29 3AF NR29 3AG NR29 3BA NR29 3BE NR29 3BG NR29 3BQ NR29 3HN NR29 3HS NR29 3HY NR29 3AE NR29 3BD |
| Manor House Close | NR29 3HB |
| Market Lane | NR29 3ST |
| Market Road | NR29 3ES |
| Marsh Road | NR29 3DE |
| Mautby Lane | NR29 3EE NR29 3EJ NR29 3HZ NR29 3JA |
| Mill Lane | NR29 3AW NR29 3DA |
| Mill Road | NR29 3DY NR29 3EY NR29 3FP |
| Mulberry Tree Close | NR29 3HD |
| Orchard Way | NR29 3AY |
| Ormesby Lane | NR29 3HX |
| Paddock Farm Drive | NR29 3JL |
| Pipistrelle Close | NR29 3FF |
| Poplar Drive | NR29 3HU |
| Poppy Gardens | NR29 3DT |
| Pound Lane | NR29 3BB NR29 3HP NR29 3HR |
| Private Road | NR29 3DX |
| Repps Road | NR29 3BH |
| Rollesby Road | NR29 3AN NR29 3AQ NR29 3AR NR29 3AS |
| Royden Way | NR29 3AZ |
| Ruggs Lane | NR29 3DH |
| Runham Road | NR29 3EP |
| Rye Gardens | NR29 3FJ |
| School Road | NR29 3EG |
| Silver Street | NR29 3DB |
| St Margarets Way | NR29 3DN |
| Stokesby Road | NR29 3EN |
| Swim Road | NR29 3EH |
| The Common | NR29 3DF |
| The Green | NR29 3EX |
| The Heath | NR29 3JG |
| The Street | NR29 3AH |
| The Village | NR29 3DL |
| Thrigby Road | NR29 3EA NR29 3HJ NR29 3DP |
| Tower Road | NR29 3AU NR29 3AX NR29 3DW |
| Town Road | NR29 3AB |
| Tretts Lane | NR29 3AT |
| Trust Close | NR29 3FB |
| Westfield Close | NR29 3DQ |
| Whiteham Lane | NR29 3FG |
| York Villa Close | NR29 3JN |
| NR29 3AL NR29 3ER NR29 3JD NR29 3JE NR29 3DS NR29 3DZ NR29 3EB NR29 3EW NR30 5SJ |
Transport near Fleggburgh
- FAQ
- Price Paid By Year
- Property Type Price
Frequently asked questions about Fleggburgh
What is the average price for a property for sale in Fleggburgh?
The average price for a property for sale in Fleggburgh is £423,469. This amount is 84% higher than the average price in Great Yarmouth. There are 1,404 property listings for sale in Fleggburgh.
What streets have the most expensive properties for sale in Fleggburgh?
The streets with the most expensive properties for sale in Fleggburgh are The Village at an average of £995,000, Silver Street at an average of £810,000 and Church View at an average of £725,000.
What streets have the most affordable properties for sale in Fleggburgh?
The streets with the most affordable properties for sale in Fleggburgh are Market Road at an average of £184,000, St Margarets Way at an average of £200,000 and Hall Close at an average of £217,500.
Which train stations are available in or near Fleggburgh?
Some of the train stations available in or near Fleggburgh are Acle, Berney Arms and Great Yarmouth.
Property Price Paid in Fleggburgh by Year
The average sold property price by year was:
| Year | Average Sold Price | Price Change |
Sold Properties
|
|---|---|---|---|
| 2025 | £449,125 | 7% |
18 Properties |
| 2024 | £419,325 | 4% |
20 Properties |
| 2023 | £403,526 | -6% |
19 Properties |
| 2022 | £429,005 | 12% |
40 Properties |
| 2021 | £375,851 | 6% |
59 Properties |
| 2020 | £354,678 | 6% |
33 Properties |
| 2019 | £334,492 | 8% |
32 Properties |
| 2018 | £307,040 | -1% |
40 Properties |
| 2017 | £309,259 | 4% |
48 Properties |
| 2016 | £296,532 | 15% |
48 Properties |
| 2015 | £252,274 | -10% |
48 Properties |
| 2014 | £277,672 | 9% |
52 Properties |
| 2013 | £253,189 | -13% |
34 Properties |
| 2012 | £285,444 | 15% |
38 Properties |
| 2011 | £242,680 | -6% |
31 Properties |
| 2010 | £257,175 | 13% |
34 Properties |
| 2009 | £224,108 | 5% |
24 Properties |
| 2008 | £212,473 | -18% |
19 Properties |
| 2007 | £249,992 | 24% |
39 Properties |
| 2006 | £189,919 | -13% |
44 Properties |
| 2005 | £214,587 | 20% |
33 Properties |
| 2004 | £172,073 | -0,4% |
40 Properties |
| 2003 | £172,792 | 17% |
51 Properties |
| 2002 | £143,416 | 8% |
47 Properties |
| 2001 | £132,116 | 18% |
42 Properties |
| 2000 | £108,842 | 18% |
40 Properties |
| 1999 | £89,015 | 11% |
41 Properties |
| 1998 | £79,024 | 10% |
38 Properties |
| 1997 | £71,174 | 4% |
39 Properties |
| 1996 | £68,023 | 6% |
31 Properties |
| 1995 | £63,734 | - |
23 Properties |
Property Price per Property Type in Fleggburgh
Here you can find historic sold price data in order to help with your property search.
The average Property Paid Price for specific property types in the last three years are:
| Property Type | Average Sold Price | Sold Properties |
|---|---|---|
| Semi Detached House | £337,500.00 | 16 Semi Detached Houses |
| Detached House | £500,414.00 | 35 Detached Houses |
| Terraced House | £197,062.00 | 4 Terraced Houses |
| Flat | £217,500.00 | 2 Flats |

