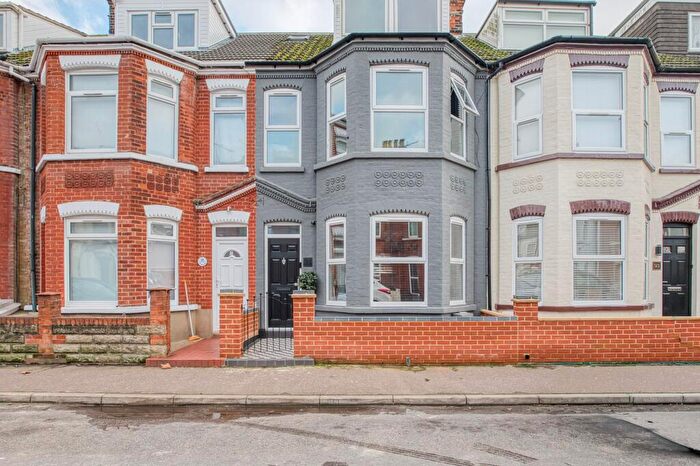
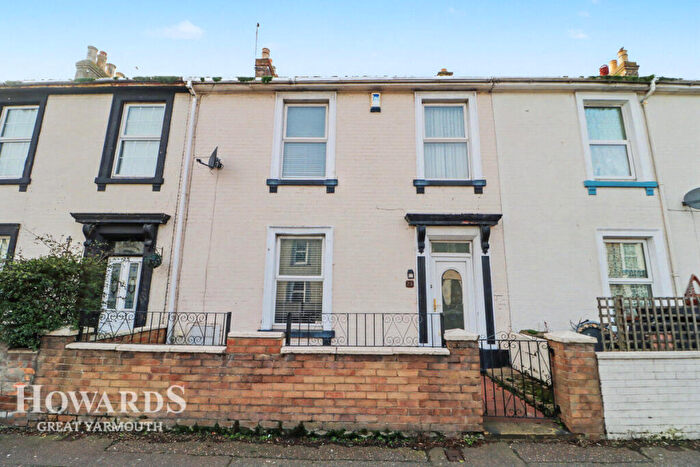
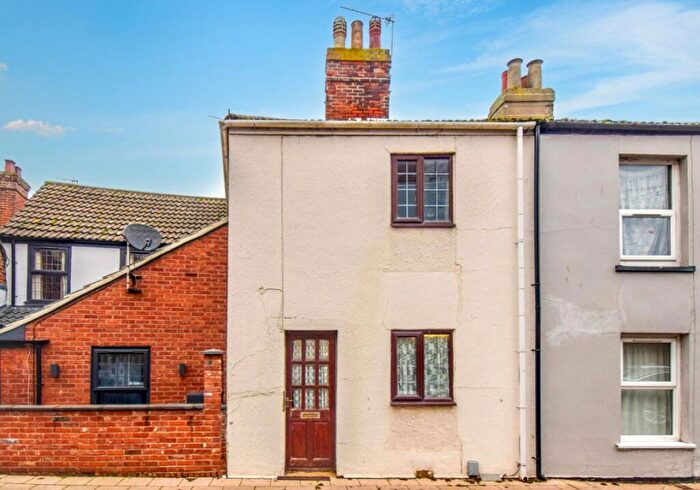
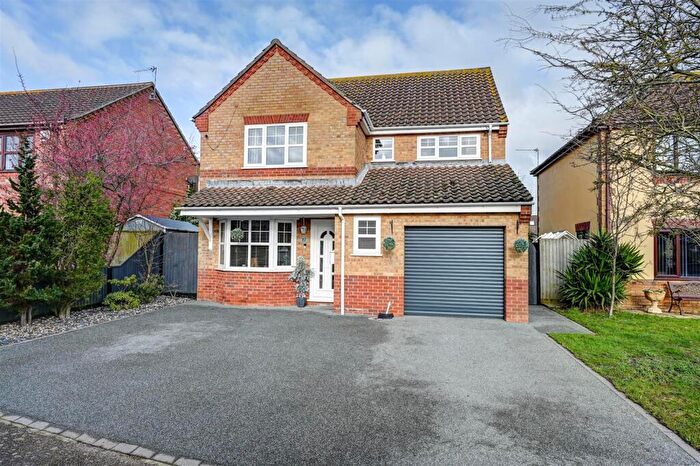
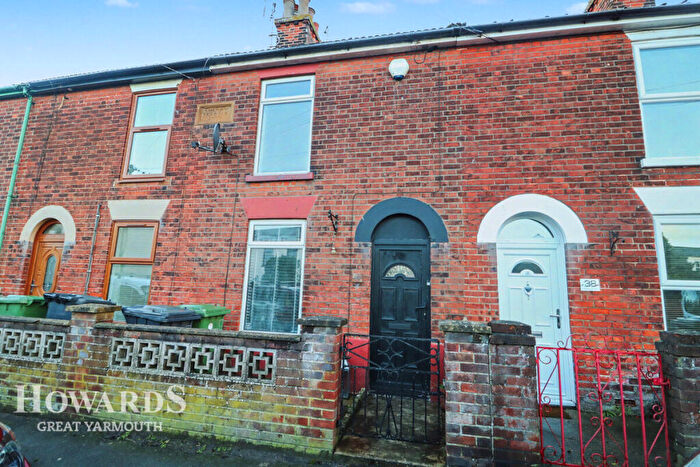
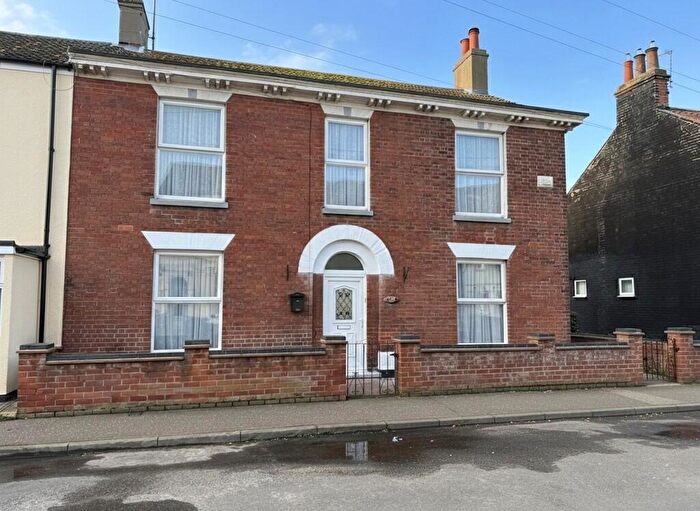
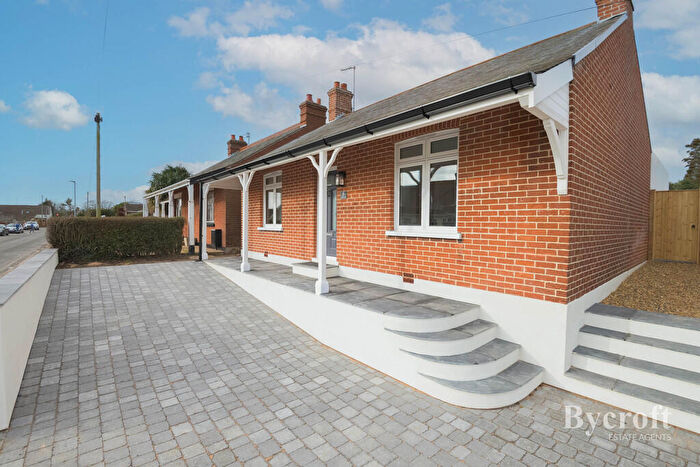
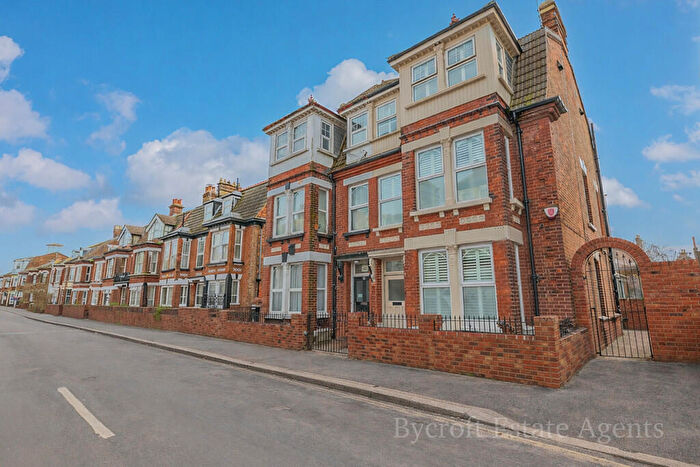
Houses for sale & to rent in Great Yarmouth, Norfolk
House Prices in Great Yarmouth
Properties in Great Yarmouth have an average house price of £229,772.00 and had 4,025 Property Transactions within the last 3 years.¹
Great Yarmouth is an area in Norfolk with 43,623 households², where the most expensive property was sold for £1,225,000.00.
Properties for sale in Great Yarmouth
Neighbourhoods in Great Yarmouth
Navigate through our locations to find the location of your next house in Great Yarmouth, Norfolk for sale or to rent.
Transport in Great Yarmouth
Please see below transportation links in this area:
-
Great Yarmouth Station
-
Berney Arms Station
-
Acle Station
-
Reedham (Norfolk) Station
-
Haddiscoe Station
-
Somerleyton Station
-
Cantley Station
-
Lingwood Station
-
Buckenham Station
-
Oulton Broad North Station
- FAQ
- Price Paid By Year
- Property Type Price
Frequently asked questions about Great Yarmouth
What is the average price for a property for sale in Great Yarmouth?
The average price for a property for sale in Great Yarmouth is £229,772. This amount is 23% lower than the average price in Norfolk. There are more than 10,000 property listings for sale in Great Yarmouth.
What locations have the most expensive properties for sale in Great Yarmouth?
The locations with the most expensive properties for sale in Great Yarmouth are Fleggburgh at an average of £423,469, Waterside at an average of £332,595 and Gorleston at an average of £298,825.
What locations have the most affordable properties for sale in Great Yarmouth?
The locations with the most affordable properties for sale in Great Yarmouth are Southtown And Cobholm at an average of £130,349, Nelson at an average of £134,566 and Central And Northgate at an average of £149,454.
Which train stations are available in or near Great Yarmouth?
Some of the train stations available in or near Great Yarmouth are Great Yarmouth, Berney Arms and Acle.
Property Price Paid in Great Yarmouth by Year
The average sold property price by year was:
| Year | Average Sold Price | Price Change |
Sold Properties
|
|---|---|---|---|
| 2025 | £233,431 | 3% |
1,267 Properties |
| 2024 | £225,268 | -3% |
1,487 Properties |
| 2023 | £231,394 | -2% |
1,271 Properties |
| 2022 | £236,938 | 6% |
1,777 Properties |
| 2021 | £223,878 | 10% |
2,309 Properties |
| 2020 | £202,529 | 5% |
1,694 Properties |
| 2019 | £193,284 | 3% |
2,002 Properties |
| 2018 | £188,111 | 3% |
1,756 Properties |
| 2017 | £182,692 | 7% |
1,851 Properties |
| 2016 | £169,008 | 5% |
1,898 Properties |
| 2015 | £161,259 | 2% |
1,869 Properties |
| 2014 | £157,287 | 4% |
1,817 Properties |
| 2013 | £150,532 | -1% |
1,503 Properties |
| 2012 | £151,699 | 4% |
1,214 Properties |
| 2011 | £145,849 | -3% |
1,325 Properties |
| 2010 | £150,606 | 4% |
1,224 Properties |
| 2009 | £144,669 | -3% |
1,145 Properties |
| 2008 | £148,783 | -5% |
1,162 Properties |
| 2007 | £156,488 | 10% |
2,455 Properties |
| 2006 | £140,433 | 6% |
2,414 Properties |
| 2005 | £132,596 | 2% |
2,092 Properties |
| 2004 | £130,385 | 15% |
2,345 Properties |
| 2003 | £110,454 | 19% |
2,492 Properties |
| 2002 | £89,088 | 19% |
2,489 Properties |
| 2001 | £71,895 | 13% |
2,497 Properties |
| 2000 | £62,274 | 11% |
2,211 Properties |
| 1999 | £55,138 | 4% |
2,162 Properties |
| 1998 | £52,999 | 5% |
1,929 Properties |
| 1997 | £50,610 | 10% |
2,074 Properties |
| 1996 | £45,577 | -3% |
1,758 Properties |
| 1995 | £47,052 | - |
1,530 Properties |
Property Price per Property Type in Great Yarmouth
Here you can find historic sold price data in order to help with your property search.
The average Property Paid Price for specific property types in the last three years are:
| Property Type | Average Sold Price | Sold Properties |
|---|---|---|
| Semi Detached House | £235,614.00 | 963 Semi Detached Houses |
| Terraced House | £159,914.00 | 1,621 Terraced Houses |
| Detached House | £337,311.00 | 1,236 Detached Houses |
| Flat | £106,340.00 | 205 Flats |

