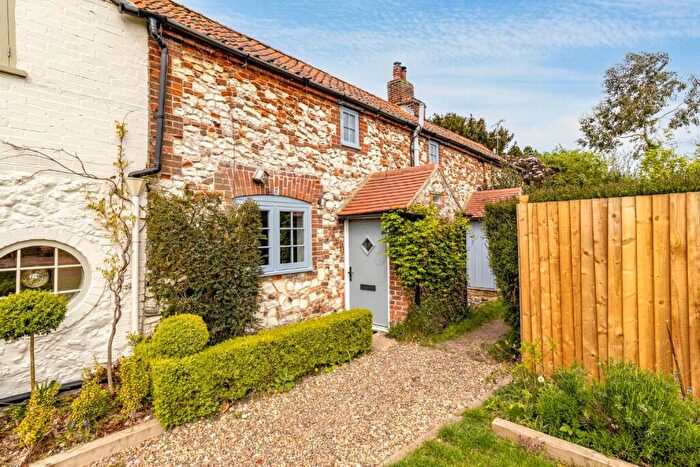
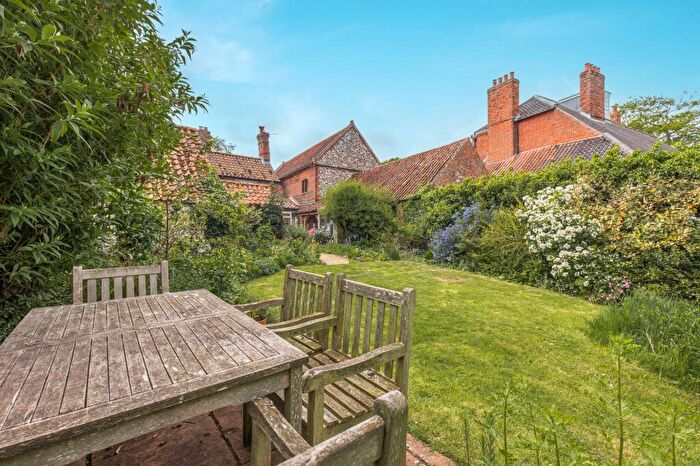
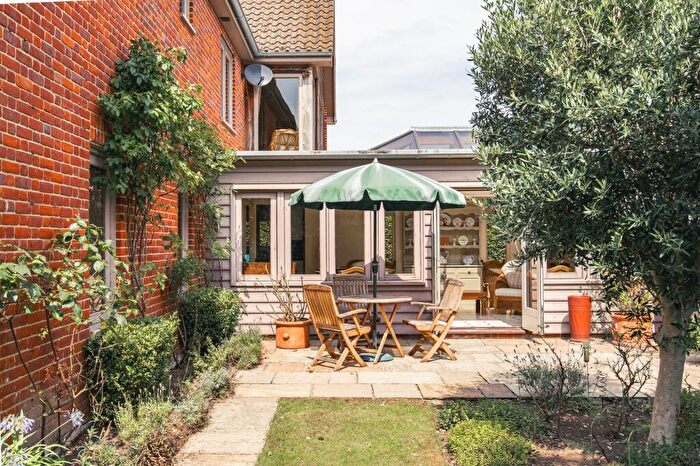
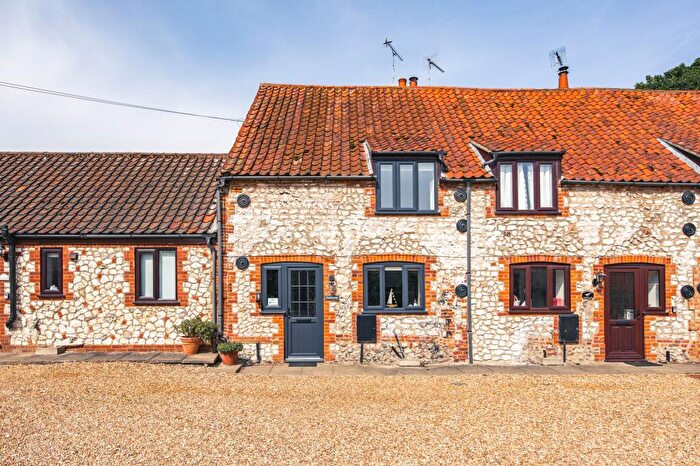
Houses for sale & to rent in Brancaster, Hunstanton
House Prices in Brancaster
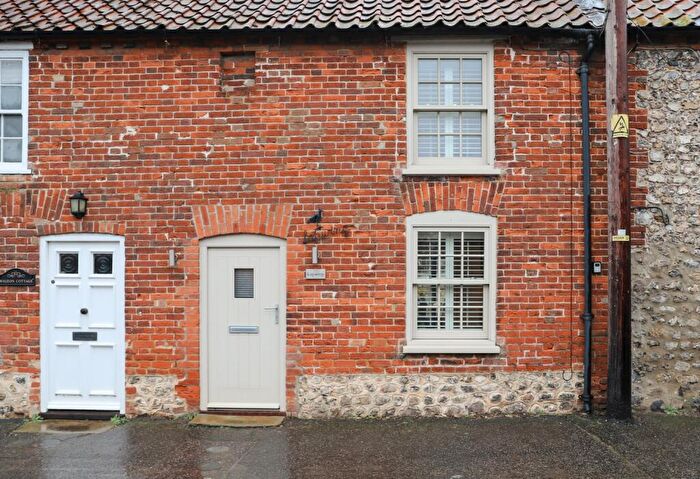
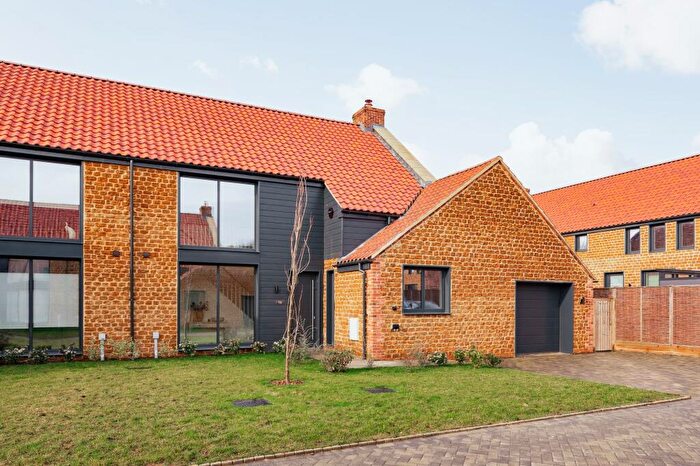
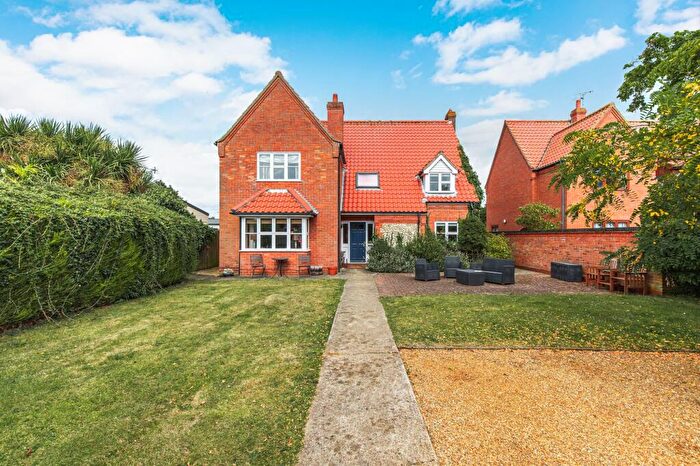
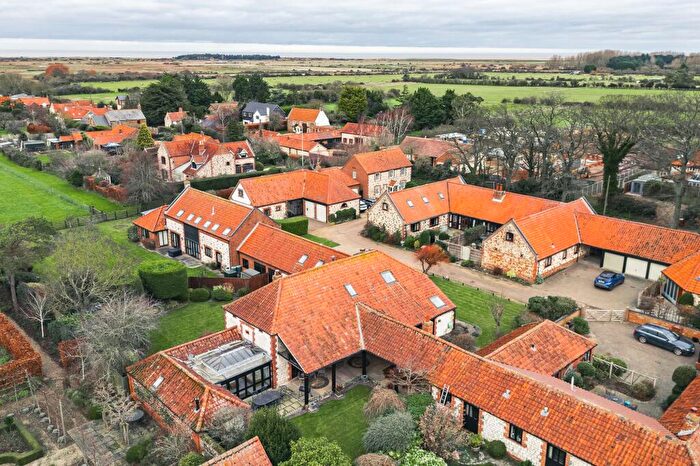
Properties in Brancaster have an average house price of £917,034.00 and had 22 Property Transactions within the last 3 years¹.
Brancaster is an area in Hunstanton, Norfolk with 241 households², where the most expensive property was sold for £2,250,000.00.
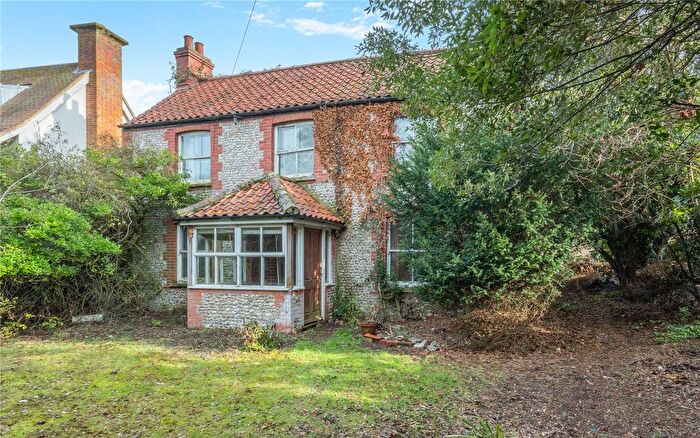
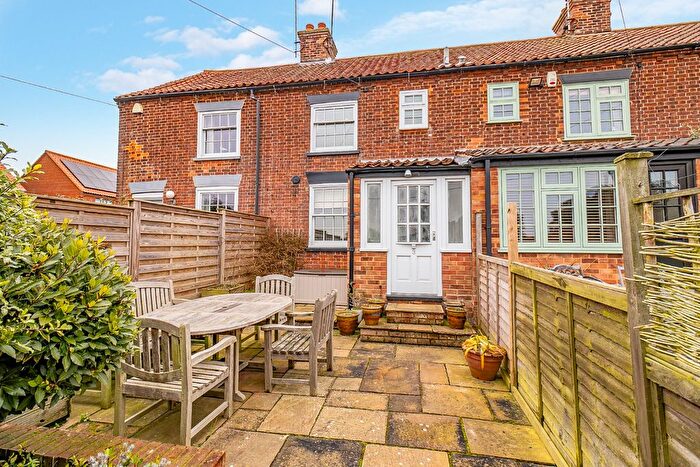
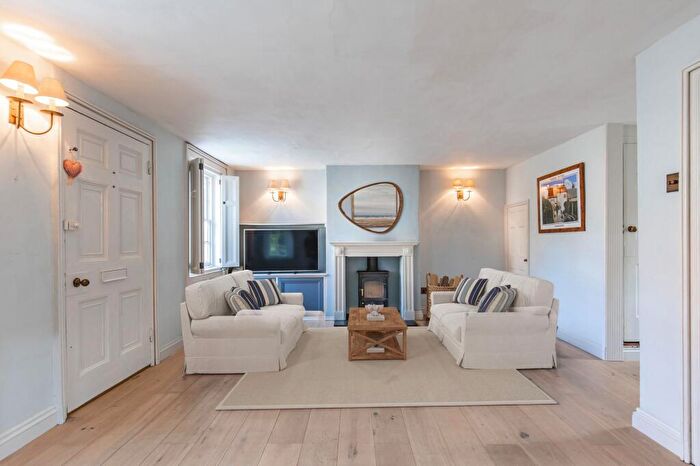
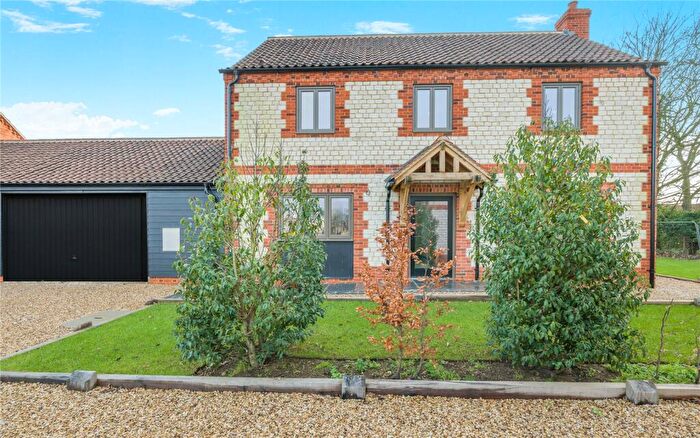
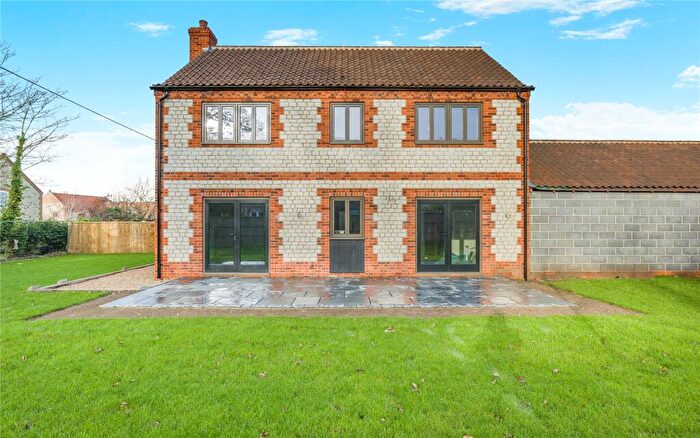
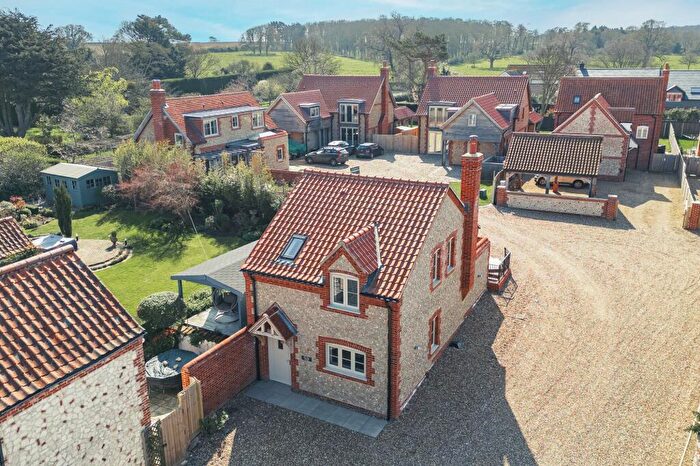
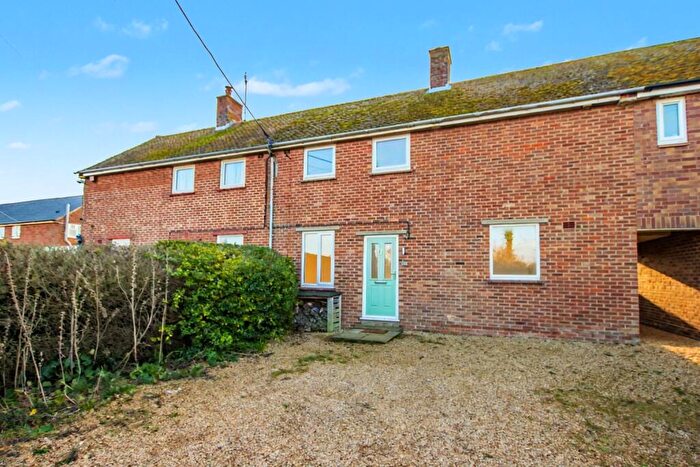
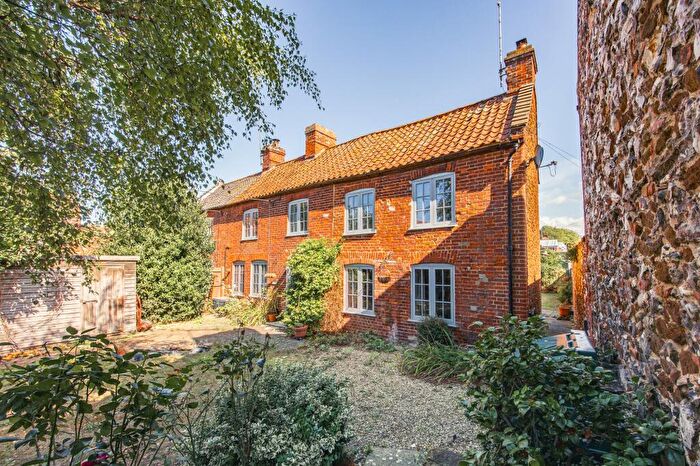
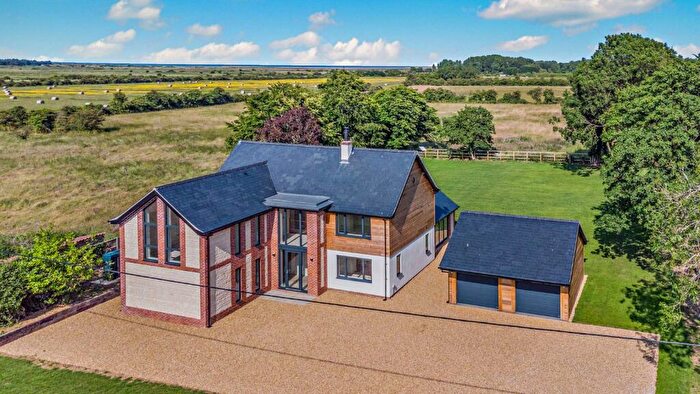
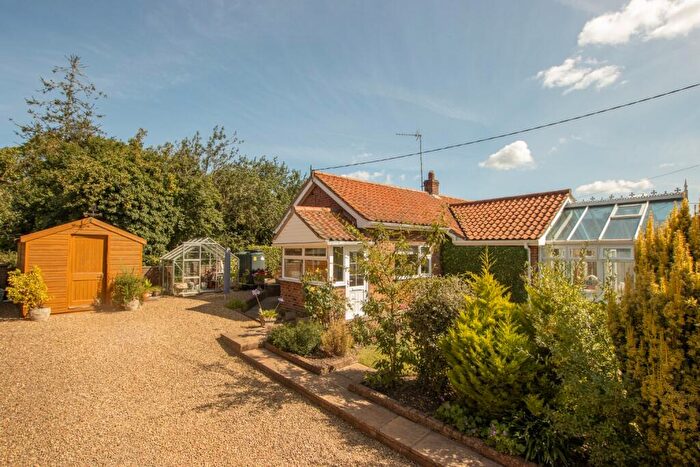
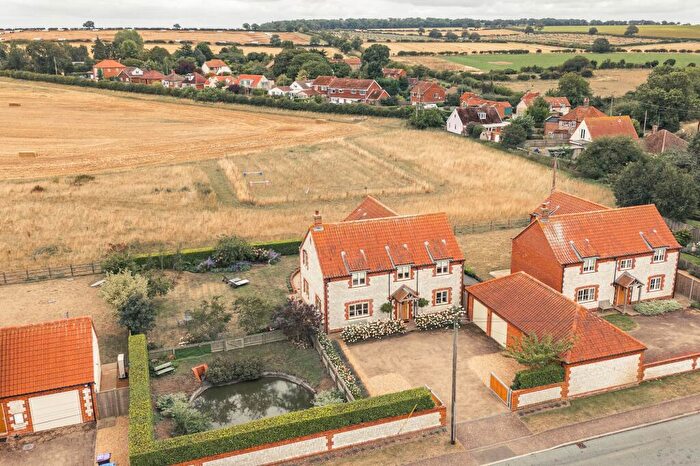
Properties for sale in Brancaster
Roads and Postcodes in Brancaster
Navigate through our locations to find the location of your next house in Brancaster, Hunstanton for sale or to rent.
| Streets | Postcodes |
|---|---|
| Beacon Hill | PE36 5LJ |
| Busseys Lane | PE36 6NU |
| Castle Cottages | PE36 6NF |
| Chalk Pit Road | PE36 6LW |
| Chapel Bank | PE36 6JT |
| Choseley Road | PE36 6ND |
| Church Road | PE36 6JR |
| Church Street | PE36 6NJ |
| Clock Row | PE36 6LX |
| Council Houses | PE36 6NQ |
| Downs Road | PE36 5NY PE36 5NZ |
| Folgate Close | PE36 6NY |
| Golf Course Road | PE36 6JJ PE36 6JQ |
| Green Lane | PE36 6NG |
| Hall Lane | PE36 6NB |
| High Street | PE36 6LY |
| Holme Road | PE36 5JS |
| Hunstanton Road | PE36 5JN PE36 5JT |
| Malthouse Court | PE36 6NW |
| Old Field Lane | PE36 6NZ |
| Old Hunstanton Road | PE36 6HH PE36 6HU |
| Old School Court | PE36 6JZ |
| Pastures Court | PE36 6PA |
| Ploughmans Piece | PE36 6NE |
| Priory Court | PE36 6NT |
| Ringstead Road | PE36 6NN PE36 5FD |
| Romarnie Cottages | PE36 6NP |
| Rush Meadow | PE36 6LZ |
| Shepherds Pightle | PE36 6NA |
| Ship Lane | PE36 6LT |
| St Georges Court | PE36 6NR |
| Staithe Lane | PE36 6NL |
| The Big Yard Road | PE36 6HT |
| The Green | PE36 6NH |
| The Square | PE36 6LB |
| West End Cottages | PE36 6LU |
| PE36 5LH PE36 5LQ |
Transport near Brancaster
- FAQ
- Price Paid By Year
- Property Type Price
Frequently asked questions about Brancaster
What is the average price for a property for sale in Brancaster?
The average price for a property for sale in Brancaster is £917,034. This amount is 142% higher than the average price in Hunstanton. There are 92 property listings for sale in Brancaster.
What streets have the most expensive properties for sale in Brancaster?
The streets with the most expensive properties for sale in Brancaster are St Georges Court at an average of £1,975,000, Ship Lane at an average of £1,542,500 and High Street at an average of £1,055,000.
What streets have the most affordable properties for sale in Brancaster?
The streets with the most affordable properties for sale in Brancaster are Castle Cottages at an average of £250,000, The Green at an average of £440,000 and Church Street at an average of £512,000.
Which train stations are available in or near Brancaster?
Some of the train stations available in or near Brancaster are King's Lynn, Skegness and Havenhouse.
Property Price Paid in Brancaster by Year
The average sold property price by year was:
| Year | Average Sold Price | Price Change |
Sold Properties
|
|---|---|---|---|
| 2025 | £722,900 | -28% |
5 Properties |
| 2024 | £927,656 | -9% |
8 Properties |
| 2023 | £1,015,444 | -9% |
9 Properties |
| 2022 | £1,106,918 | 32% |
11 Properties |
| 2021 | £753,132 | -1% |
21 Properties |
| 2020 | £764,152 | 8% |
23 Properties |
| 2019 | £704,916 | 26% |
18 Properties |
| 2018 | £525,111 | -2% |
18 Properties |
| 2017 | £535,833 | -7% |
9 Properties |
| 2016 | £571,418 | 11% |
11 Properties |
| 2015 | £508,571 | 11% |
14 Properties |
| 2014 | £451,209 | -10% |
12 Properties |
| 2013 | £496,600 | 36% |
15 Properties |
| 2012 | £318,437 | -23% |
16 Properties |
| 2011 | £392,125 | -1% |
12 Properties |
| 2010 | £395,965 | -11% |
16 Properties |
| 2009 | £440,833 | 18% |
15 Properties |
| 2008 | £363,384 | -21% |
13 Properties |
| 2007 | £438,768 | 29% |
13 Properties |
| 2006 | £311,750 | -33% |
26 Properties |
| 2005 | £415,843 | 27% |
16 Properties |
| 2004 | £305,002 | 29% |
18 Properties |
| 2003 | £217,477 | -22% |
12 Properties |
| 2002 | £265,787 | 7% |
22 Properties |
| 2001 | £246,500 | 46% |
24 Properties |
| 2000 | £133,285 | 18% |
14 Properties |
| 1999 | £109,466 | -4% |
20 Properties |
| 1998 | £114,135 | -8% |
13 Properties |
| 1997 | £123,714 | 26% |
14 Properties |
| 1996 | £92,063 | 30% |
19 Properties |
| 1995 | £64,430 | - |
17 Properties |
Property Price per Property Type in Brancaster
Here you can find historic sold price data in order to help with your property search.
The average Property Paid Price for specific property types in the last three years are:
| Property Type | Average Sold Price | Sold Properties |
|---|---|---|
| Detached House | £1,096,766.00 | 15 Detached Houses |
| Terraced House | £591,400.00 | 5 Terraced Houses |
| Semi Detached House | £383,125.00 | 2 Semi Detached Houses |

