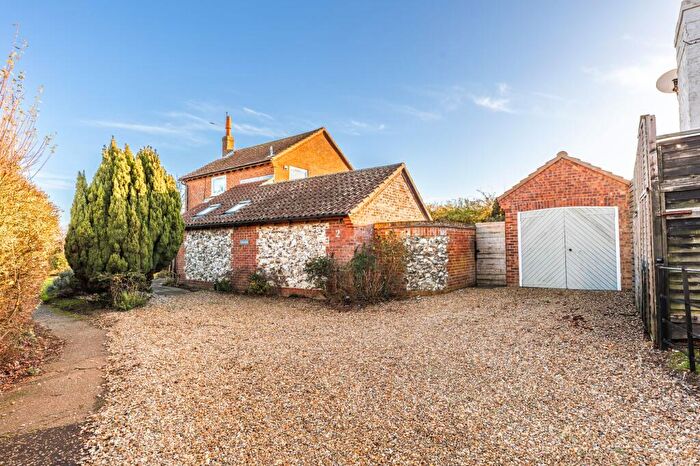
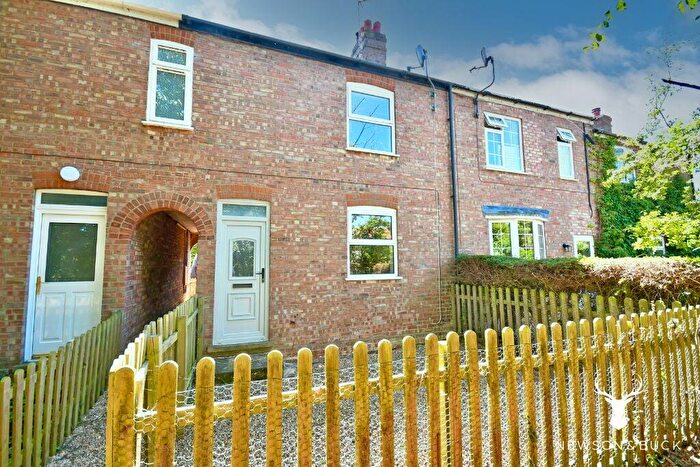
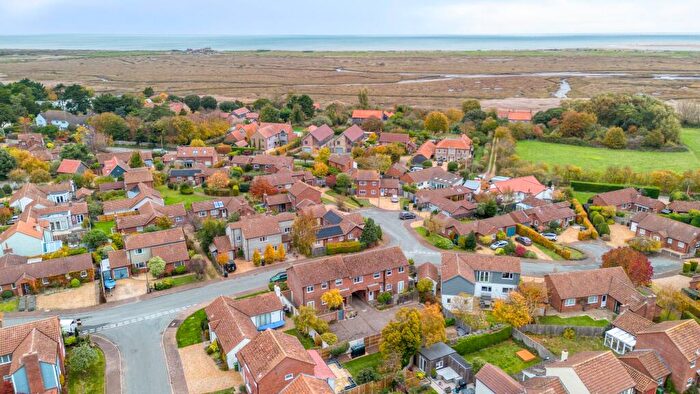
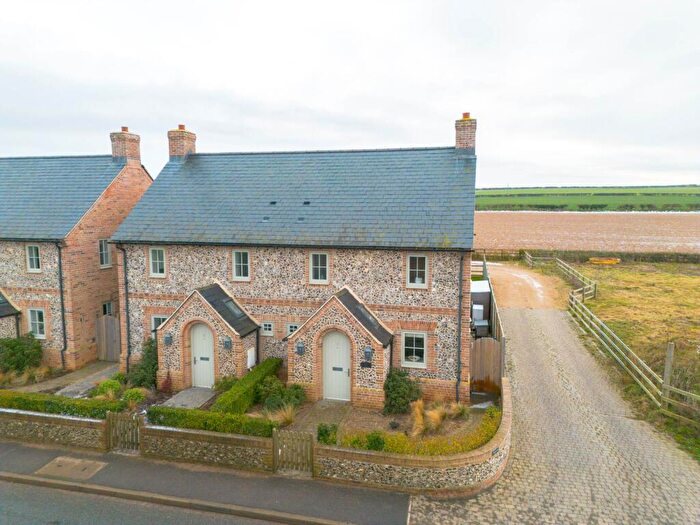
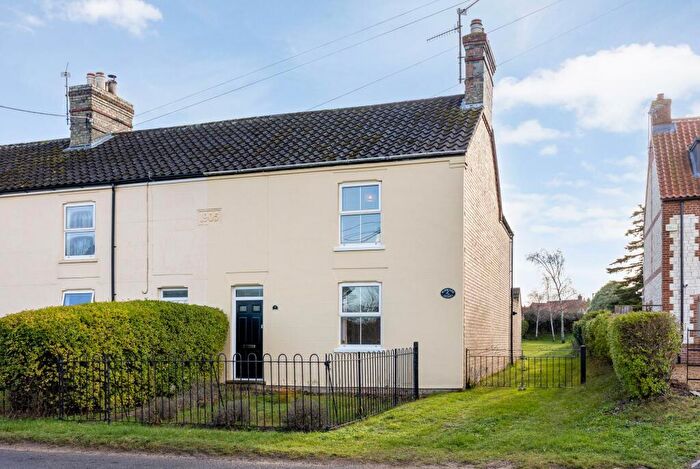
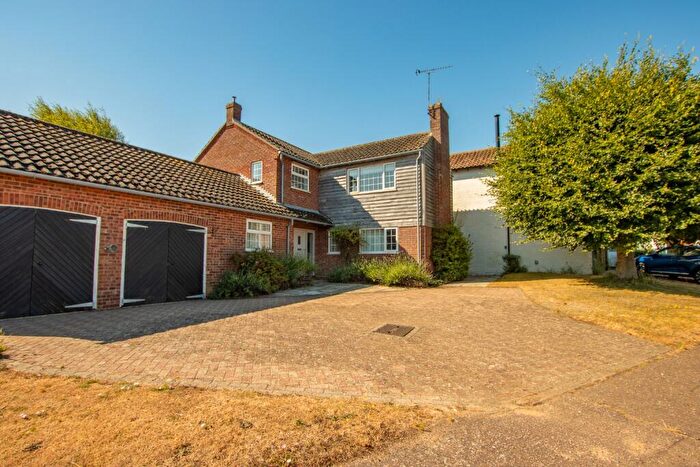
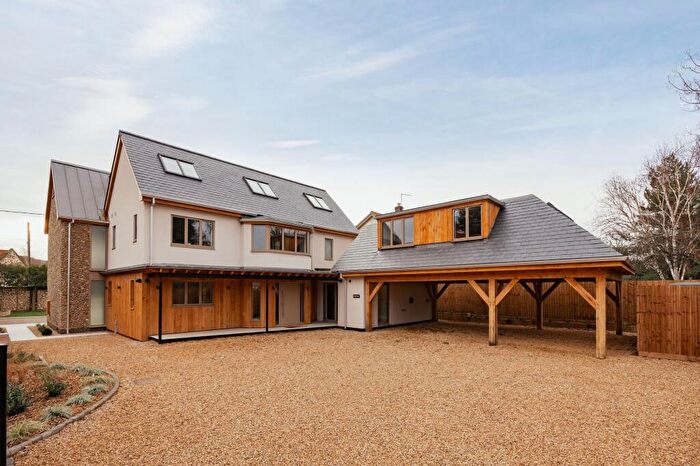
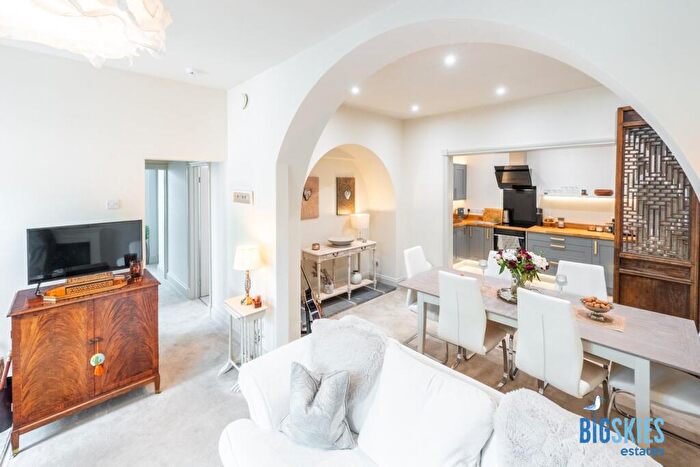
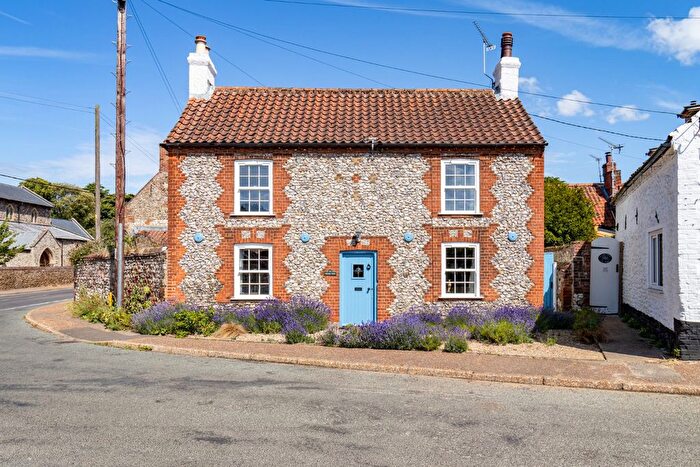
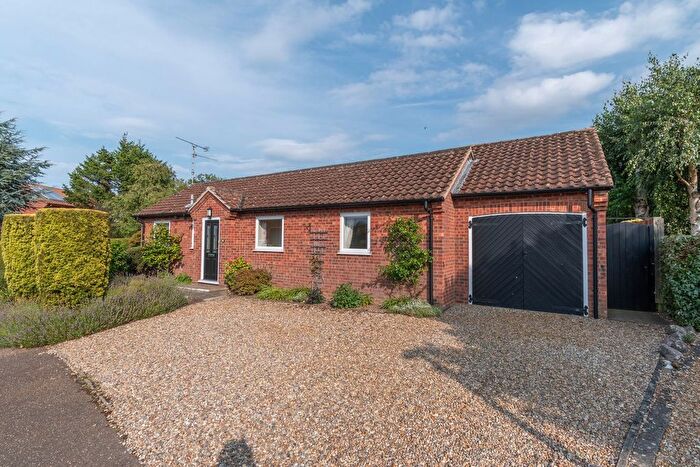
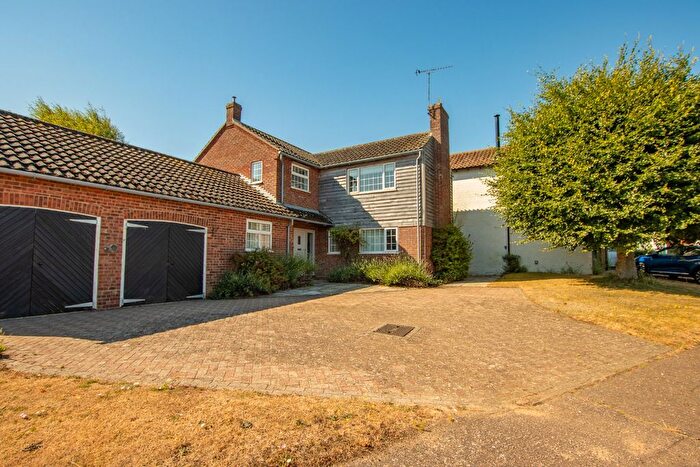
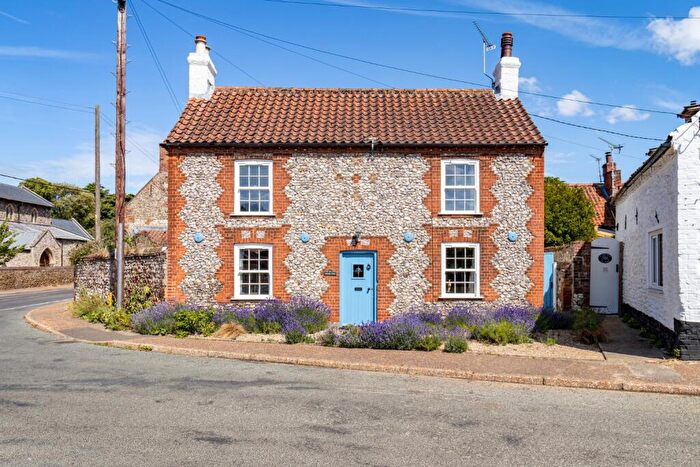
Houses for sale & to rent in Brancaster, Kings Lynn
House Prices in Brancaster
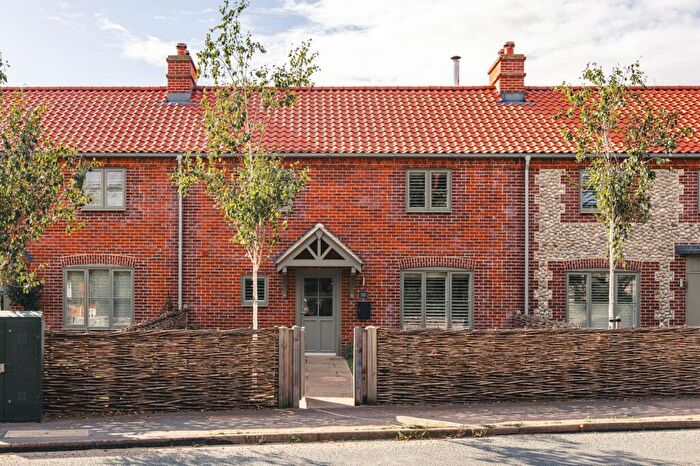
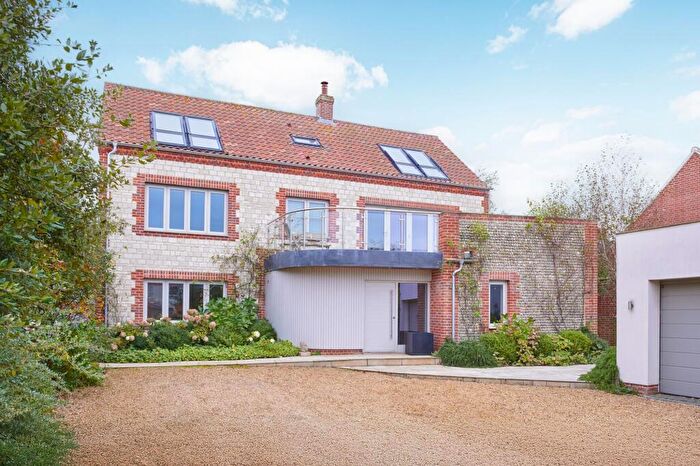
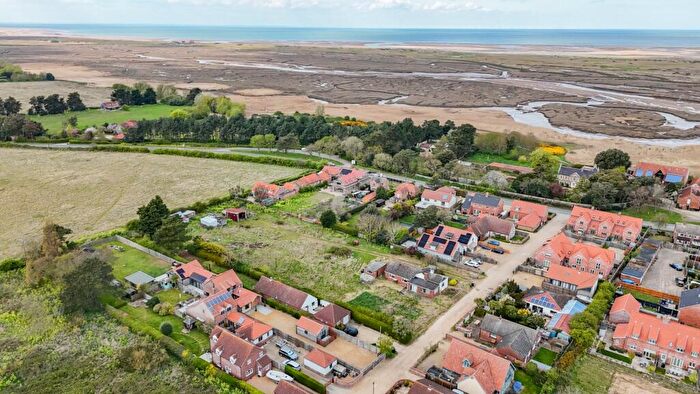
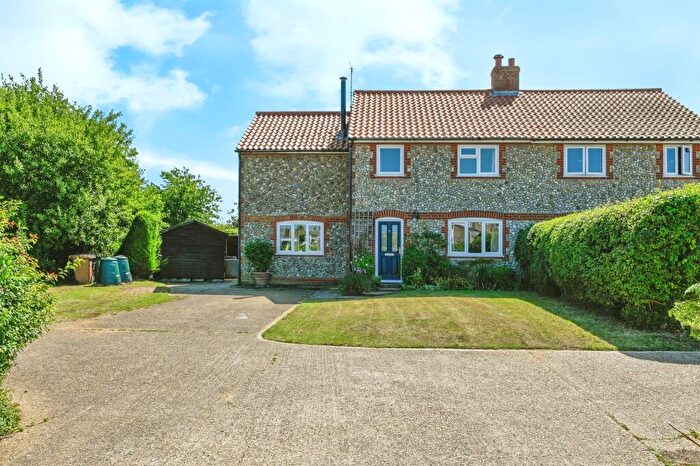
Properties in Brancaster have an average house price of £811,240.00 and had 55 Property Transactions within the last 3 years¹.
Brancaster is an area in Kings Lynn, Norfolk with 450 households², where the most expensive property was sold for £2,750,000.00.
Properties for sale in Brancaster
Previously listed properties in Brancaster
Roads and Postcodes in Brancaster
Navigate through our locations to find the location of your next house in Brancaster, Kings Lynn for sale or to rent.
| Streets | Postcodes |
|---|---|
| Anchorage View | PE31 8XD |
| Beach Road | PE31 8AX |
| Boughey Close | PE31 8AH |
| Branodunum | PE31 8AL |
| Brentwood | PE31 8BZ |
| Broad Lane | PE31 8AU |
| Butchers Lane | PE31 8AT |
| Chalk Pit Lane | PE31 8BE |
| Choseley | PE31 8PQ |
| Choseley Road | PE31 8AY |
| Church Lane | PE31 8BA |
| Common Lane | PE31 8BL |
| Cross Lane | PE31 8AE |
| Dale End | PE31 8DA |
| Dalegate Road | PE31 8EE PE31 8DG PE31 8FD |
| Docking Road | PE31 8FU |
| Field House Farm | PE31 8AG |
| Hall Lane | PE31 8AF |
| Hempland Close | PE31 8BH |
| Links Court | PE31 8BG |
| London Street | PE31 8AR PE31 8AS |
| Main Road | PE31 8AA PE31 8AP PE31 8AZ PE31 8BB PE31 8BJ PE31 8BP PE31 8BU PE31 8BX PE31 8BY PE31 8DD PE31 8ED PE31 8GG |
| Market Lane | PE31 8AB |
| Marsh Drove | PE31 8FY |
| Marshside | PE31 8AD |
| Mill Hill | PE31 8AQ |
| Mill Road | PE31 8AN PE31 8AW |
| Old Roman Walk | PE31 8XE |
| Orchard Close | PE31 8BN |
| Powells Yard | PE31 8FN |
| Roman Way | PE31 8XA |
| Saw Mill Road | PE31 8AJ |
| Saxon Field | PE31 8DZ |
| School Pastures | PE31 8DF |
| South Corner | PE31 8XB |
| The Close | PE31 8BS |
| The Cricket Pastures | PE31 8DQ |
| The Drove | PE31 8FH |
| Thornham Road | PE31 8FX |
| Town Farm Close | PE31 8BQ |
| Town Lane | PE31 8BT |
| White City | PE31 8BD |
| Whiteway Road | PE31 8FG |
| PE31 8BW PE31 8DE PE31 8DB PE31 8FB |
Transport near Brancaster
- FAQ
- Price Paid By Year
- Property Type Price
Frequently asked questions about Brancaster
What is the average price for a property for sale in Brancaster?
The average price for a property for sale in Brancaster is £811,240. This amount is 171% higher than the average price in Kings Lynn. There are 68 property listings for sale in Brancaster.
What streets have the most expensive properties for sale in Brancaster?
The streets with the most expensive properties for sale in Brancaster are Broad Lane at an average of £2,003,333, Town Farm Close at an average of £1,525,000 and Cross Lane at an average of £1,353,333.
What streets have the most affordable properties for sale in Brancaster?
The streets with the most affordable properties for sale in Brancaster are Marshside at an average of £230,000, Roman Way at an average of £380,000 and Anchorage View at an average of £448,750.
Which train stations are available in or near Brancaster?
Some of the train stations available in or near Brancaster are King's Lynn, Skegness and Havenhouse.
Property Price Paid in Brancaster by Year
The average sold property price by year was:
| Year | Average Sold Price | Price Change |
Sold Properties
|
|---|---|---|---|
| 2025 | £563,573 | -69% |
18 Properties |
| 2024 | £952,448 | 5% |
21 Properties |
| 2023 | £904,529 | -13% |
16 Properties |
| 2022 | £1,024,119 | 28% |
15 Properties |
| 2021 | £733,362 | -5% |
30 Properties |
| 2020 | £771,314 | 18% |
42 Properties |
| 2019 | £630,391 | -1% |
33 Properties |
| 2018 | £639,621 | 9% |
37 Properties |
| 2017 | £579,948 | -16% |
34 Properties |
| 2016 | £674,000 | 34% |
33 Properties |
| 2015 | £442,520 | -47% |
24 Properties |
| 2014 | £649,395 | 27% |
37 Properties |
| 2013 | £476,805 | -6% |
41 Properties |
| 2012 | £506,241 | 2% |
24 Properties |
| 2011 | £495,976 | 18% |
30 Properties |
| 2010 | £404,254 | 28% |
25 Properties |
| 2009 | £290,062 | -10% |
32 Properties |
| 2008 | £320,380 | -18% |
20 Properties |
| 2007 | £378,032 | 8% |
38 Properties |
| 2006 | £346,422 | 9% |
34 Properties |
| 2005 | £313,553 | -13% |
35 Properties |
| 2004 | £352,915 | 31% |
33 Properties |
| 2003 | £241,815 | 14% |
36 Properties |
| 2002 | £207,026 | -20% |
34 Properties |
| 2001 | £248,864 | 32% |
37 Properties |
| 2000 | £169,605 | 26% |
30 Properties |
| 1999 | £124,913 | 10% |
49 Properties |
| 1998 | £112,465 | 22% |
29 Properties |
| 1997 | £88,208 | 12% |
24 Properties |
| 1996 | £77,304 | 9% |
54 Properties |
| 1995 | £70,351 | - |
24 Properties |
Property Price per Property Type in Brancaster
Here you can find historic sold price data in order to help with your property search.
The average Property Paid Price for specific property types in the last three years are:
| Property Type | Average Sold Price | Sold Properties |
|---|---|---|
| Semi Detached House | £714,571.00 | 7 Semi Detached Houses |
| Detached House | £1,008,886.00 | 31 Detached Houses |
| Terraced House | £500,316.00 | 15 Terraced Houses |
| Flat | £418,000.00 | 2 Flats |

