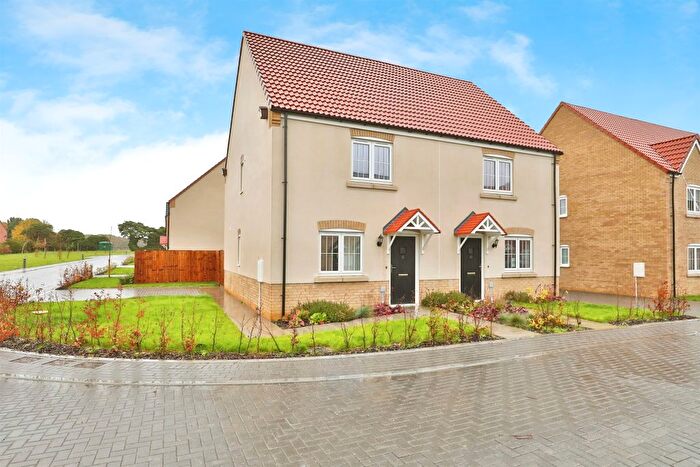
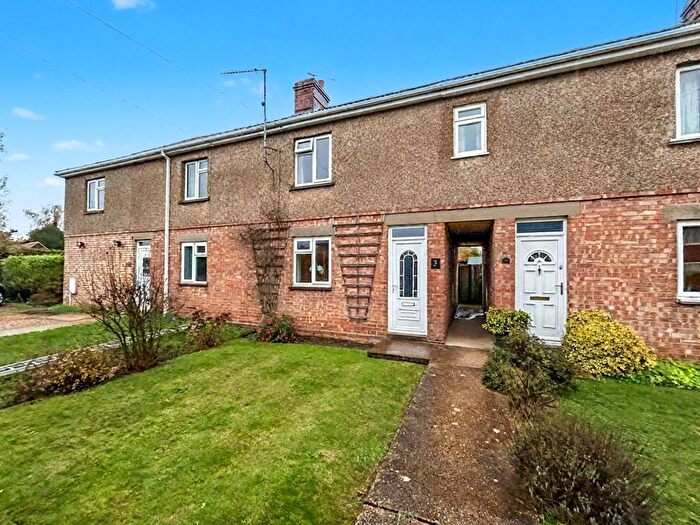
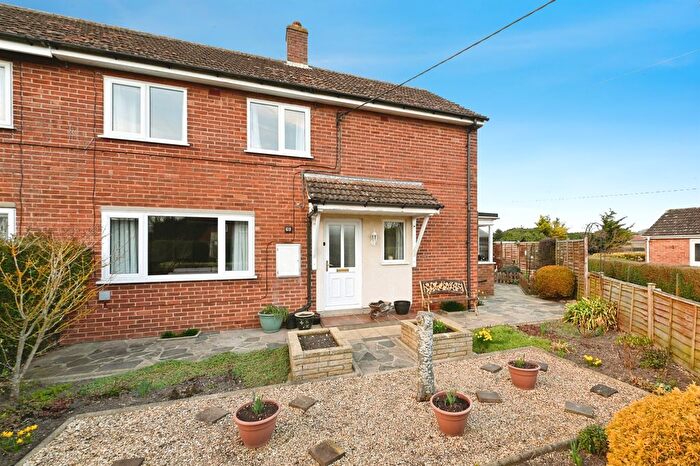
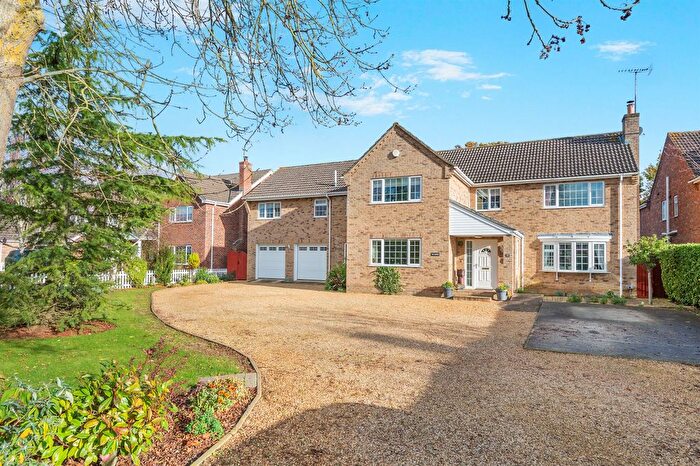
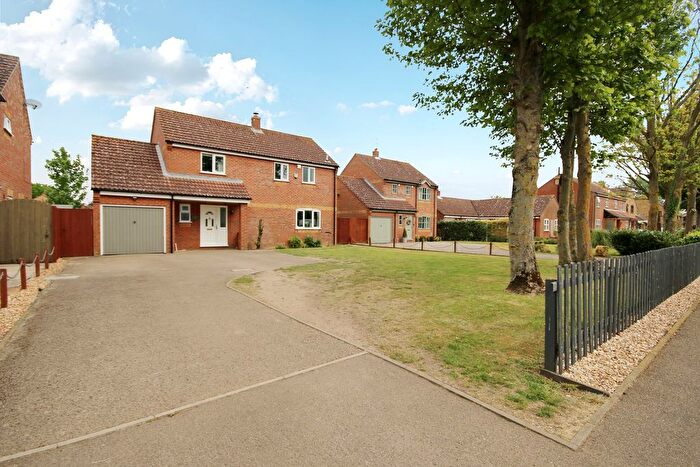
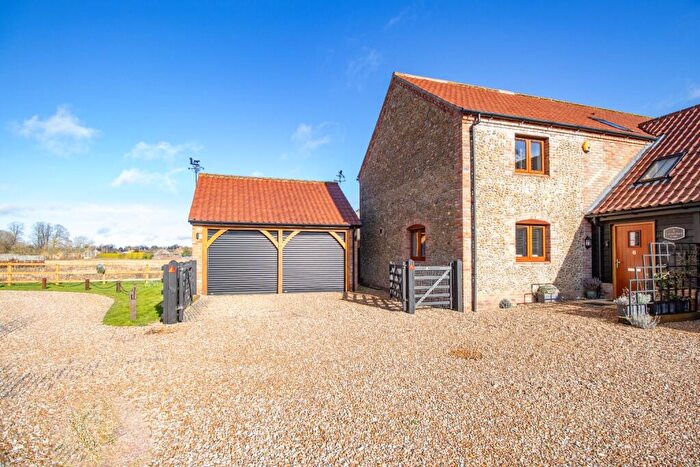
Houses for sale & to rent in Gayton, Kings Lynn
House Prices in Gayton
Properties in Gayton have an average house price of £397,058.00 and had 88 Property Transactions within the last 3 years¹.
Gayton is an area in Kings Lynn, Norfolk with 880 households², where the most expensive property was sold for £2,110,000.00.
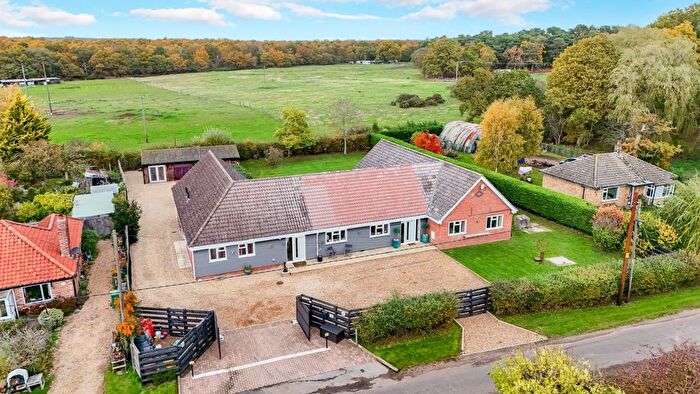
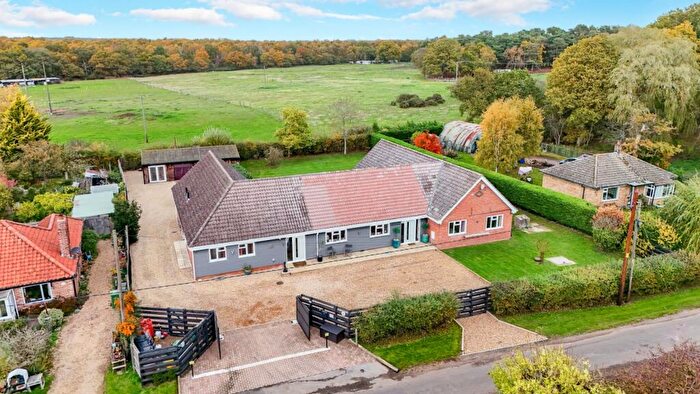
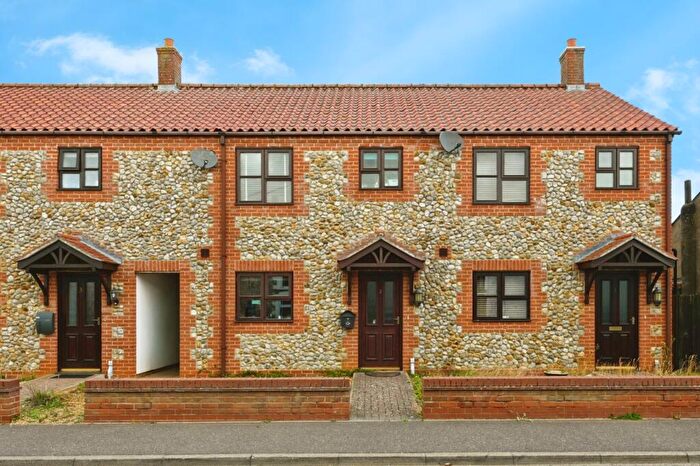
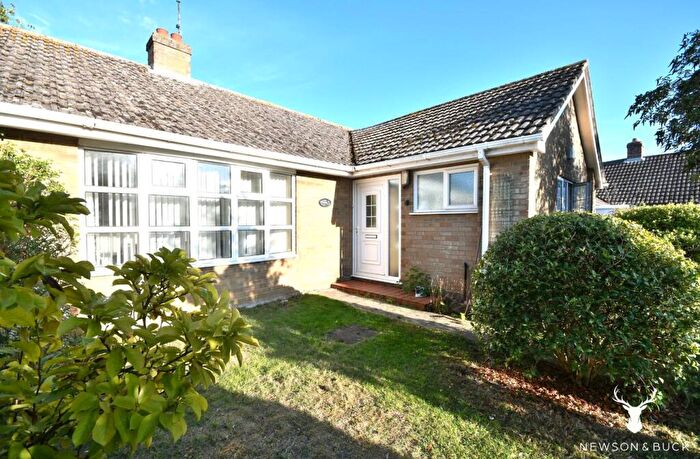
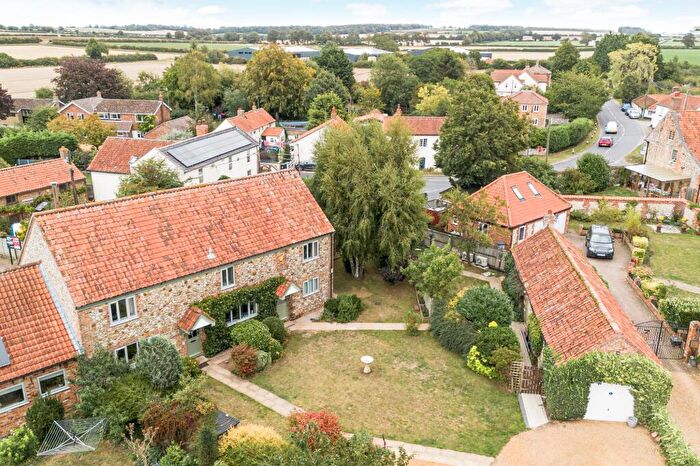
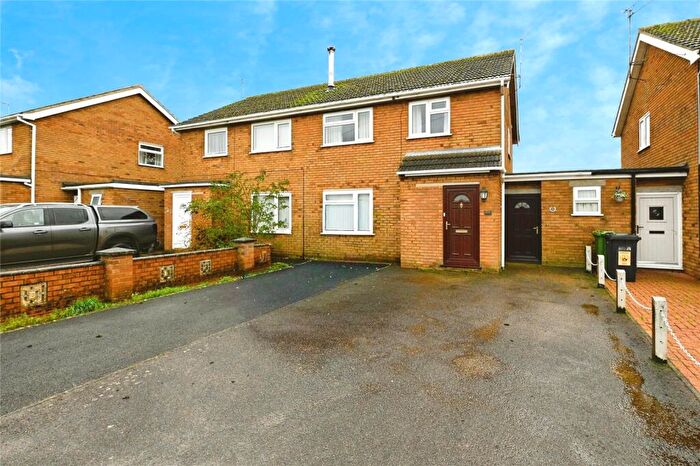
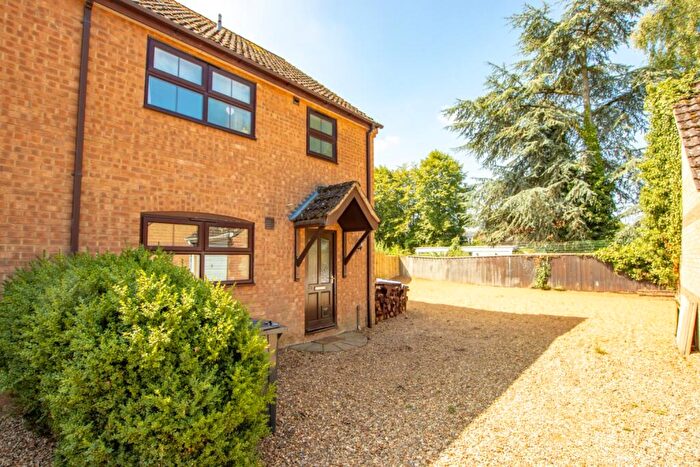
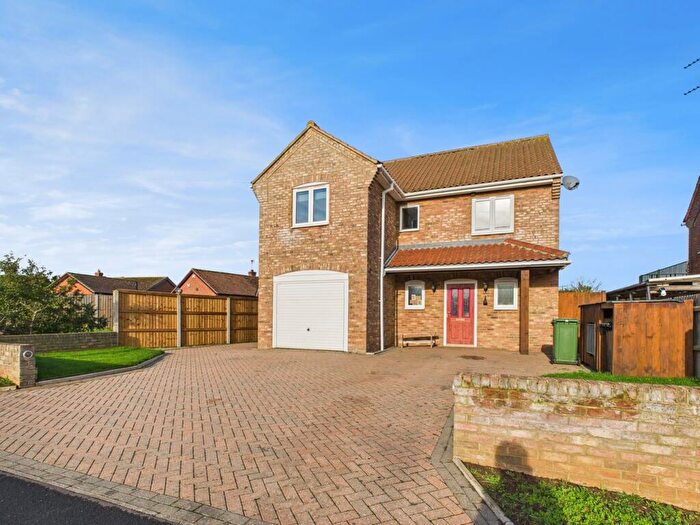
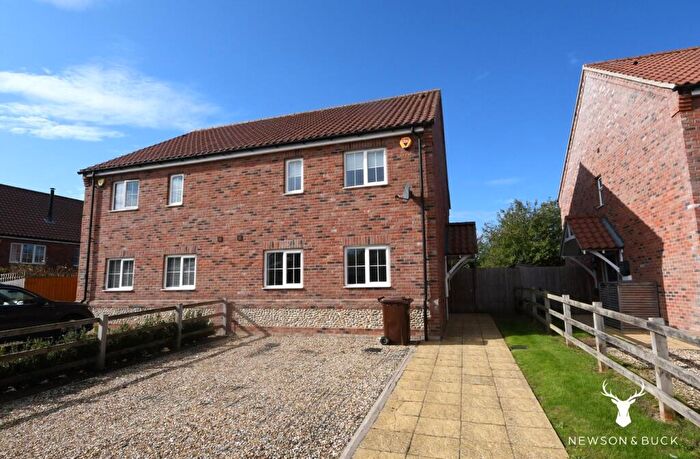
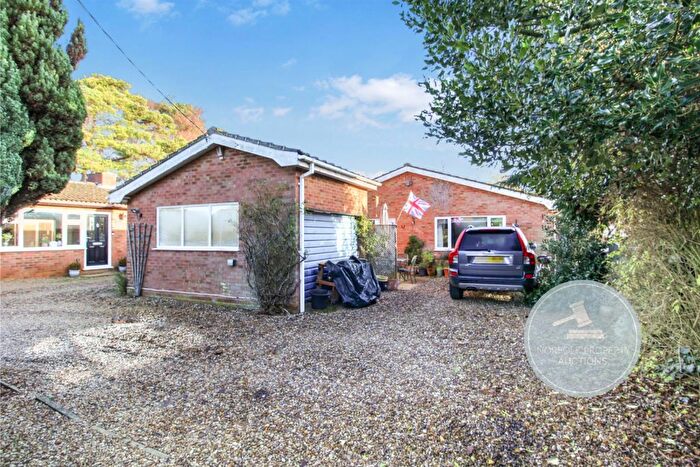
Properties for sale in Gayton
Roads and Postcodes in Gayton
Navigate through our locations to find the location of your next house in Gayton, Kings Lynn for sale or to rent.
| Streets | Postcodes |
|---|---|
| Acorn Drive | PE32 1XG |
| Back Street | PE32 1PJ PE32 1QR |
| Birch Road | PE32 1UN |
| Blacksmiths Row | PE32 1QL |
| Brick Cottages | PE32 1ER |
| Brow Of The Hill | PE32 1EN |
| Cedar Way | PE32 1UT |
| Chilver House Lane | PE32 1ES |
| Church Lane | PE32 1LN |
| Church Terrace | PE32 1PF |
| Common Lane | PE32 1PN |
| East Walton Road | PE32 1PH |
| East Winch Road | PE32 1LX PE32 1LZ PE32 1NA |
| Ebenezer Cottages | PE32 1QX |
| Fen Lane | PE32 1LR |
| Gayton Road | PE32 1EP PE32 1LS PE32 1LW |
| Glosthorpe Manor | PE32 1NB |
| Grimston Road | PE32 1PG PE32 1QA |
| Hall Farm Road | PE32 1RB |
| Hawthorn Road | PE32 1UW |
| Hills Crescent | PE32 1PE |
| Holt House Lane | PE32 1EL |
| Jubilee Hall Lane | PE32 1PB |
| Lansdowne Close | PE32 1QW |
| Leziate Drove | PE32 1LT PE32 1LU |
| Lime Grove | PE32 1QU |
| Lime Kiln Road | PE32 1QB PE32 1QT |
| Litcham Road | PE32 1PQ |
| Lynn Road | PE32 1EU PE32 1PA PE32 1QJ |
| Maple Close | PE32 1UP |
| Orchard Road | PE32 1PZ |
| Rosemary Lane | PE32 1QN |
| Rowan Drive | PE32 1UR |
| Springvale | PE32 1QY PE32 1QZ |
| St Nicholas Close | PE32 1QS |
| Station Road | PE32 1EJ |
| Waterworks Road | PE32 1QE |
| Well Hall Lane | PE32 1LP PE32 1QD |
| Winch Road | PE32 1QP |
Transport near Gayton
- FAQ
- Price Paid By Year
- Property Type Price
Frequently asked questions about Gayton
What is the average price for a property for sale in Gayton?
The average price for a property for sale in Gayton is £397,058. This amount is 31% higher than the average price in Kings Lynn. There are 325 property listings for sale in Gayton.
What streets have the most expensive properties for sale in Gayton?
The streets with the most expensive properties for sale in Gayton are Leziate Drove at an average of £970,000, East Winch Road at an average of £642,285 and Gayton Road at an average of £597,000.
What streets have the most affordable properties for sale in Gayton?
The streets with the most affordable properties for sale in Gayton are Blacksmiths Row at an average of £170,000, Maple Close at an average of £190,000 and St Nicholas Close at an average of £241,665.
Which train stations are available in or near Gayton?
Some of the train stations available in or near Gayton are King's Lynn, Watlington and Downham Market.
Property Price Paid in Gayton by Year
The average sold property price by year was:
| Year | Average Sold Price | Price Change |
Sold Properties
|
|---|---|---|---|
| 2025 | £267,000 | -66% |
13 Properties |
| 2024 | £442,553 | 3% |
28 Properties |
| 2023 | £427,728 | 11% |
26 Properties |
| 2022 | £378,937 | 6% |
21 Properties |
| 2021 | £355,872 | 11% |
36 Properties |
| 2020 | £316,926 | -5% |
41 Properties |
| 2019 | £333,625 | 10% |
40 Properties |
| 2018 | £300,175 | -4% |
28 Properties |
| 2017 | £313,159 | 13% |
47 Properties |
| 2016 | £272,333 | -7% |
35 Properties |
| 2015 | £290,209 | 21% |
28 Properties |
| 2014 | £229,378 | 12% |
39 Properties |
| 2013 | £201,600 | 12% |
20 Properties |
| 2012 | £177,875 | 3% |
20 Properties |
| 2011 | £173,223 | -32% |
29 Properties |
| 2010 | £229,456 | 5% |
23 Properties |
| 2009 | £217,858 | -35% |
18 Properties |
| 2008 | £294,815 | 21% |
19 Properties |
| 2007 | £233,507 | 8% |
37 Properties |
| 2006 | £214,290 | 7% |
33 Properties |
| 2005 | £200,152 | -9% |
45 Properties |
| 2004 | £217,909 | 29% |
43 Properties |
| 2003 | £154,747 | -4% |
42 Properties |
| 2002 | £160,856 | 12% |
50 Properties |
| 2001 | £141,472 | 22% |
42 Properties |
| 2000 | £110,749 | 17% |
51 Properties |
| 1999 | £92,424 | 6% |
50 Properties |
| 1998 | £86,885 | 20% |
41 Properties |
| 1997 | £69,711 | 11% |
48 Properties |
| 1996 | £62,303 | 11% |
50 Properties |
| 1995 | £55,423 | - |
26 Properties |
Property Price per Property Type in Gayton
Here you can find historic sold price data in order to help with your property search.
The average Property Paid Price for specific property types in the last three years are:
| Property Type | Average Sold Price | Sold Properties |
|---|---|---|
| Semi Detached House | £277,372.00 | 20 Semi Detached Houses |
| Detached House | £474,287.00 | 58 Detached Houses |
| Terraced House | £198,888.00 | 9 Terraced Houses |
| Flat | £95,000.00 | 1 Flat |

