
Houses for sale in Kings Lynn, Norfolk
House Prices in Kings Lynn
Properties in Kings Lynn have an average house price of £298k and had 4,502 Property Transactions within the last 3 years.¹
Kings Lynn is an area in Norfolk with 49,553 households², where the most expensive property was sold for £3.6M.
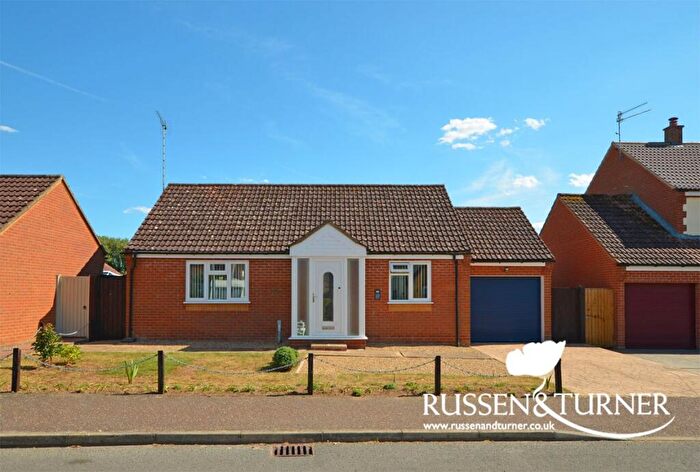
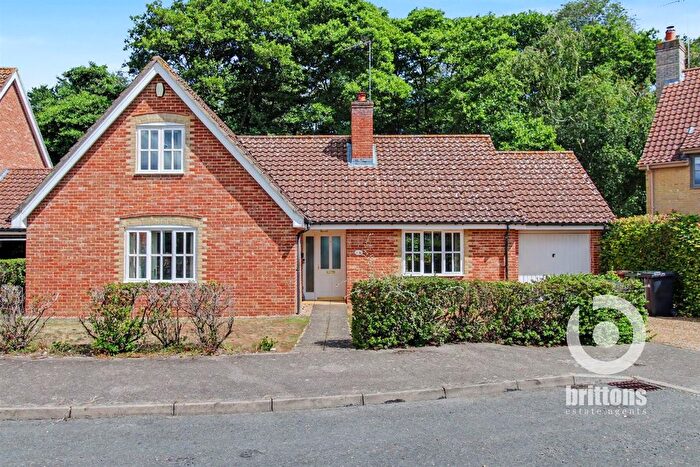
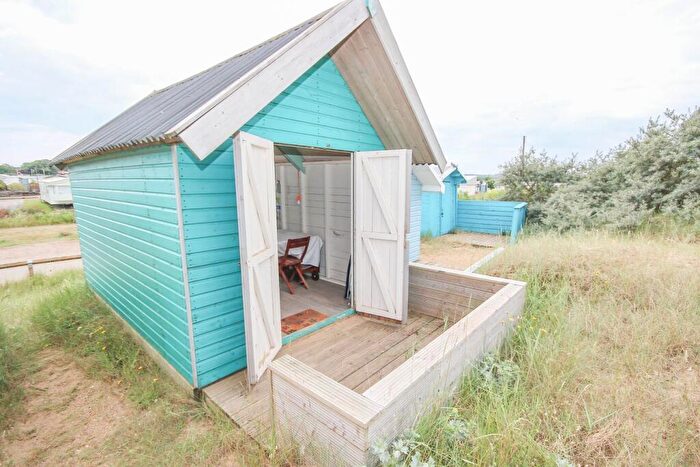
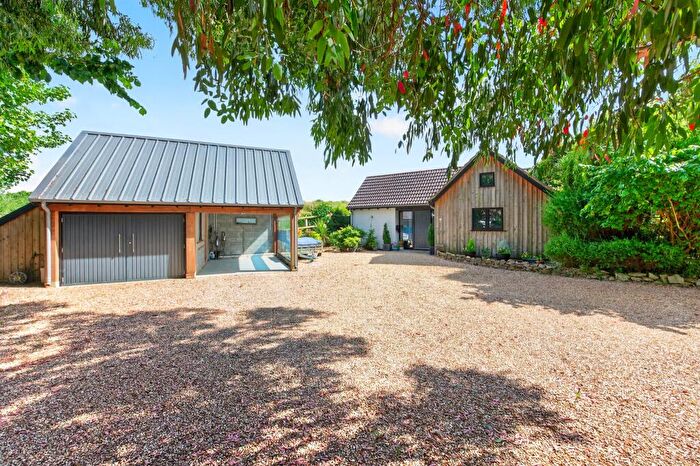
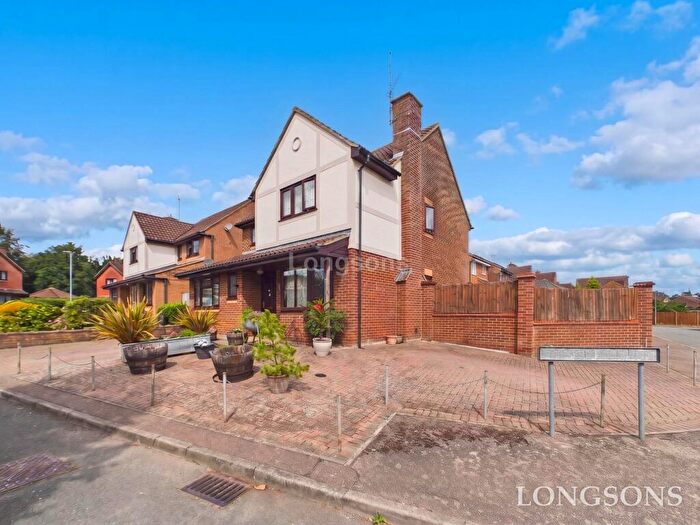
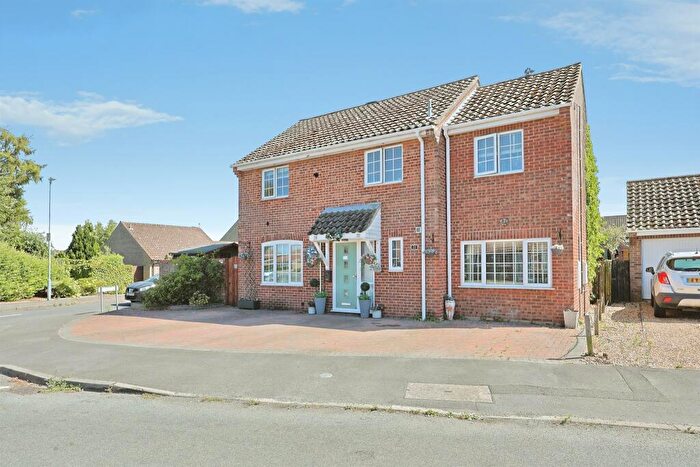
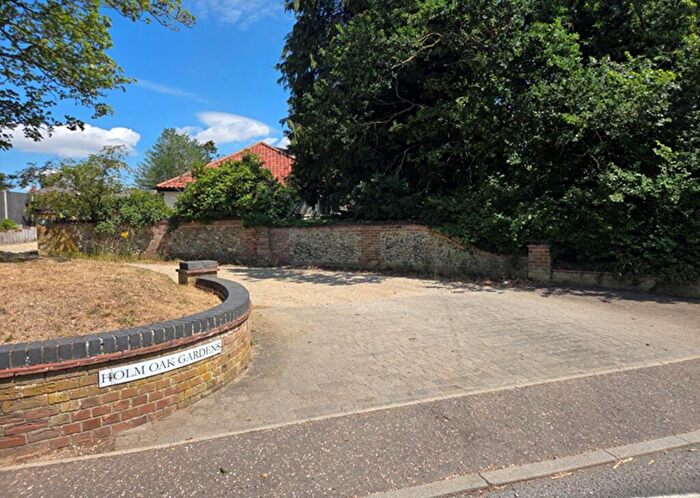
Properties for sale in Kings Lynn
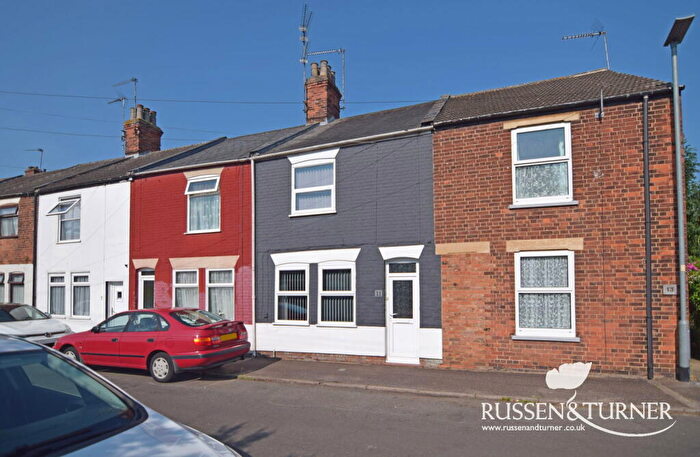
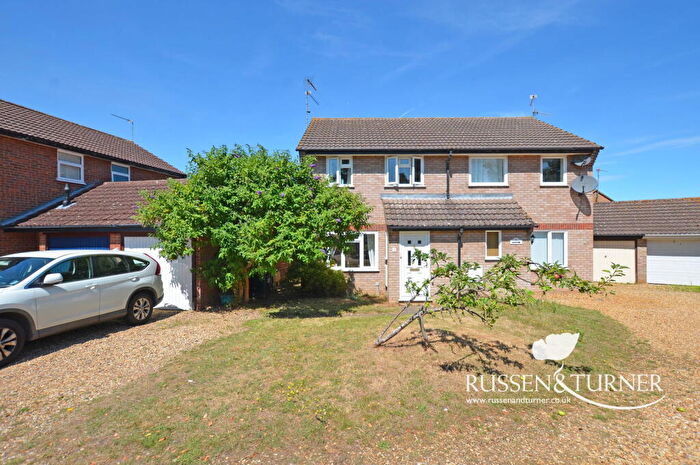
![]()
If you are looking to sell your house, let it out, or receive a property valuation, an expert can help you.
Click the button below to get started.
Neighbourhoods in Kings Lynn
Navigate through our locations to find the location of your next house in Kings Lynn, Norfolk for sale or to rent.
- Airfield
- Brancaster
- Burnham
- Clenchwarton
- Denton
- Dersingham
- Docking
- Fairstead
- Gayton
- Gaywood Chase
- Gaywood North Bank
- Grimston
- Heacham
- Hermitage
- Hilgay With Denver
- Launditch
- Mid Forest
- Nar Valley
- North Lynn
- North Wootton
- Old Gaywood
- Priory
- Rudham
- Snettisham
- South And West Lynn
- South Wootton
- Spellowfields
- Springwood
- St Lawrence
- St Margarets With St Nicholas
- Taverner
- The Raynhams
- Upwell And Delph
- Valley Hill
- Walpole
- Watlington
- West Winch
- Wiggenhall
- Wimbotsham With Fincham
- Wissey
- The Woottons
- Gayton & Grimston
- South & West Lynn
- Gaywood Clock
- Massingham with Castle Acre
- Bircham with Rudhams
- Burnham Market & Docking
- Denver
- Bedingfeld
- Methwold
- Tilney, Mershe Lande & Wiggenhall
- Upwell & Delph
- Terrington
Property price trends in Kings Lynn
According to the latest Land Registry data, the average home in Kings Lynn sold for £298,595 in 2026. That figure comes from a substantial record of 61,250 sales logged over the past 31 years.
Prices have held fairly steady over the last three years. Compared with 2023, when the typical sale came in around £301,144, values are broadly unchanged.
Looking back five years, average prices are up about 4.3% since 2021, a gain of around £12,232 in cash terms.
Zoom out to the past decade for the fuller picture. Back in 2016, homes here averaged £227,918, so the typical sold price has climbed about 31% since then, roughly 2.7% a year. Stretch the view to fifteen years and that annual pace edges up closer to 3.2%.
Frequently asked questions about Kings Lynn
What is the average price for a property for sale in Kings Lynn?
The average price for a property for sale in Kings Lynn is £297,845. This amount is 0.44% lower than the average price in Norfolk. There are more than 10,000 property listings for sale in Kings Lynn.
What locations have the most expensive properties for sale in Kings Lynn?
The locations with the most expensive properties for sale in Kings Lynn are Brancaster at an average of £795,520, Burnham at an average of £784,623 and Bircham with Rudhams at an average of £728,333.
What locations have the most affordable properties for sale in Kings Lynn?
The locations with the most affordable properties for sale in Kings Lynn are North Lynn at an average of £149,072, St Margarets With St Nicholas at an average of £158,523 and Fairstead at an average of £170,867.
Which train stations are available in or near Kings Lynn?
Some of the train stations available in or near Kings Lynn are King's Lynn, Watlington and Downham Market.
Property Price Paid in Kings Lynn by Year
The average sold property price by year was:
| Year | Average Sold Price | Price Change |
Sold Properties
|
|---|---|---|---|
| 2026 | £298,595 | 4% |
112 Properties |
| 2025 | £285,789 | -7% |
1,503 Properties |
| 2024 | £306,726 | 2% |
1,525 Properties |
| 2023 | £301,144 | -5% |
1,362 Properties |
| 2022 | £315,019 | 9% |
1,775 Properties |
| 2021 | £286,363 | 3% |
2,493 Properties |
| 2020 | £276,418 | 9% |
1,723 Properties |
| 2019 | £252,002 | 5% |
1,933 Properties |
| 2018 | £240,039 | 0,1% |
1,895 Properties |
| 2017 | £239,770 | 5% |
2,036 Properties |
Property Price per Property Type in Kings Lynn
Here you can find historic sold price data in order to help with your property search.
The average Property Paid Price for specific property types in the last three years are:
| Property Type | Average Sold Price | Sold Properties |
|---|---|---|
| Semi Detached House | £257,787.00 | 1,292 Semi Detached Houses |
| Terraced House | £212,861.00 | 1,051 Terraced Houses |
| Detached House | £390,016.00 | 1,947 Detached Houses |
| Flat | £116,796.00 | 212 Flats |
Transport in Kings Lynn
Please see below transportation links in this area:
