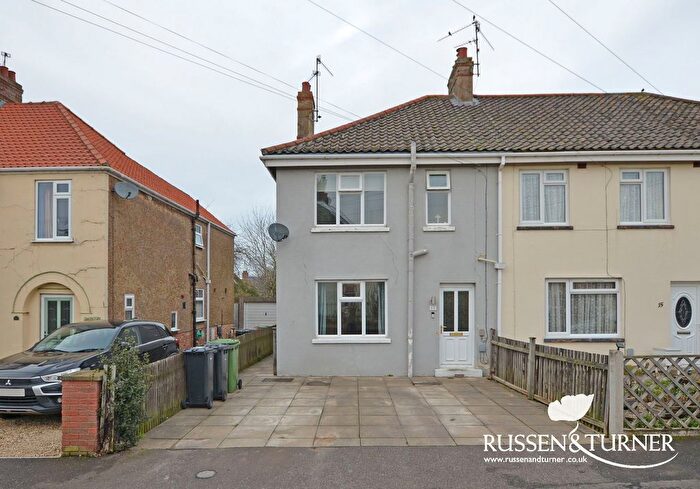
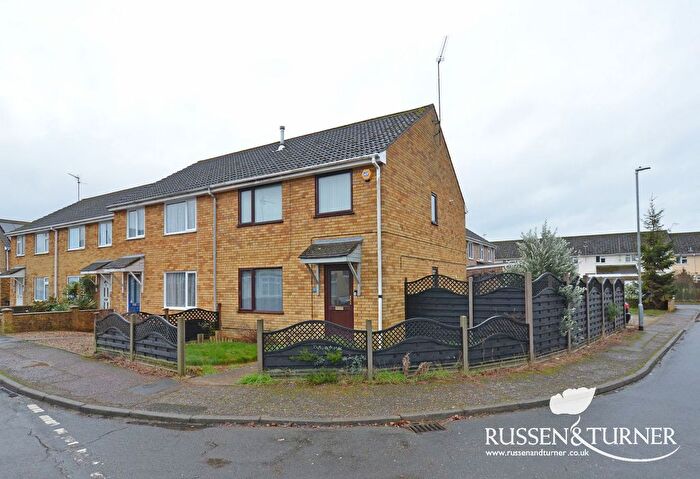
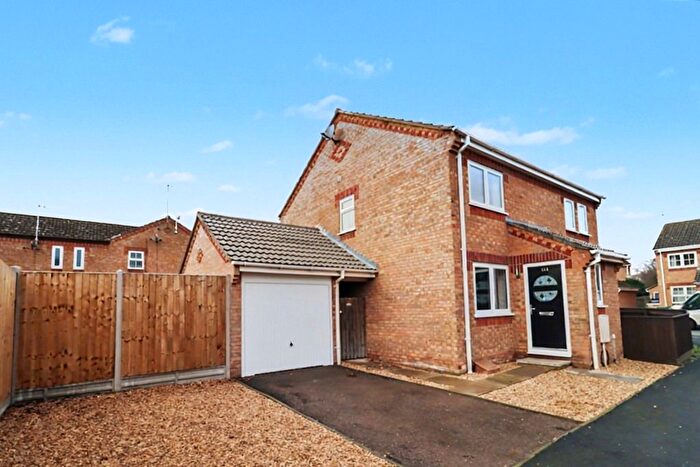
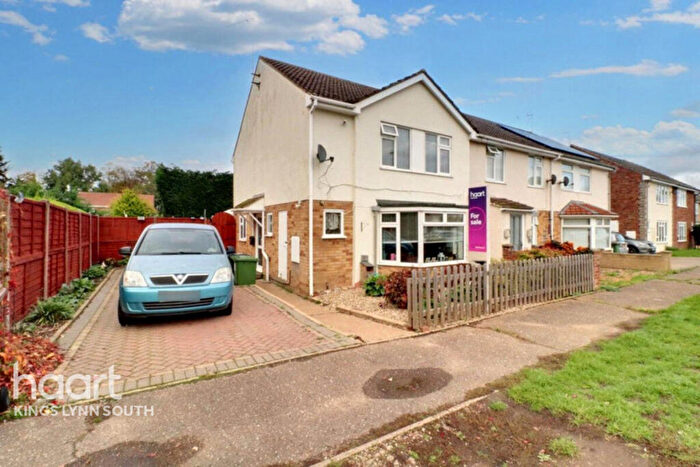
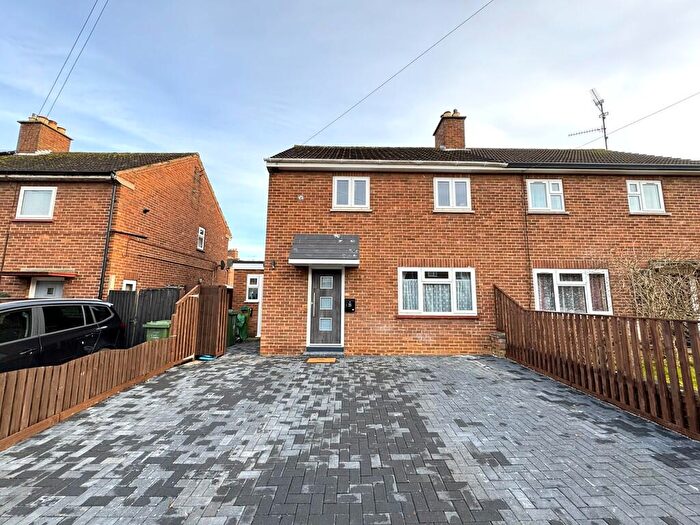
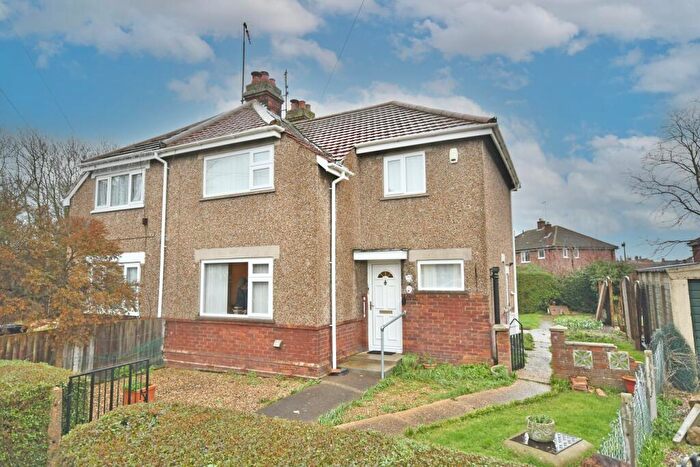
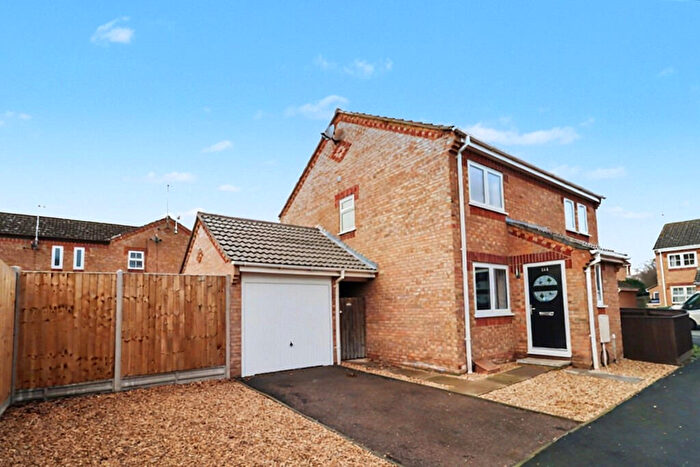
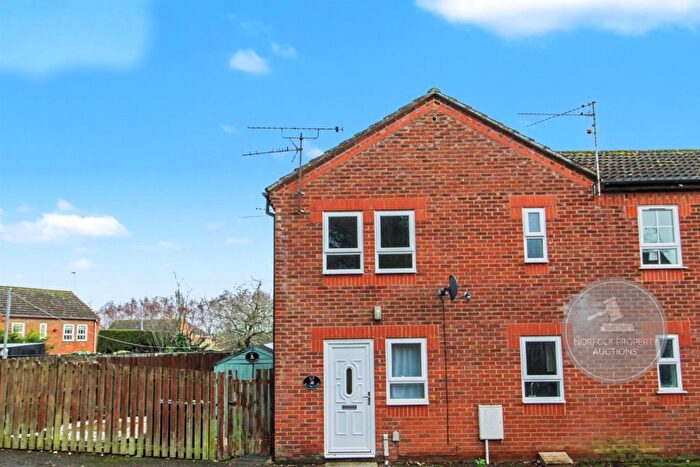
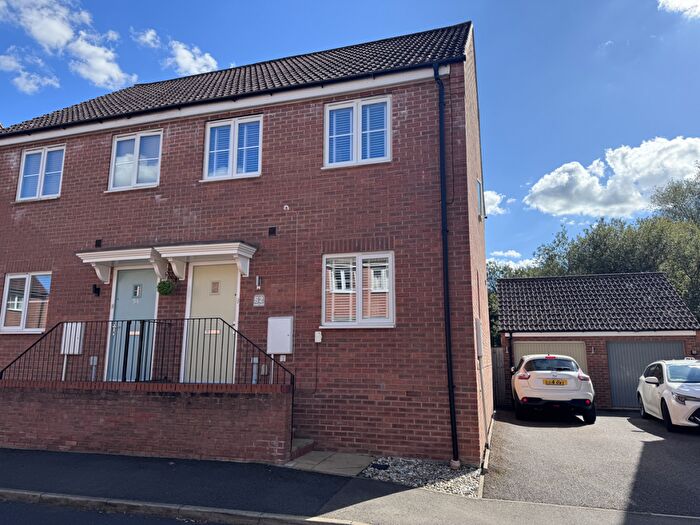
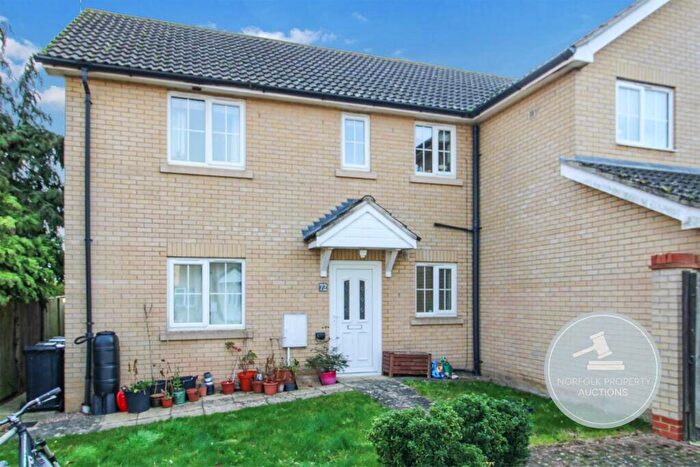
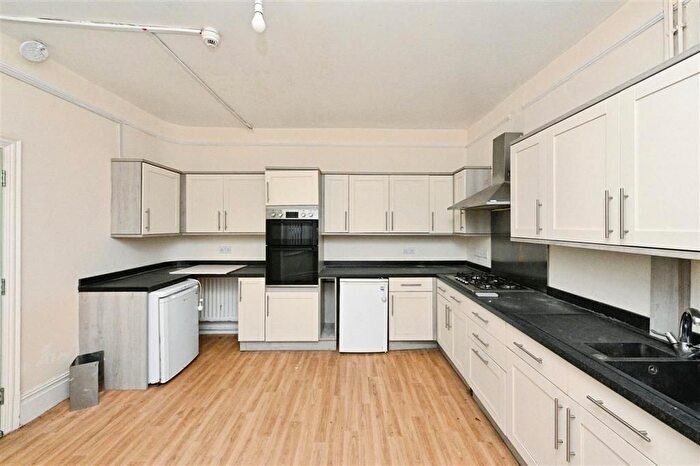
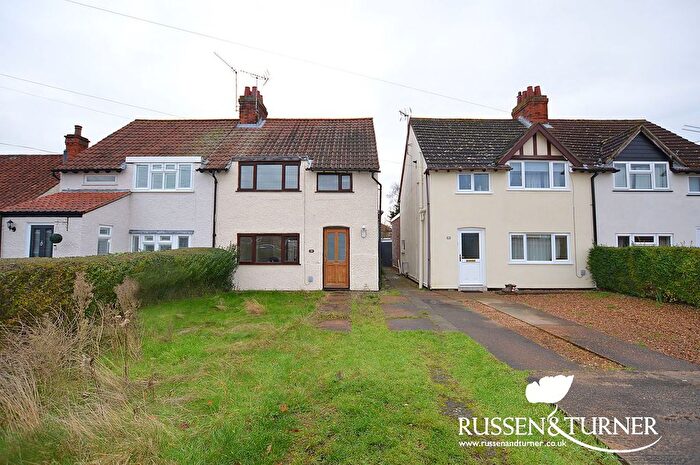
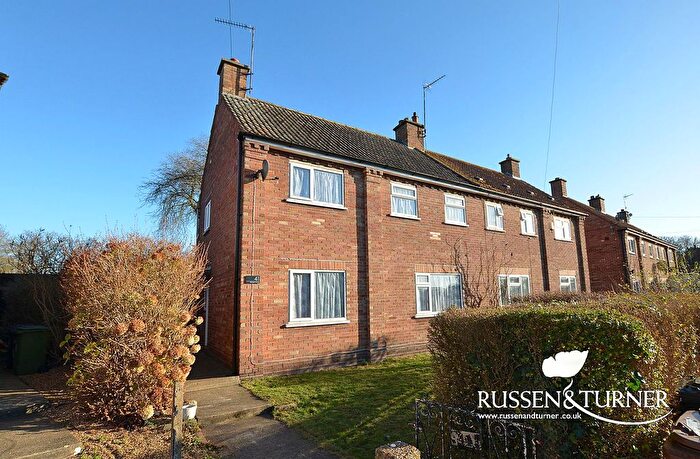
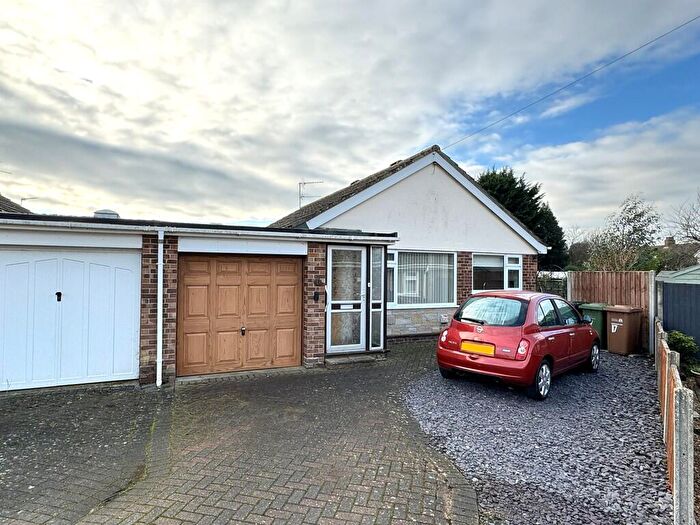
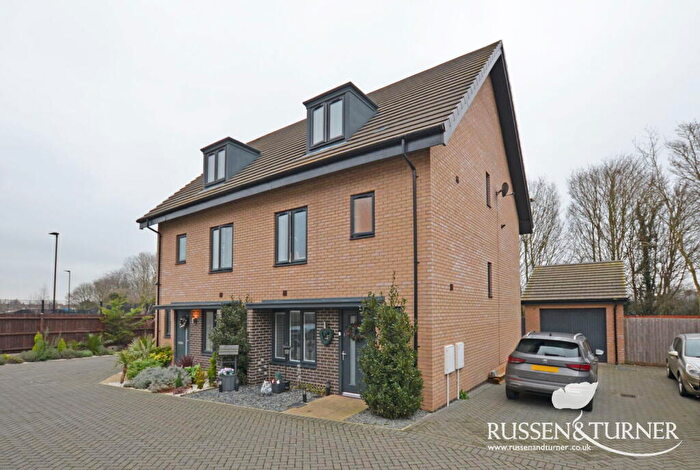
Houses for sale & to rent in Old Gaywood, Kings Lynn
House Prices in Old Gaywood
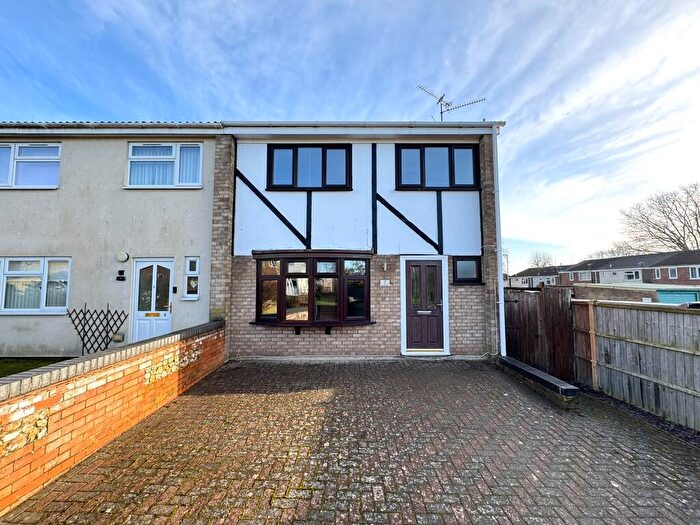
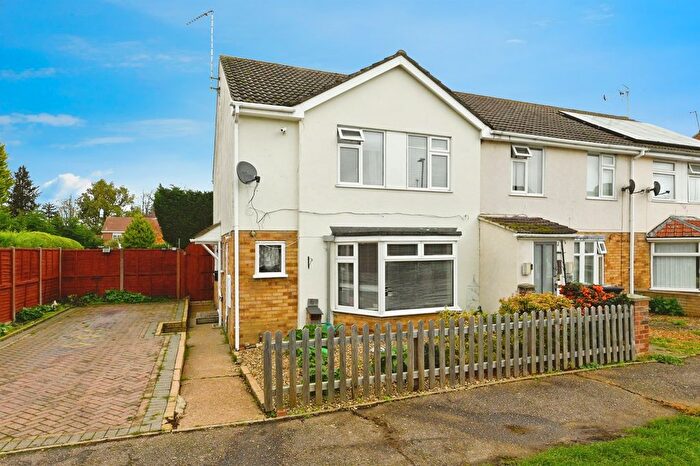
Properties in Old Gaywood have an average house price of £228,452.00 and had 119 Property Transactions within the last 3 years¹.
Old Gaywood is an area in Kings Lynn, Norfolk with 812 households², where the most expensive property was sold for £475,000.00.
Properties for sale in Old Gaywood
Roads and Postcodes in Old Gaywood
Navigate through our locations to find the location of your next house in Old Gaywood, Kings Lynn for sale or to rent.
| Streets | Postcodes |
|---|---|
| Balmoral Road | PE30 4DE PE30 4DF |
| Barnwell Road | PE30 4DH PE30 4DQ |
| Beulah Street | PE30 4DN |
| Bridge Place | PE30 4WJ PE30 4WL |
| Churn Court | PE30 4SX |
| Dairy Way | PE30 4TR |
| Denmark Road | PE30 4BD |
| Eastern Yard | PE30 4WG |
| Eastfields Close | PE30 4HQ |
| Edinburgh Avenue | PE30 4BZ PE30 4DD PE30 4DG |
| Field End Close | PE30 4AZ |
| Field Lane | PE30 4AX PE30 4AY |
| Field Road | PE30 4BE |
| Gayton Road | PE30 4EA |
| Keeble Place | PE30 4GG |
| Lavender Court | PE30 4HL |
| Lavender Road | PE30 4HA |
| Methuen Avenue | PE30 4BN PE30 4BW |
| Millie Court | PE30 4HH |
| New Road | PE30 4BB |
| Orchard Court | PE30 4BL |
| Queen Elizabeth Avenue | PE30 4BX PE30 4BY |
| River Lane | PE30 4HD |
| Riverside | PE30 3AA |
| Rosebery Avenue | PE30 4AA |
| Salters Road | PE30 4HF |
| Sandringham Road | PE30 4DA PE30 4DB |
| Southfields | PE30 4BA |
| St Faiths Drive | PE30 4PU |
| Swan Lane | PE30 4HE |
| Vancouver Court | PE30 4TX |
| Wootton Road | PE30 3AB PE30 4BS PE30 4BT PE30 4BU PE30 4DJ PE30 4DR PE30 4DW PE30 4EX PE30 4EZ |
Transport near Old Gaywood
- FAQ
- Price Paid By Year
- Property Type Price
Frequently asked questions about Old Gaywood
What is the average price for a property for sale in Old Gaywood?
The average price for a property for sale in Old Gaywood is £228,452. This amount is 25% lower than the average price in Kings Lynn. There are 596 property listings for sale in Old Gaywood.
What streets have the most expensive properties for sale in Old Gaywood?
The streets with the most expensive properties for sale in Old Gaywood are Swan Lane at an average of £348,000, Riverside at an average of £340,000 and Salters Road at an average of £325,000.
What streets have the most affordable properties for sale in Old Gaywood?
The streets with the most affordable properties for sale in Old Gaywood are Lavender Court at an average of £95,600, Orchard Court at an average of £118,333 and Bridge Place at an average of £133,833.
Which train stations are available in or near Old Gaywood?
Some of the train stations available in or near Old Gaywood are King's Lynn, Watlington and Downham Market.
Property Price Paid in Old Gaywood by Year
The average sold property price by year was:
| Year | Average Sold Price | Price Change |
Sold Properties
|
|---|---|---|---|
| 2025 | £217,356 | -11% |
21 Properties |
| 2024 | £240,801 | 9% |
34 Properties |
| 2023 | £218,733 | -6% |
30 Properties |
| 2022 | £231,532 | 9% |
34 Properties |
| 2021 | £210,448 | 9% |
39 Properties |
| 2020 | £191,217 | -14% |
31 Properties |
| 2019 | £218,381 | 15% |
32 Properties |
| 2018 | £186,390 | 6% |
32 Properties |
| 2017 | £175,643 | 13% |
29 Properties |
| 2016 | £153,291 | 4% |
39 Properties |
| 2015 | £147,746 | 6% |
32 Properties |
| 2014 | £138,832 | -2% |
57 Properties |
| 2013 | £141,352 | 5% |
48 Properties |
| 2012 | £134,017 | -7% |
63 Properties |
| 2011 | £143,786 | 12% |
48 Properties |
| 2010 | £126,108 | -8% |
15 Properties |
| 2009 | £136,808 | 8% |
34 Properties |
| 2008 | £125,747 | -10% |
20 Properties |
| 2007 | £138,896 | 5% |
45 Properties |
| 2006 | £131,681 | -4% |
42 Properties |
| 2005 | £137,318 | 5% |
25 Properties |
| 2004 | £129,844 | 19% |
49 Properties |
| 2003 | £104,770 | 22% |
31 Properties |
| 2002 | £81,726 | 19% |
47 Properties |
| 2001 | £66,579 | 9% |
40 Properties |
| 2000 | £60,850 | -16% |
39 Properties |
| 1999 | £70,434 | 38% |
59 Properties |
| 1998 | £43,583 | -1% |
43 Properties |
| 1997 | £44,202 | 7% |
46 Properties |
| 1996 | £41,283 | 5% |
51 Properties |
| 1995 | £39,327 | - |
31 Properties |
Property Price per Property Type in Old Gaywood
Here you can find historic sold price data in order to help with your property search.
The average Property Paid Price for specific property types in the last three years are:
| Property Type | Average Sold Price | Sold Properties |
|---|---|---|
| Semi Detached House | £241,913.00 | 48 Semi Detached Houses |
| Detached House | £320,259.00 | 27 Detached Houses |
| Terraced House | £183,086.00 | 29 Terraced Houses |
| Flat | £107,833.00 | 15 Flats |

