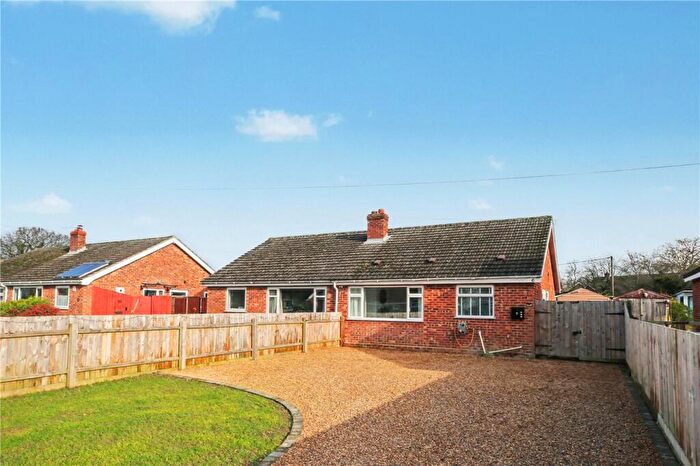
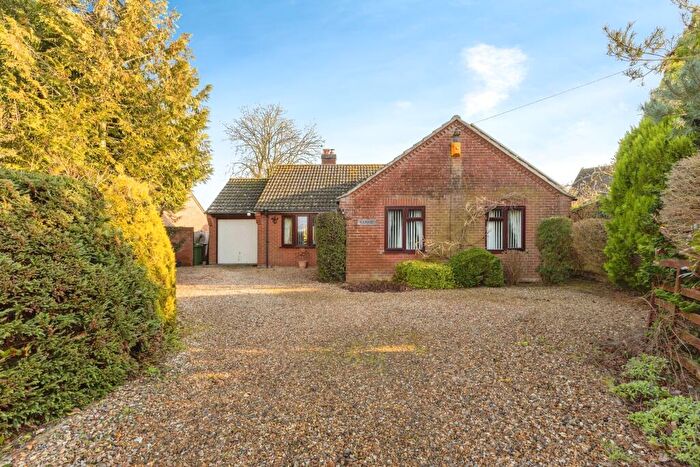
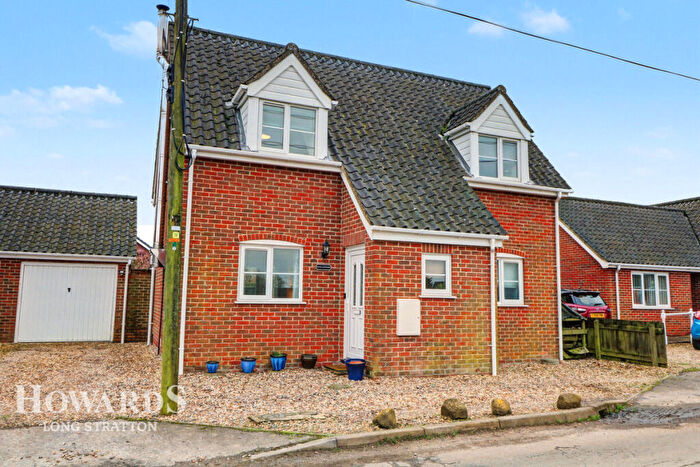
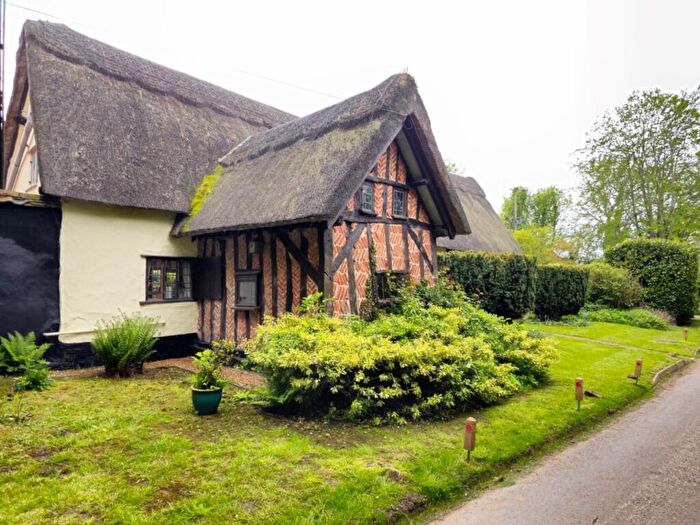
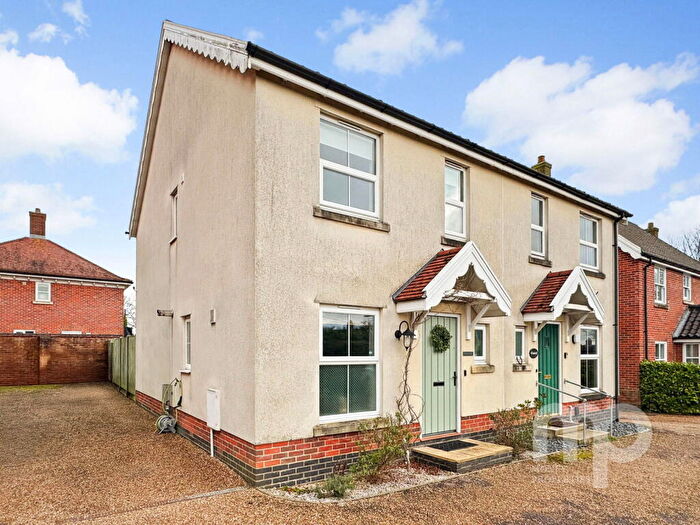
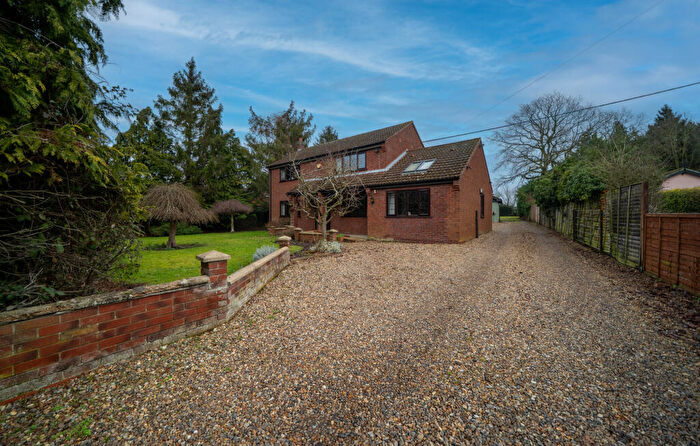
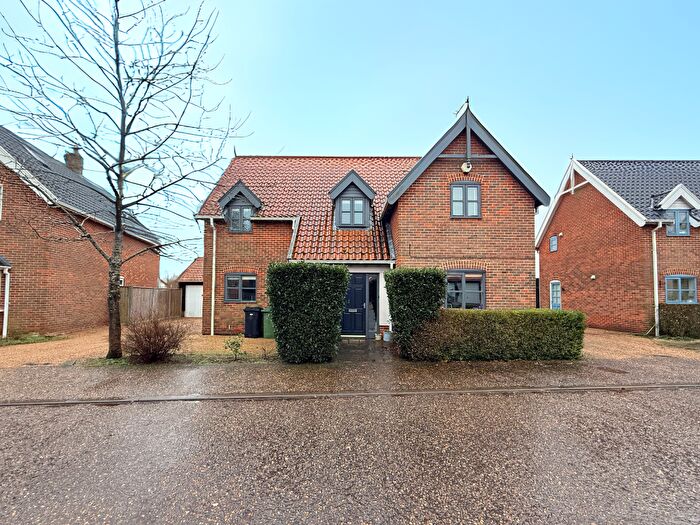
Houses for sale & to rent in Bunwell, Norwich
House Prices in Bunwell
Properties in Bunwell have an average house price of £424,408.00 and had 66 Property Transactions within the last 3 years¹.
Bunwell is an area in Norwich, Norfolk with 1,108 households², where the most expensive property was sold for £1,030,000.00.
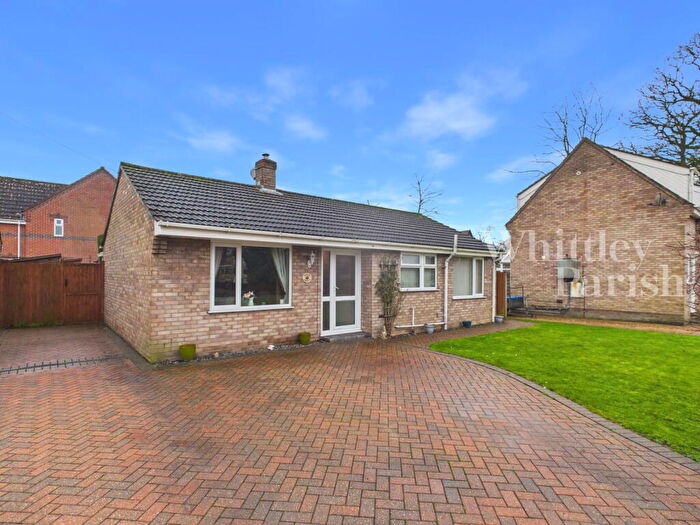
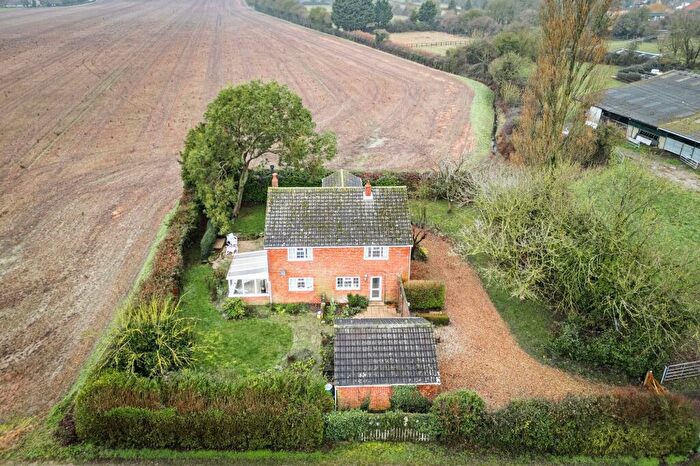
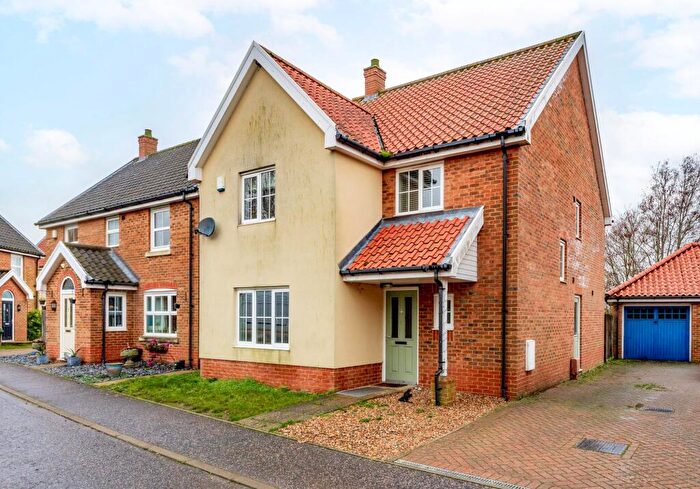
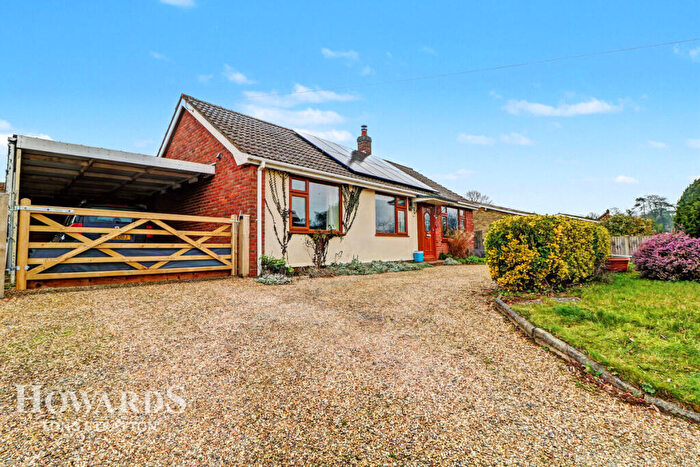
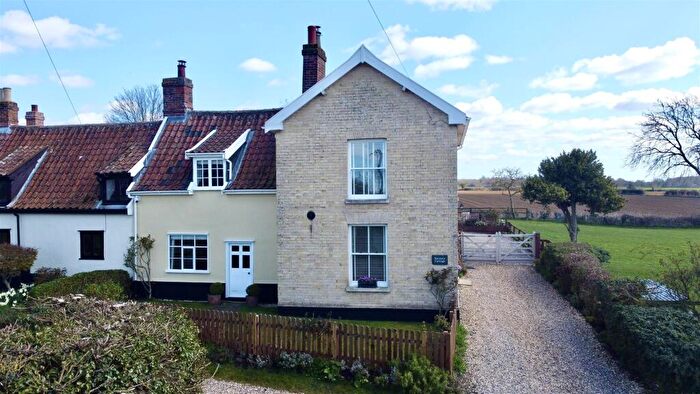
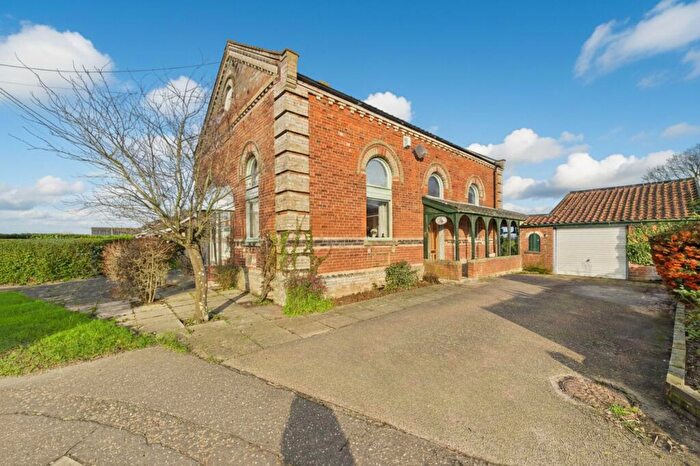
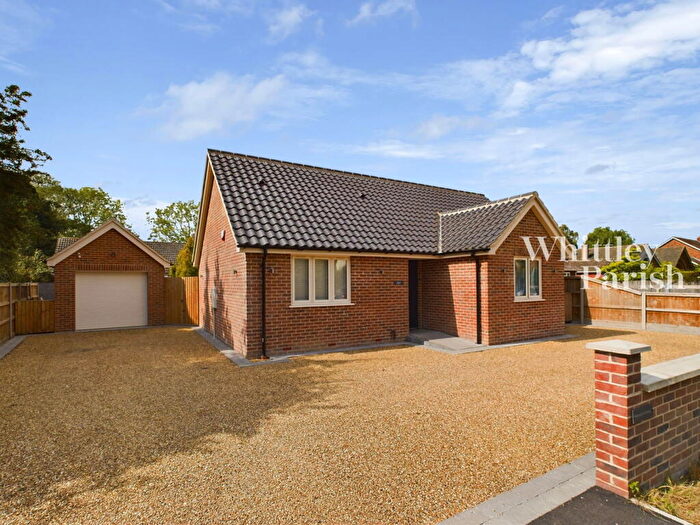
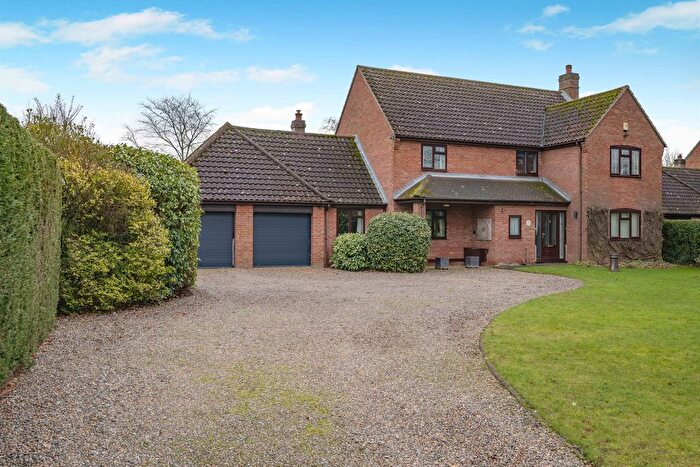
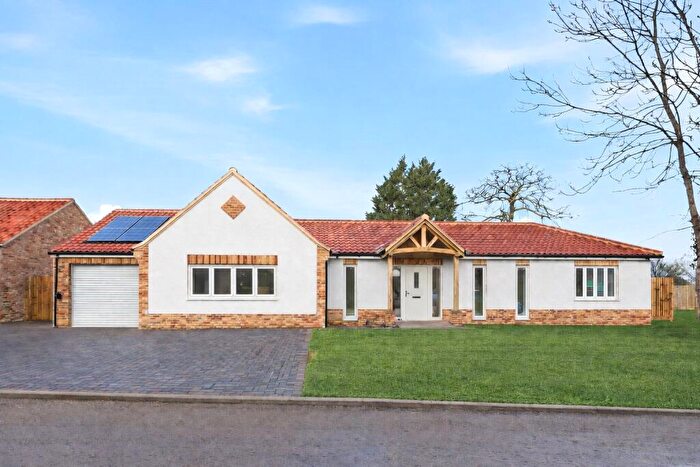
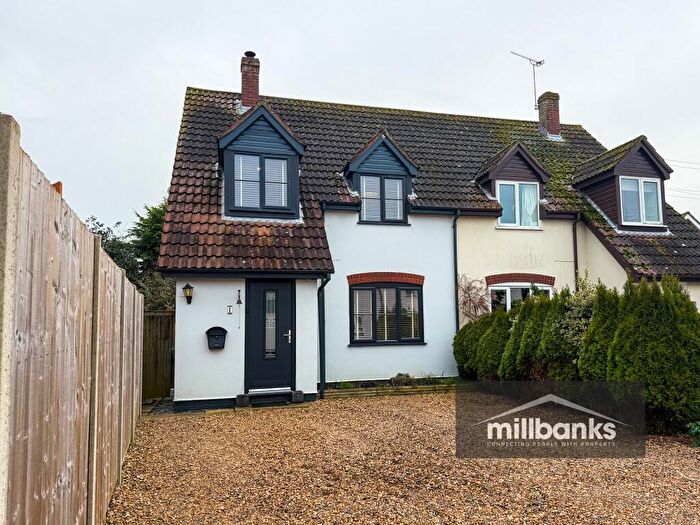
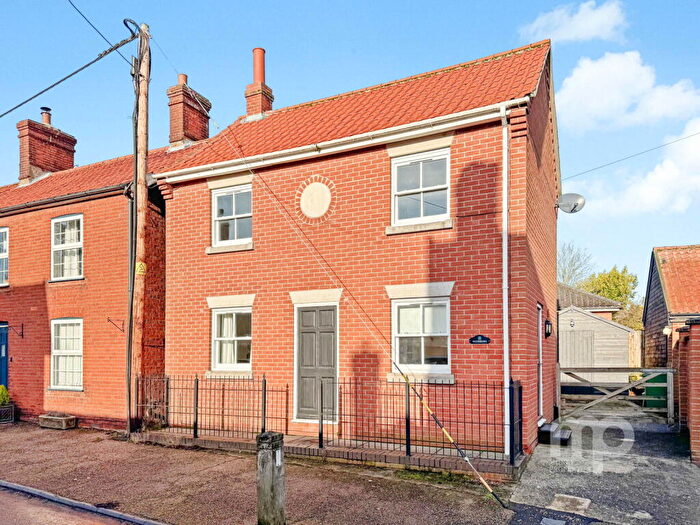
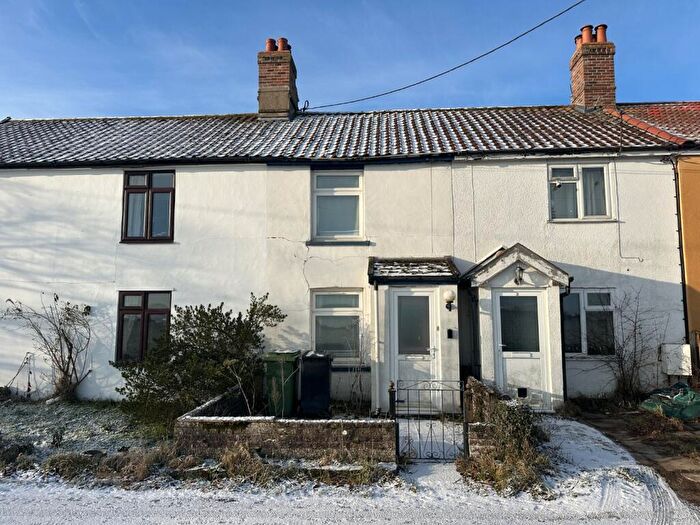
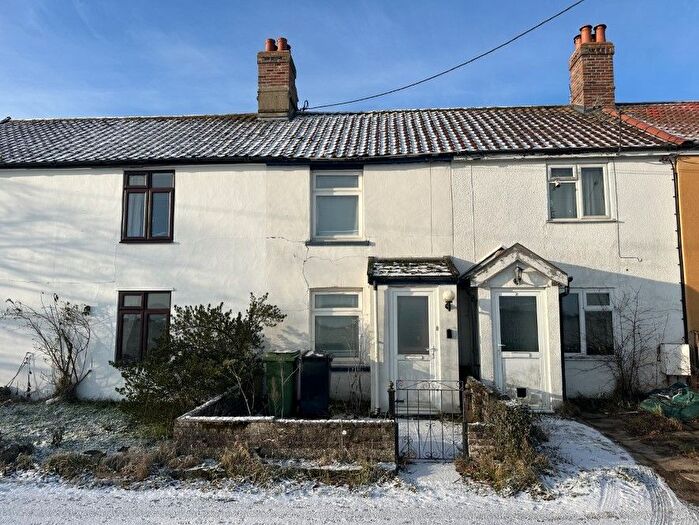
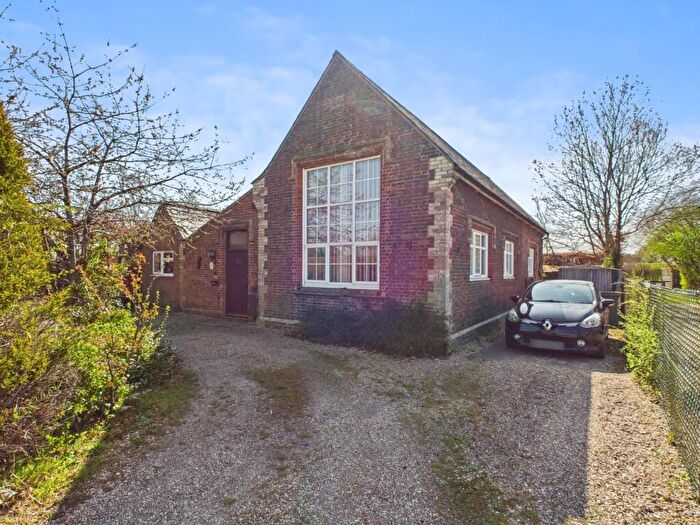
Properties for sale in Bunwell
Roads and Postcodes in Bunwell
Navigate through our locations to find the location of your next house in Bunwell, Norwich for sale or to rent.
Transport near Bunwell
-
Spooner Row Station
-
Attleborough Station
-
Wymondham Station
-
Eccles Road Station
-
Diss Station
-
Harling Road Station
- FAQ
- Price Paid By Year
- Property Type Price
Frequently asked questions about Bunwell
What is the average price for a property for sale in Bunwell?
The average price for a property for sale in Bunwell is £424,408. This amount is 38% higher than the average price in Norwich. There are 709 property listings for sale in Bunwell.
What streets have the most expensive properties for sale in Bunwell?
The streets with the most expensive properties for sale in Bunwell are Cargate Common at an average of £835,000, Long Row at an average of £647,500 and Bunwell Street at an average of £556,930.
What streets have the most affordable properties for sale in Bunwell?
The streets with the most affordable properties for sale in Bunwell are Woodrow Lane at an average of £204,000, Low Common at an average of £261,500 and Wash Lane at an average of £290,000.
Which train stations are available in or near Bunwell?
Some of the train stations available in or near Bunwell are Spooner Row, Attleborough and Wymondham.
Property Price Paid in Bunwell by Year
The average sold property price by year was:
| Year | Average Sold Price | Price Change |
Sold Properties
|
|---|---|---|---|
| 2025 | £450,029 | 9% |
17 Properties |
| 2024 | £408,809 | -3% |
21 Properties |
| 2023 | £420,553 | -4% |
28 Properties |
| 2022 | £439,068 | -0,1% |
43 Properties |
| 2021 | £439,351 | 20% |
76 Properties |
| 2020 | £349,636 | 7% |
33 Properties |
| 2019 | £325,259 | - |
35 Properties |
| 2018 | £325,413 | -6% |
30 Properties |
| 2017 | £344,587 | 6% |
40 Properties |
| 2016 | £324,684 | 12% |
38 Properties |
| 2015 | £285,353 | -1% |
38 Properties |
| 2014 | £287,248 | 12% |
40 Properties |
| 2013 | £252,736 | -3% |
42 Properties |
| 2012 | £261,375 | -23% |
27 Properties |
| 2011 | £321,015 | 11% |
33 Properties |
| 2010 | £284,555 | 23% |
42 Properties |
| 2009 | £218,609 | -9% |
23 Properties |
| 2008 | £238,153 | -30% |
27 Properties |
| 2007 | £310,200 | 18% |
39 Properties |
| 2006 | £254,876 | 3% |
59 Properties |
| 2005 | £248,112 | 7% |
44 Properties |
| 2004 | £230,828 | 8% |
48 Properties |
| 2003 | £212,753 | 21% |
37 Properties |
| 2002 | £167,377 | 10% |
60 Properties |
| 2001 | £149,920 | 12% |
45 Properties |
| 2000 | £132,560 | 22% |
48 Properties |
| 1999 | £103,122 | 22% |
48 Properties |
| 1998 | £80,740 | -1% |
31 Properties |
| 1997 | £81,903 | -1% |
39 Properties |
| 1996 | £82,389 | 11% |
32 Properties |
| 1995 | £73,066 | - |
40 Properties |
Property Price per Property Type in Bunwell
Here you can find historic sold price data in order to help with your property search.
The average Property Paid Price for specific property types in the last three years are:
| Property Type | Average Sold Price | Sold Properties |
|---|---|---|
| Semi Detached House | £309,205.00 | 17 Semi Detached Houses |
| Detached House | £466,968.00 | 48 Detached Houses |
| Terraced House | £340,000.00 | 1 Terraced House |

