
Houses for sale in Norwich, Norfolk
House Prices in Norwich
Properties in Norwich have an average house price of £308k and had 16,929 Property Transactions within the last 3 years.¹
Norwich is an area in Norfolk with 176,026 households², where the most expensive property was sold for £2.8M.
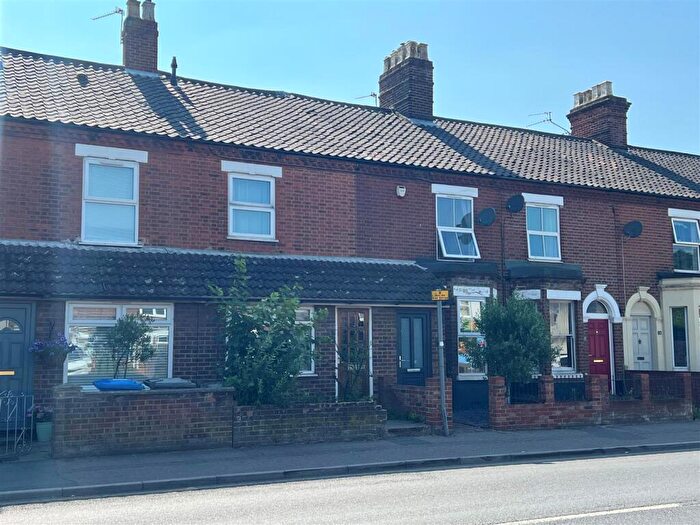
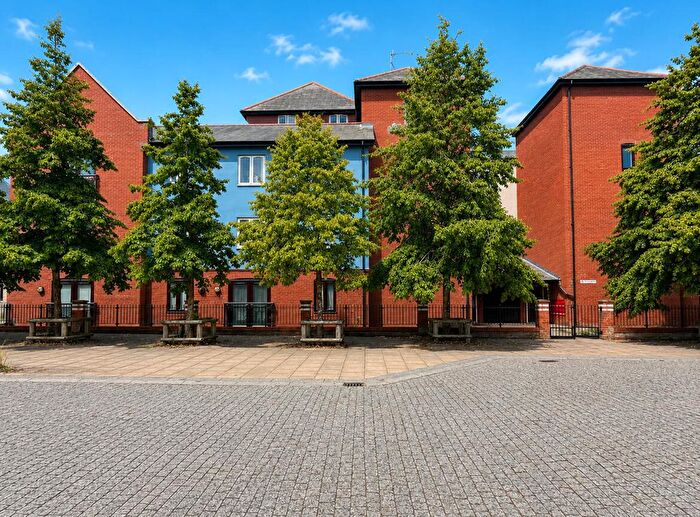
Properties for sale in Norwich
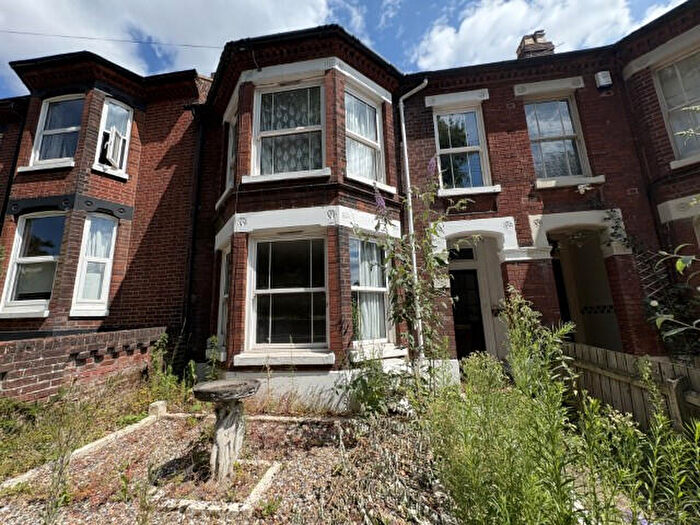
![]()
If you are looking to sell your house, let it out, or receive a property valuation, an expert can help you.
Click the button below to get started.


Neighbourhoods in Norwich
Navigate through our locations to find the location of your next house in Norwich, Norfolk for sale or to rent.
- Hoveton
- Acle
- All Saints
- Aylsham
- Blofield With South Walsham
- Bowthorpe
- Brooke
- Brundall
- Buckenham
- Bunwell
- Burlingham
- Buxton
- Catton Grove
- Chaucer
- Chedgrave And Thurton
- Coltishall
- Corpusty
- Cringleford
- Crome
- Dickleburgh
- Drayton North
- Drayton South
- East Guiltcross
- Easton
- Eaton
- Erpingham
- Eynesford
- Eynsford
- Fleggburgh
- Forncett
- Gaunt
- Gillingham
- Great Witchingham
- Happisburgh
- Harling And Heathlands
- Hellesdon North West
- Hellesdon South East
- Hempnall
- Hethersett
- Hevingham
- Hingham And Deopham
- Horsford And Felthorpe
- Lakenham
- Loddon
- Mancroft
- Marshes
- Mile Cross
- Mulbarton
- Mundesley
- Nelson
- New Costessey
- Newton Flotman
- Old Catton And Sprowston West
- Old Costessey
- Plumstead
- Poppyland
- Poringland With The Framinghams
- Reepham
- Rockland
- Roughton
- Scottow
- Sewell
- Spixworth With St Faiths
- Sprowston Central
- Sprowston East
- St Benet
- Stalham And Sutton
- Stoke Holy Cross
- Stratton
- Tasburgh
- Taverham North
- Taverham South
- The Runtons
- Thorpe Hamlet
- Thorpe St Andrew North West
- Thorpe St Andrew South East
- Thurlton
- Town Close
- University
- Upper Yare
- Waterside
- Waxham
- Wensum
- West Guiltcross
- Wicklewood
- Worstead
- Wroxham
- Trunch
- Stody
- North Walsham Market Cross
- Bacton
- Hickling
- St Benet's
- Hoveton & Tunstead
- Stalham
- Loddon & Chedgrave
- Poringland, Framinghams & Trowse
- Mulbarton & Stoke Holy Cross
- Beck Vale, Dickleburgh & Scole
- Bressingham & Burston
- The Buckenhams & Banham
- Harling & Heathlands
- Guiltcross
- All Saints & Wayland
- Central Wymondham
- Dereham Withburga
- Dereham Neatherd
- Mattishall
- Hingham & Deopham
- Saham Toney
- Shipdham-with-Scarning
- North Wymondham
- South Wymondham
- Dereham Toftwood
- Sheringham South
- Sheringham North
- North Walsham West
- Upper Wensum
Property price trends in Norwich
According to the latest Land Registry data, the average home in Norwich sold for £310,797 in 2026. That figure comes from a substantial record of 217,735 sales logged over the past 31 years.
Prices have held fairly steady over the last three years. Compared with 2023, when the typical sale came in around £310,442, values are broadly unchanged.
Looking back five years, average prices are up about 3.3% since 2021, a gain of around £10,014 in cash terms.
Zoom out to the past decade for the fuller picture. Back in 2016, homes here averaged £239,108, so the typical sold price has climbed about 30% since then, roughly 2.7% a year. Stretch the view to fifteen years and that annual pace edges up closer to 3.5%.
Frequently asked questions about Norwich
What is the average price for a property for sale in Norwich?
The average price for a property for sale in Norwich is £307,929. This amount is 3% higher than the average price in Norfolk. There are more than 10,000 property listings for sale in Norwich.
What locations have the most expensive properties for sale in Norwich?
The locations with the most expensive properties for sale in Norwich are Hickling at an average of £572,500, Mattishall at an average of £521,666 and Great Witchingham at an average of £518,340.
What locations have the most affordable properties for sale in Norwich?
The locations with the most affordable properties for sale in Norwich are Mile Cross at an average of £208,108, Mancroft at an average of £212,617 and Catton Grove at an average of £217,126.
Which train stations are available in or near Norwich?
Some of the train stations available in or near Norwich are Norwich, Salhouse and Brundall Gardens.
Property Price Paid in Norwich by Year
The average sold property price by year was:
| Year | Average Sold Price | Price Change |
Sold Properties
|
|---|---|---|---|
| 2026 | £310,797 | 1% |
447 Properties |
| 2025 | £308,185 | 1% |
5,531 Properties |
| 2024 | £305,124 | -2% |
5,682 Properties |
| 2023 | £310,442 | -3% |
5,269 Properties |
| 2022 | £321,129 | 6% |
6,762 Properties |
| 2021 | £300,783 | 7% |
8,301 Properties |
| 2020 | £279,564 | 5% |
6,021 Properties |
| 2019 | £264,753 | 3% |
7,235 Properties |
| 2018 | £257,041 | 1% |
7,512 Properties |
| 2017 | £253,502 | 6% |
7,735 Properties |
Property Price per Property Type in Norwich
Here you can find historic sold price data in order to help with your property search.
The average Property Paid Price for specific property types in the last three years are:
| Property Type | Average Sold Price | Sold Properties |
|---|---|---|
| Semi Detached House | £282,964.00 | 4,667 Semi Detached Houses |
| Terraced House | £256,564.00 | 4,320 Terraced Houses |
| Detached House | £422,793.00 | 5,723 Detached Houses |
| Flat | £164,189.00 | 2,219 Flats |
Transport in Norwich
Please see below transportation links in this area:
