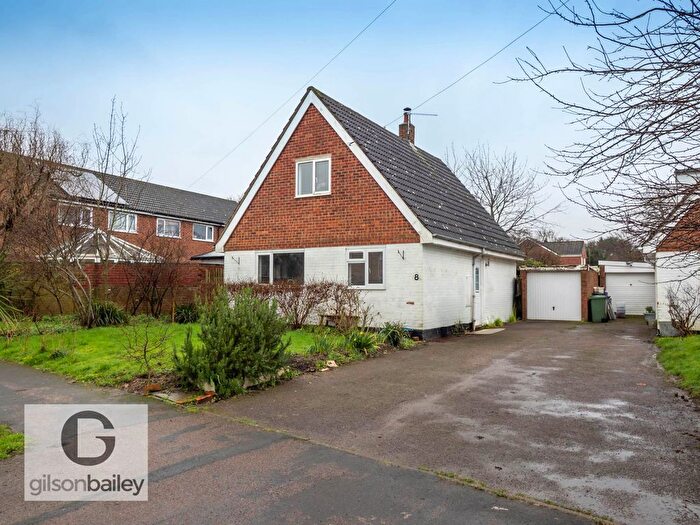
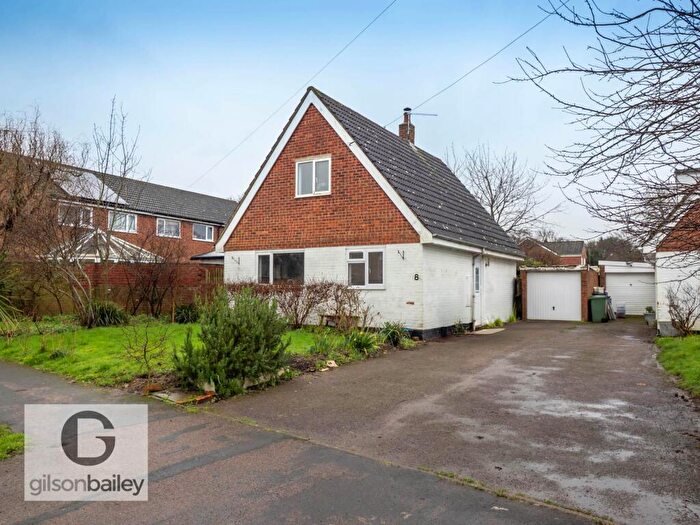
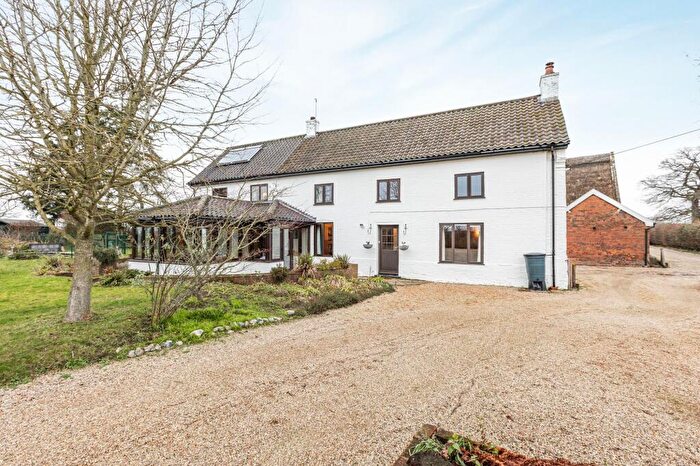
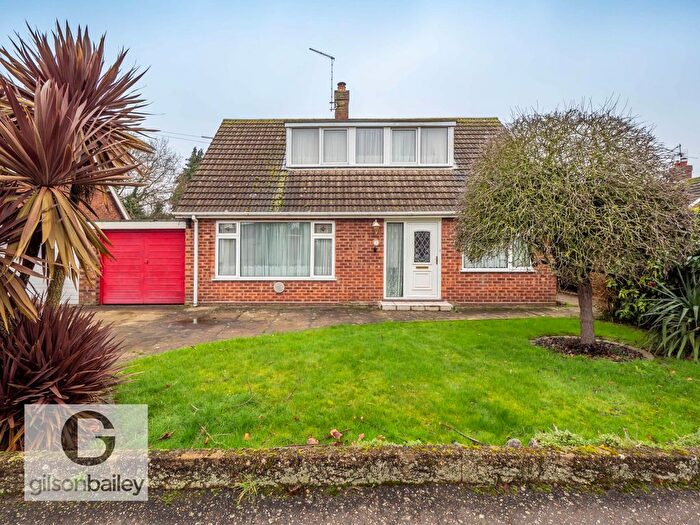
Houses for sale & to rent in Burlingham, Norwich
House Prices in Burlingham
Properties in Burlingham have an average house price of £305,344.00 and had 122 Property Transactions within the last 3 years¹.
Burlingham is an area in Norwich, Norfolk with 1,128 households², where the most expensive property was sold for £595,000.00.
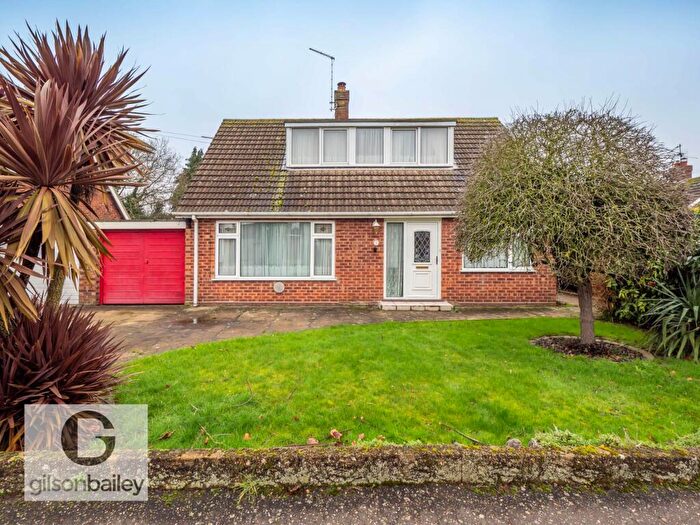
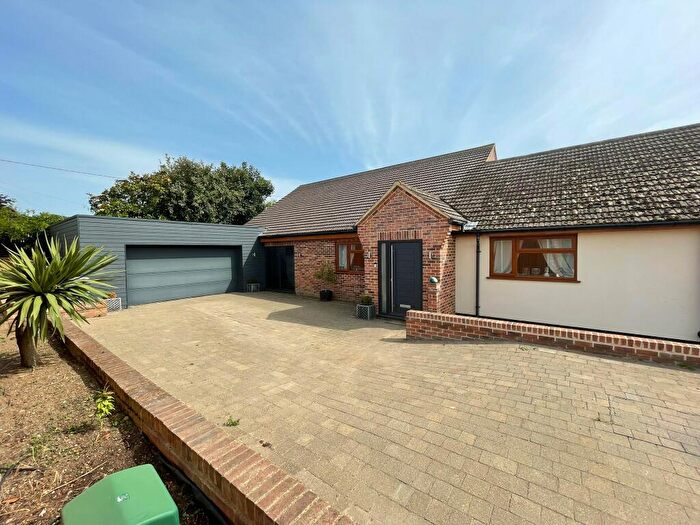
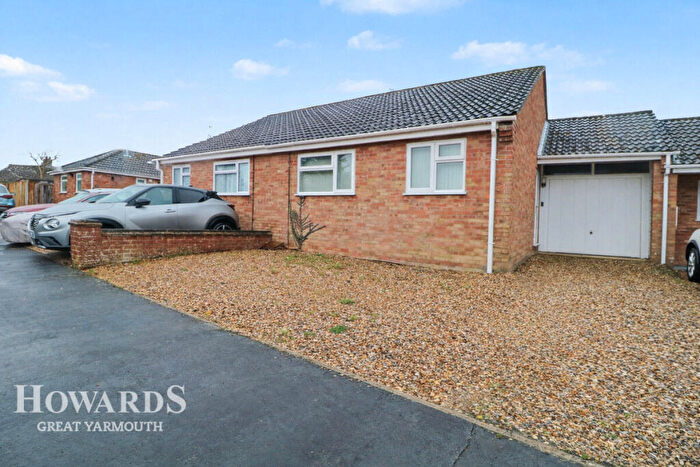
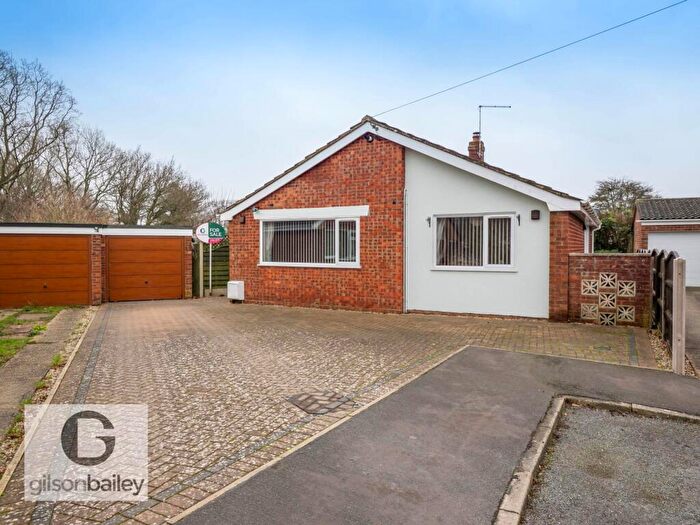
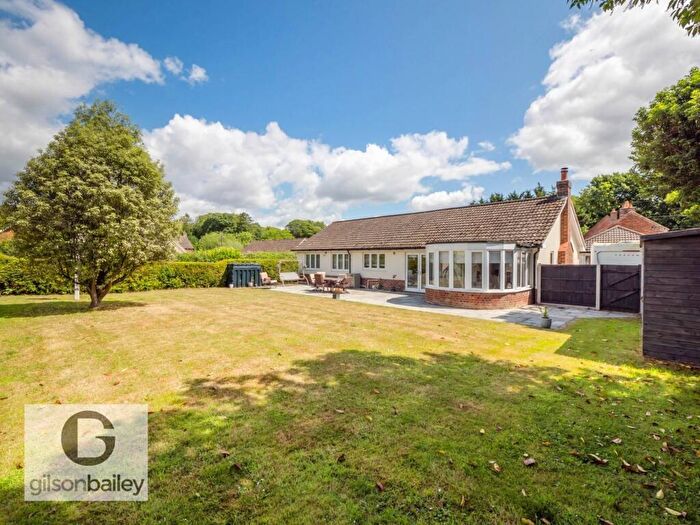
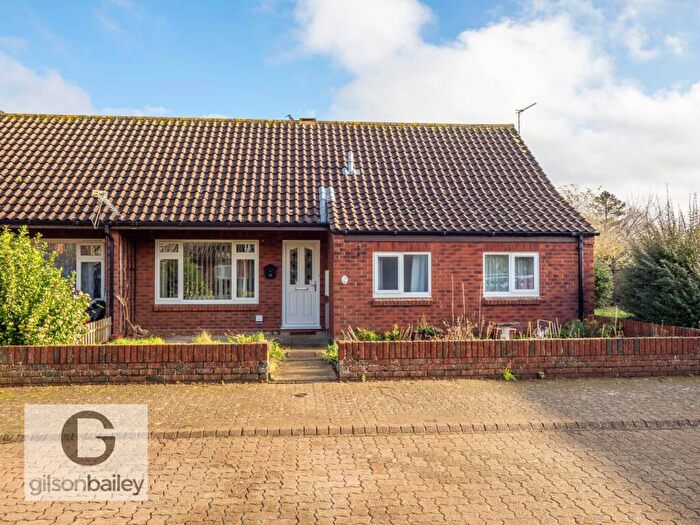
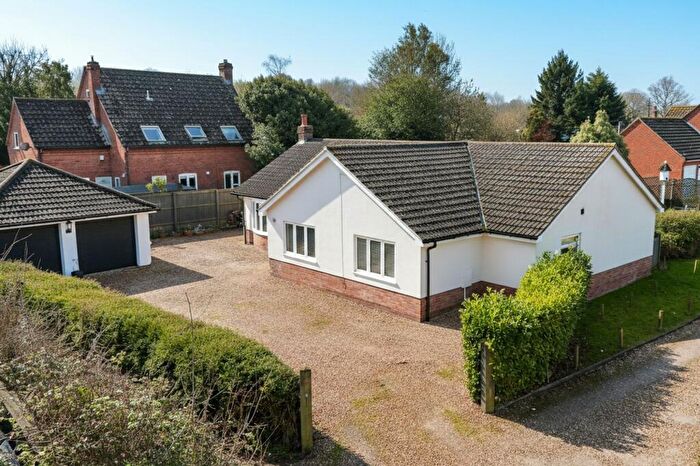
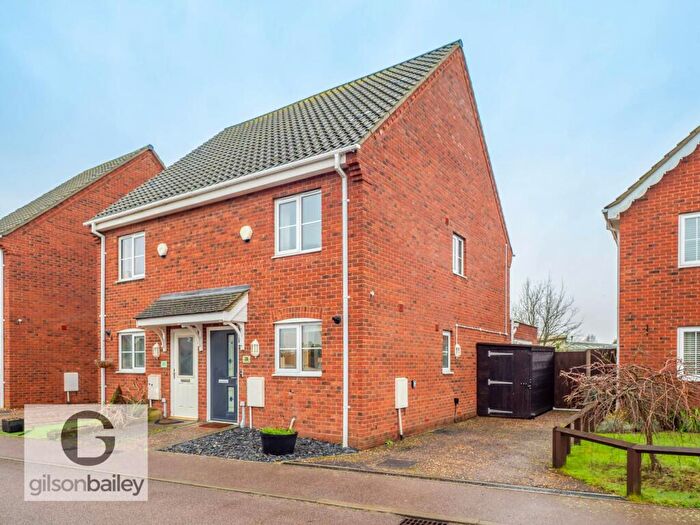
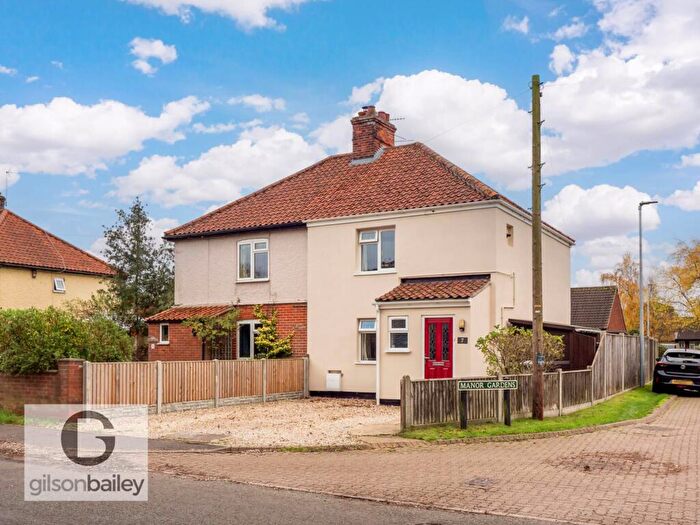
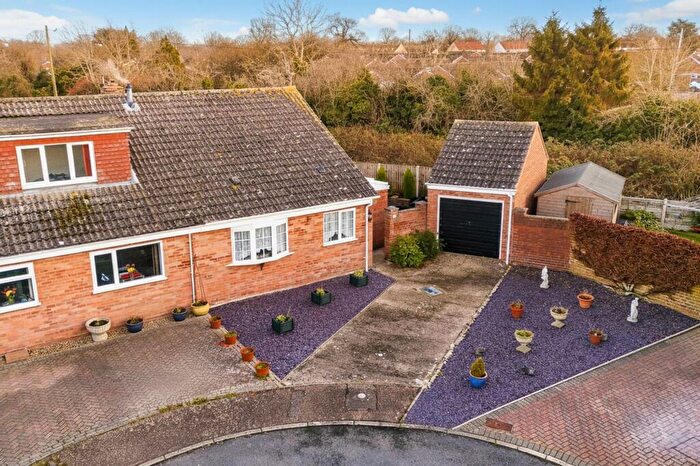
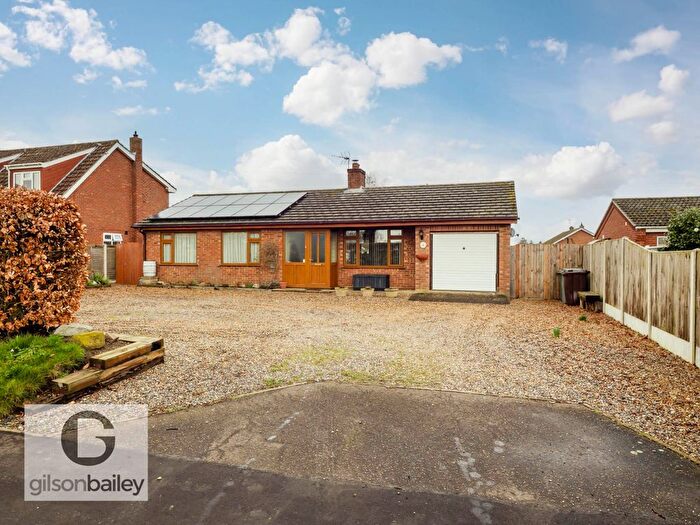
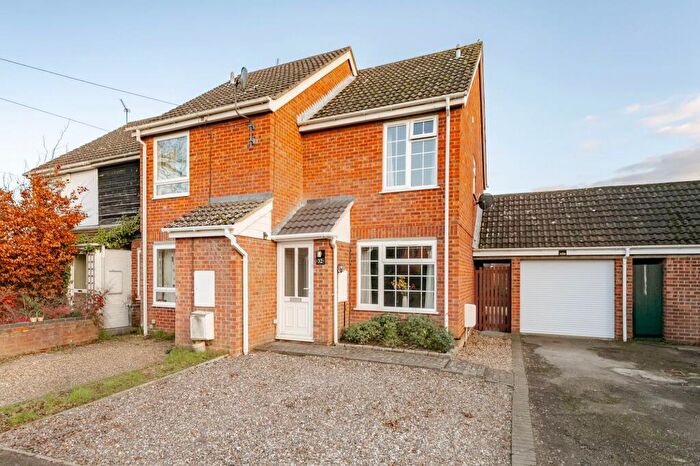
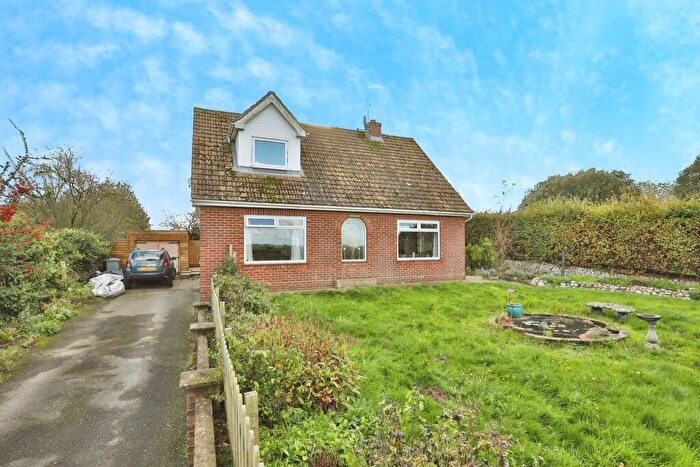
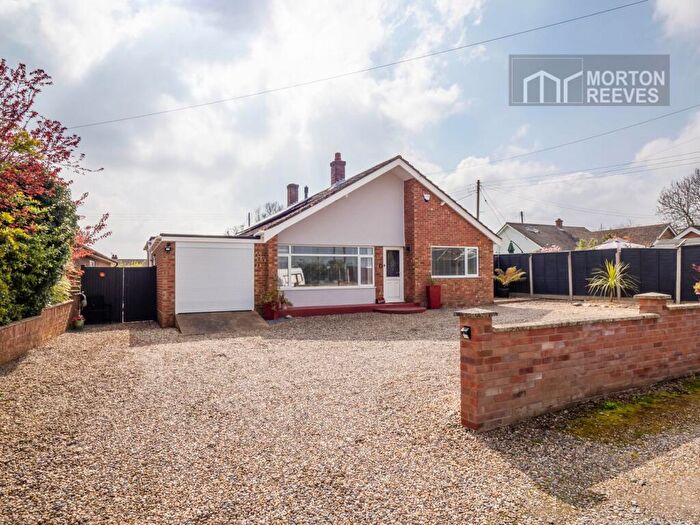
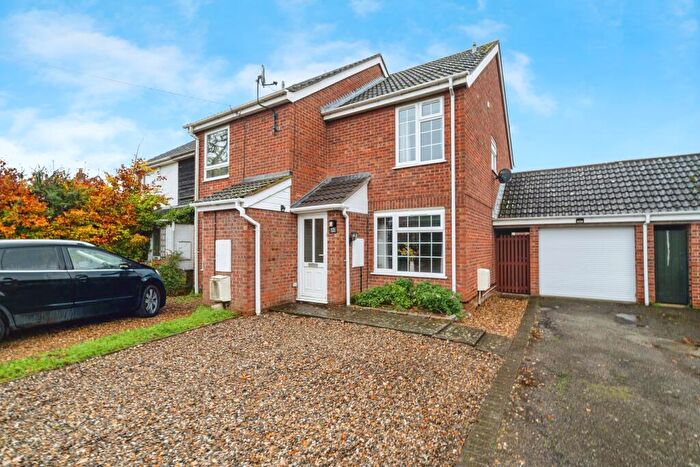
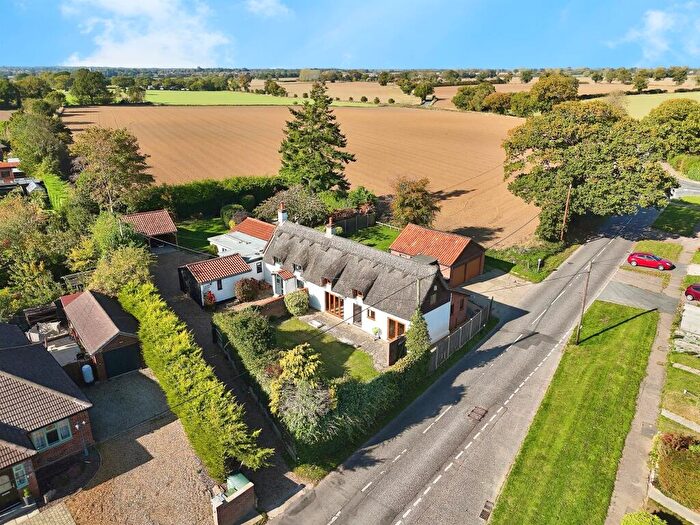
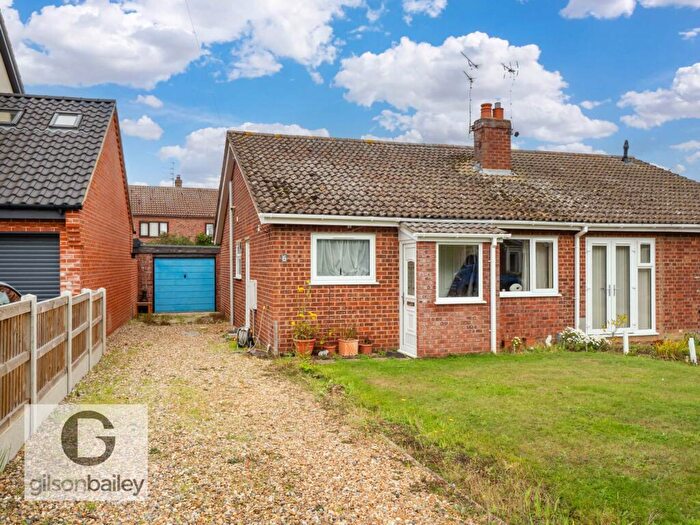
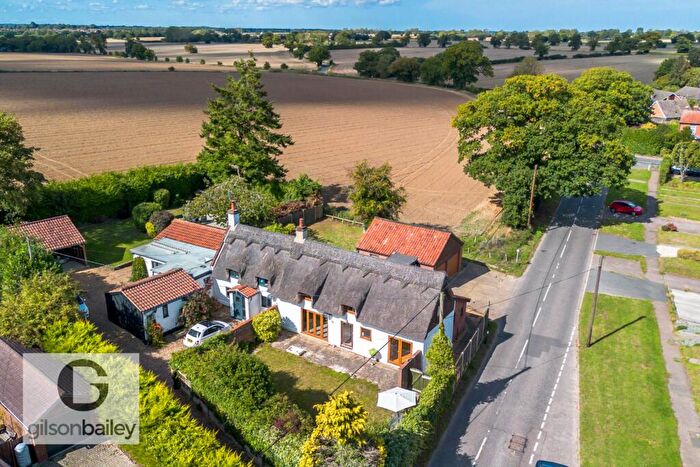
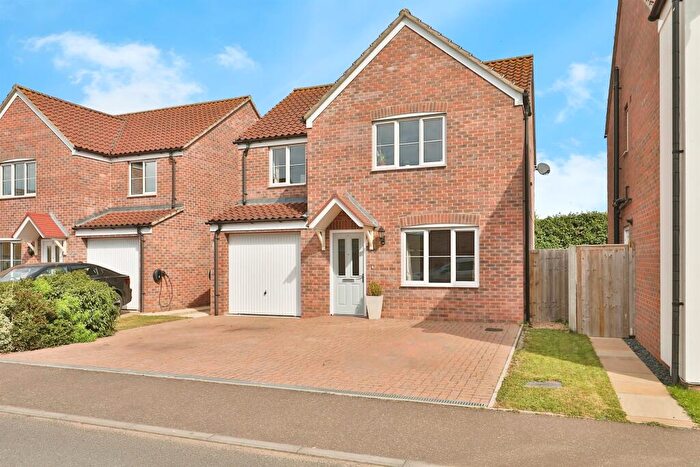
Properties for sale in Burlingham
Roads and Postcodes in Burlingham
Navigate through our locations to find the location of your next house in Burlingham, Norwich for sale or to rent.
| Streets | Postcodes |
|---|---|
| Acle Road | NR13 4ER |
| Acorn Close | NR13 4UN |
| Alec East Road | NR13 4UA |
| Alison Close | NR13 4BN |
| Avondale Close | NR13 4BG |
| Barn Close | NR13 4TS |
| Blofield Road | NR13 4AP NR13 4AJ NR13 4AL NR13 4AN |
| Briar Close | NR13 4PB |
| Buckenham Lane | NR13 4NJ NR13 4NG |
| Buckenham Road | NR13 4BL |
| Cantley Road | NR13 4HB |
| Carpenters Close | NR13 4BF |
| Centenary Close | NR13 4DL |
| Chapel Road | NR13 4NX NR13 4NY |
| Christine Avenue | NR13 4BJ |
| Church Road | NR13 4EU NR13 4TR |
| Clarkson Road | NR13 4BA |
| Dell Corner Lane | NR13 4EG NR13 4EQ NR13 4SX |
| Elm Close | NR13 4TQ |
| Elm Road | NR13 4TG |
| Farm Close | NR13 4BS |
| Granary Close | NR13 4EP |
| Hassingham Road | NR13 4HD |
| Heater Lane | NR13 4SR |
| High Way | NR13 4BU |
| Hilary Close | NR13 4AY |
| Homelea Court | NR13 4BZ |
| Homelea Crescent | NR13 4BP NR13 4BW |
| Homestead Close | NR13 4AT |
| Kingsdale | NR13 4AS |
| Larchwood Close | NR13 4TU |
| Lingwood Gardens | NR13 4TL |
| Lingwood Lane | NR13 4TB NR13 4TD |
| Lingwood Road | NR13 4ST NR13 4FD |
| Lodge Road | NR13 4TE NR13 4TF |
| Main Road | NR13 4TA |
| Manor Gardens | NR13 4SP |
| Memorial Way | NR13 4DU |
| Neves Close | NR13 4AW |
| New Road | NR13 4BD |
| Norwich Road | NR13 4BE NR13 4BH NR13 4BQ NR13 4EX NR13 4EZ NR13 4EY |
| Oak Tree Close | NR13 4UH |
| Orchard Close | NR13 4NZ |
| Pack Lane | NR13 4PD |
| Phoenix Drive | NR13 4FB |
| Poppy Close | NR13 4DX |
| Post Office Close | NR13 4EW |
| Post Office Road | NR13 4AD NR13 4AQ NR13 4AR |
| School Road | NR13 4TH NR13 4TJ |
| School Terrace | NR13 4TP |
| South Burlingham Road | NR13 4ES NR13 4ET NR13 4FA |
| South Walsham Road | NR13 4EH |
| Spencer Close | NR13 4BB |
| St Andrews Road | NR13 4LY |
| St Edmunds Road | NR13 4LU |
| St Peters Road | NR13 4LX |
| Station Close | NR13 4AX |
| Station Road | NR13 4AU NR13 4AZ |
| The Green | NR13 4SY NR13 4SZ |
| Vicarage Road | NR13 4TT |
| West View Drive | NR13 4DW |
| Willow Close | NR13 4BT |
| NR13 4SS NR13 4SU NR13 4TW |
Transport near Burlingham
- FAQ
- Price Paid By Year
- Property Type Price
Frequently asked questions about Burlingham
What is the average price for a property for sale in Burlingham?
The average price for a property for sale in Burlingham is £305,344. This amount is 0.82% lower than the average price in Norwich. There are 321 property listings for sale in Burlingham.
What streets have the most expensive properties for sale in Burlingham?
The streets with the most expensive properties for sale in Burlingham are Lodge Road at an average of £595,000, The Green at an average of £585,000 and South Walsham Road at an average of £525,000.
What streets have the most affordable properties for sale in Burlingham?
The streets with the most affordable properties for sale in Burlingham are Granary Close at an average of £220,000, Chapel Road at an average of £225,000 and School Road at an average of £225,000.
Which train stations are available in or near Burlingham?
Some of the train stations available in or near Burlingham are Lingwood, Buckenham and Brundall.
Property Price Paid in Burlingham by Year
The average sold property price by year was:
| Year | Average Sold Price | Price Change |
Sold Properties
|
|---|---|---|---|
| 2025 | £309,471 | 3% |
39 Properties |
| 2024 | £299,268 | -3% |
41 Properties |
| 2023 | £307,442 | 4% |
42 Properties |
| 2022 | £295,525 | 4% |
60 Properties |
| 2021 | £284,512 | 6% |
40 Properties |
| 2020 | £266,407 | 3% |
27 Properties |
| 2019 | £257,448 | 13% |
36 Properties |
| 2018 | £224,380 | -19% |
42 Properties |
| 2017 | £267,497 | 19% |
39 Properties |
| 2016 | £217,158 | -5% |
36 Properties |
| 2015 | £226,963 | 0,4% |
71 Properties |
| 2014 | £226,098 | 12% |
50 Properties |
| 2013 | £198,838 | 6% |
50 Properties |
| 2012 | £186,303 | 4% |
32 Properties |
| 2011 | £179,171 | -1% |
42 Properties |
| 2010 | £180,282 | -2% |
35 Properties |
| 2009 | £183,263 | 2% |
19 Properties |
| 2008 | £180,148 | -10% |
25 Properties |
| 2007 | £197,762 | 5% |
63 Properties |
| 2006 | £187,275 | 3% |
62 Properties |
| 2005 | £182,185 | 13% |
37 Properties |
| 2004 | £159,254 | 14% |
58 Properties |
| 2003 | £137,388 | 14% |
51 Properties |
| 2002 | £117,814 | 16% |
51 Properties |
| 2001 | £98,843 | 15% |
59 Properties |
| 2000 | £83,561 | 27% |
64 Properties |
| 1999 | £61,155 | -4% |
64 Properties |
| 1998 | £63,865 | 13% |
59 Properties |
| 1997 | £55,662 | 2% |
49 Properties |
| 1996 | £54,425 | - |
49 Properties |
| 1995 | £54,435 | - |
31 Properties |
Property Price per Property Type in Burlingham
Here you can find historic sold price data in order to help with your property search.
The average Property Paid Price for specific property types in the last three years are:
| Property Type | Average Sold Price | Sold Properties |
|---|---|---|
| Semi Detached House | £255,791.00 | 57 Semi Detached Houses |
| Detached House | £374,541.00 | 45 Detached Houses |
| Terraced House | £294,078.00 | 19 Terraced Houses |
| Flat | £230,000.00 | 1 Flat |

