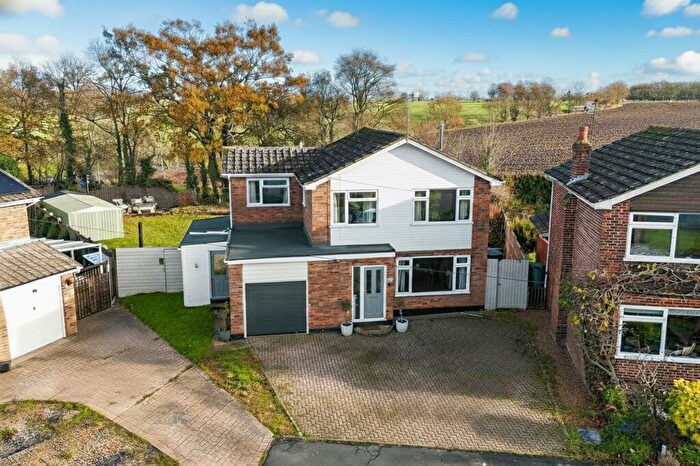
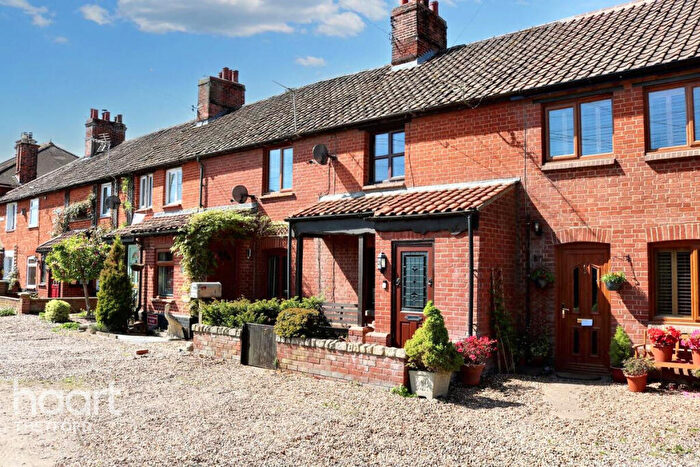
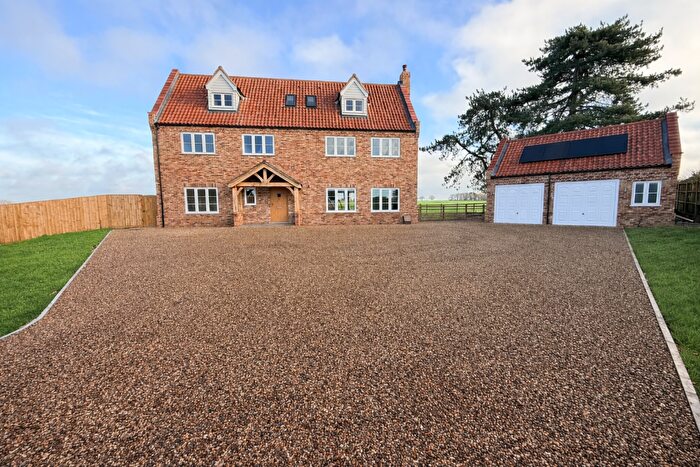
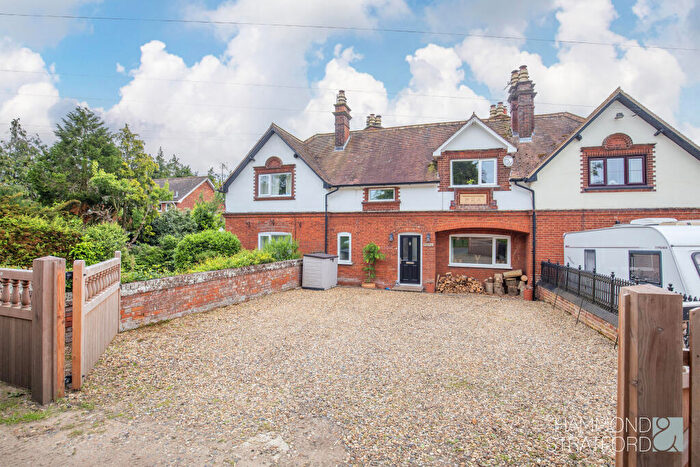
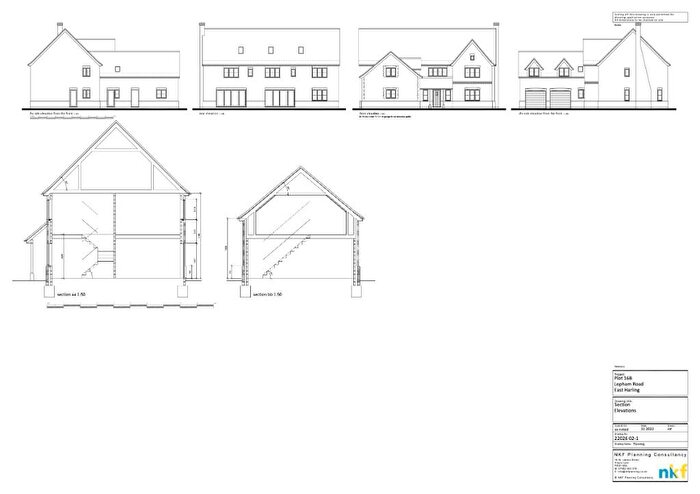
Houses for sale & to rent in Harling And Heathlands, Norwich
House Prices in Harling And Heathlands
Properties in Harling And Heathlands have an average house price of £316,698.00 and had 117 Property Transactions within the last 3 years¹.
Harling And Heathlands is an area in Norwich, Norfolk with 1,162 households², where the most expensive property was sold for £685,000.00.
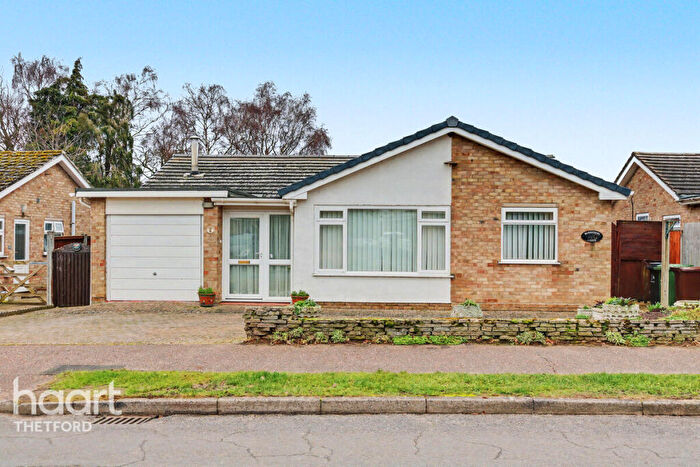
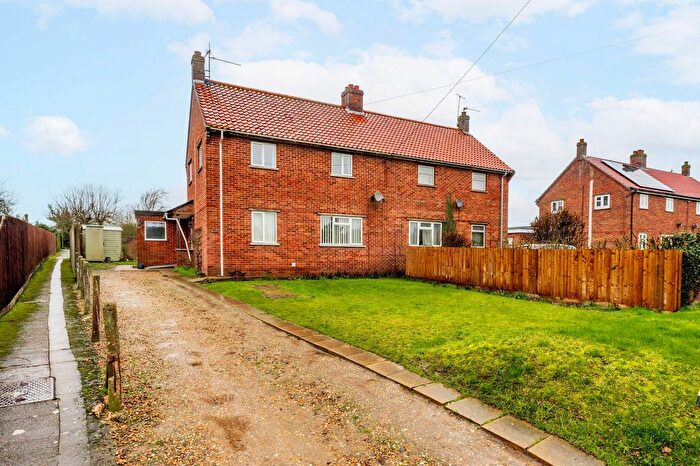
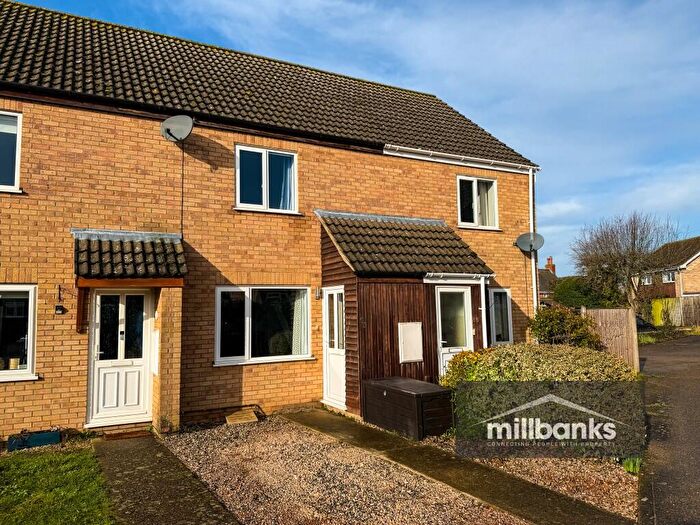
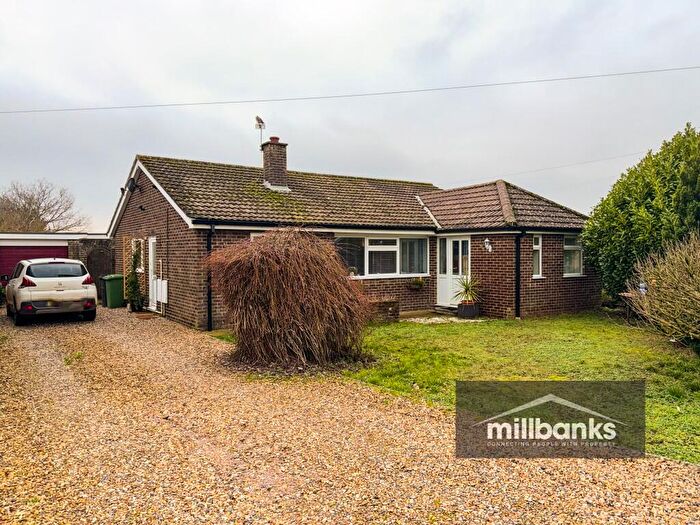
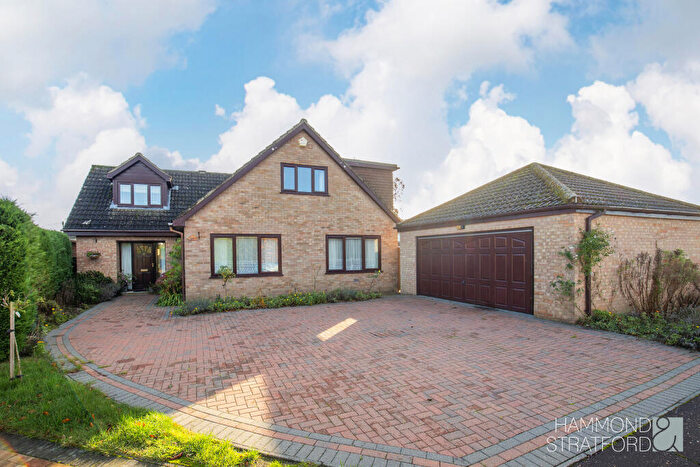
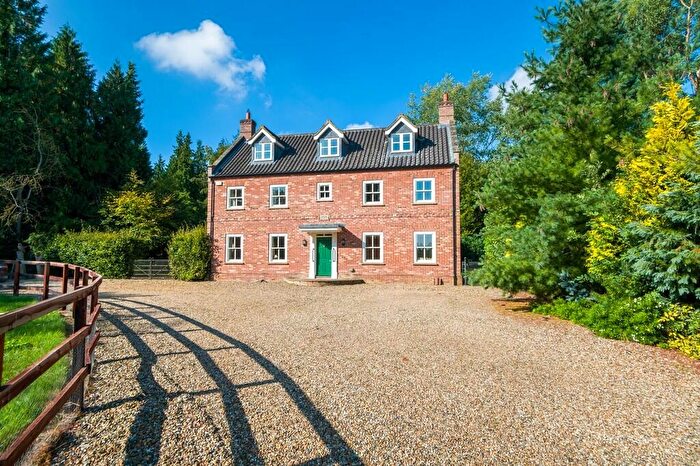
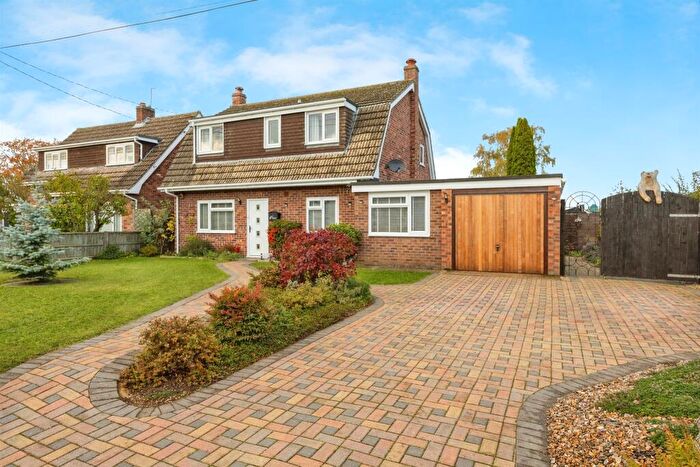
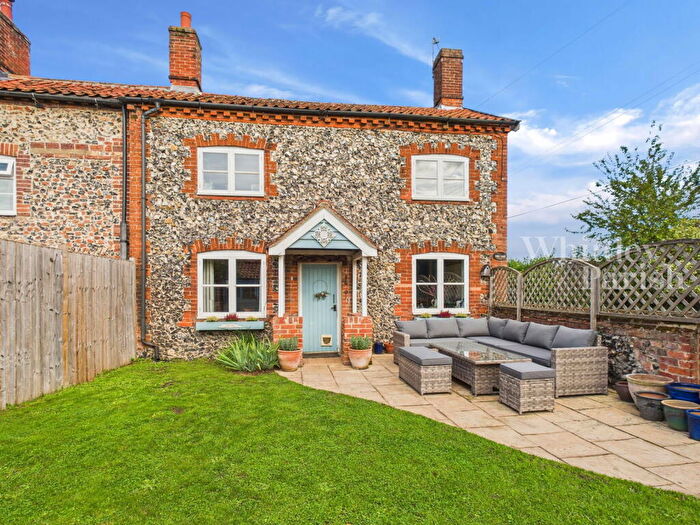
Properties for sale in Harling And Heathlands
Roads and Postcodes in Harling And Heathlands
Navigate through our locations to find the location of your next house in Harling And Heathlands, Norwich for sale or to rent.
| Streets | Postcodes |
|---|---|
| Bailiwick Court | NR16 2NH |
| Bank Yard | NR16 2TD |
| Brewsters | NR16 2QH |
| Chapel Lane | NR16 2SP |
| Cheese Hill | NR16 2PP |
| Chiswell Lane | NR16 2PL |
| Church Road | NR16 2NB |
| Church Terrace | NR16 2NA |
| Dolphin Terrace | NR16 2QR |
| Drakes Close | NR16 2JB |
| Eccles Road | NR16 2JE |
| Fen Lane | NR16 2NG |
| Fen Willow Mews | NR16 2TQ |
| Fox Grove | NR16 2PS |
| Gallants Lane | NR16 2NQ |
| Garboldisham Road | NR16 2PN NR16 2PR NR16 2PT NR16 2PU |
| Garlondes | NR16 2NN NR16 2NR |
| Greenfields | NR16 2NJ |
| Grigsons Wood | NR16 2LW |
| Hamblings Piece | NR16 2PZ |
| Harling Road | NR16 2QP NR16 2QW |
| High Bridgham Road | NR16 2QJ |
| Jubilee Avenue | NR16 2QF |
| Kenninghall Road | NR16 2QD NR16 2QE |
| Kerridges | NR16 2QA NR16 2QB |
| King Street | NR16 2QG |
| Lopham Road | NR16 2PX NR16 2PY |
| Maltings Way | NR16 2QQ |
| Market Street | NR16 2AD |
| Memorial Green | NR16 2ND |
| Mount Pleasant Drive | NR16 2GB |
| Nugent Court | NR16 2NT |
| Quidenham Road | NR16 2JD |
| Risley Close | NR16 2RP |
| Roudham Junction | NR16 2RG |
| Roudham Road | NR16 2QN |
| School Lane | NR16 2BN NR16 2LU |
| Shadwell Crossing | NR16 2RE |
| Spinney Drive | NR16 2TE |
| St Georges Crescent | NR16 2GD |
| The Bailiwick | NR16 2NF |
| The Glebe | NR16 2SZ |
| The Park | NR16 2LY |
| The Pyghtle | NR16 2NL |
| The Street | NR16 2AB NR16 2RS NR16 2RT NR16 2RU NR16 2RY NR16 2RZ NR16 2SA |
| Timber Road | NR16 2TN |
| Turnpike Cottage | NR16 2RD |
| Walnut Close | NR16 2TG |
| Watton Road | NR16 2AJ NR16 2RA |
| West Harling Road | NR16 2NP NR16 2SH NR16 2SJ NR16 2SL NR16 2SQ |
| Wetherall Close | NR16 2SW |
| White Hart Street | NR16 2NE |
| Wood Yard | NR16 2TP |
| NR16 2QS NR16 2RB NR16 2RH NR16 2RJ NR16 2RL NR16 2RN NR16 2RQ NR16 2RR NR16 2RW NR16 2SE |
Transport near Harling And Heathlands
-
Harling Road Station
-
Eccles Road Station
-
Attleborough Station
-
Thetford Station
-
Spooner Row Station
-
Diss Station
- FAQ
- Price Paid By Year
- Property Type Price
Frequently asked questions about Harling And Heathlands
What is the average price for a property for sale in Harling And Heathlands?
The average price for a property for sale in Harling And Heathlands is £316,698. This amount is 3% higher than the average price in Norwich. There are 301 property listings for sale in Harling And Heathlands.
What streets have the most expensive properties for sale in Harling And Heathlands?
The streets with the most expensive properties for sale in Harling And Heathlands are Eccles Road at an average of £510,000, St Georges Crescent at an average of £507,500 and Wood Yard at an average of £425,000.
What streets have the most affordable properties for sale in Harling And Heathlands?
The streets with the most affordable properties for sale in Harling And Heathlands are Spinney Drive at an average of £215,000, Garlondes at an average of £215,208 and Bailiwick Court at an average of £216,500.
Which train stations are available in or near Harling And Heathlands?
Some of the train stations available in or near Harling And Heathlands are Harling Road, Eccles Road and Attleborough.
Property Price Paid in Harling And Heathlands by Year
The average sold property price by year was:
| Year | Average Sold Price | Price Change |
Sold Properties
|
|---|---|---|---|
| 2025 | £302,791 | -5% |
46 Properties |
| 2024 | £317,013 | -6% |
37 Properties |
| 2023 | £335,171 | 7% |
34 Properties |
| 2022 | £311,881 | -5% |
40 Properties |
| 2021 | £327,967 | 1% |
62 Properties |
| 2020 | £324,574 | 20% |
45 Properties |
| 2019 | £259,732 | -2% |
44 Properties |
| 2018 | £265,805 | 11% |
67 Properties |
| 2017 | £236,833 | -5% |
36 Properties |
| 2016 | £249,701 | 10% |
62 Properties |
| 2015 | £223,827 | 4% |
61 Properties |
| 2014 | £215,596 | 8% |
58 Properties |
| 2013 | £197,755 | 5% |
57 Properties |
| 2012 | £187,239 | 1% |
32 Properties |
| 2011 | £185,986 | -4% |
40 Properties |
| 2010 | £192,701 | 8% |
42 Properties |
| 2009 | £177,088 | -15% |
35 Properties |
| 2008 | £202,899 | 2% |
30 Properties |
| 2007 | £199,740 | 12% |
70 Properties |
| 2006 | £175,709 | 2% |
52 Properties |
| 2005 | £172,511 | 4% |
54 Properties |
| 2004 | £165,745 | 17% |
58 Properties |
| 2003 | £137,692 | 21% |
52 Properties |
| 2002 | £109,212 | 2% |
70 Properties |
| 2001 | £107,499 | 26% |
80 Properties |
| 2000 | £79,095 | 14% |
50 Properties |
| 1999 | £68,009 | 11% |
61 Properties |
| 1998 | £60,723 | 8% |
54 Properties |
| 1997 | £56,012 | -3% |
62 Properties |
| 1996 | £57,831 | -9% |
55 Properties |
| 1995 | £62,843 | - |
54 Properties |
Property Price per Property Type in Harling And Heathlands
Here you can find historic sold price data in order to help with your property search.
The average Property Paid Price for specific property types in the last three years are:
| Property Type | Average Sold Price | Sold Properties |
|---|---|---|
| Semi Detached House | £266,973.00 | 41 Semi Detached Houses |
| Detached House | £381,977.00 | 53 Detached Houses |
| Terraced House | £254,913.00 | 23 Terraced Houses |

