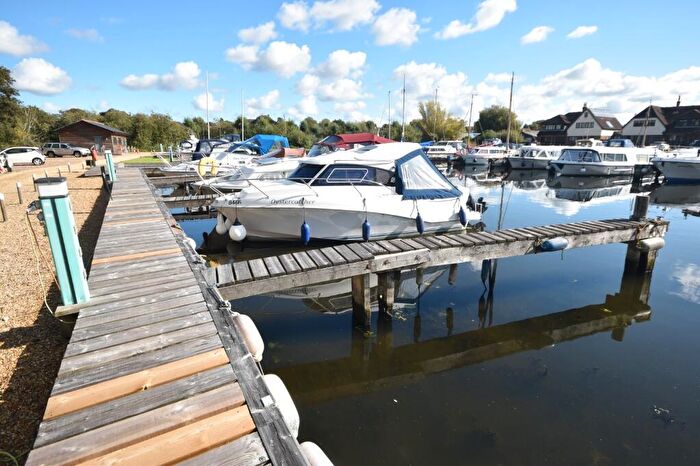
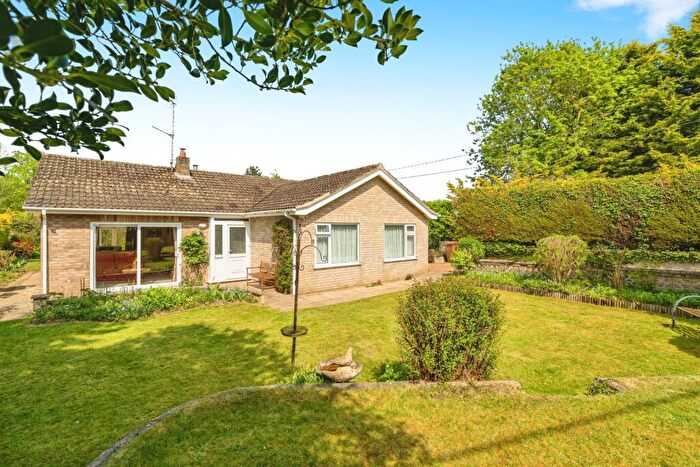
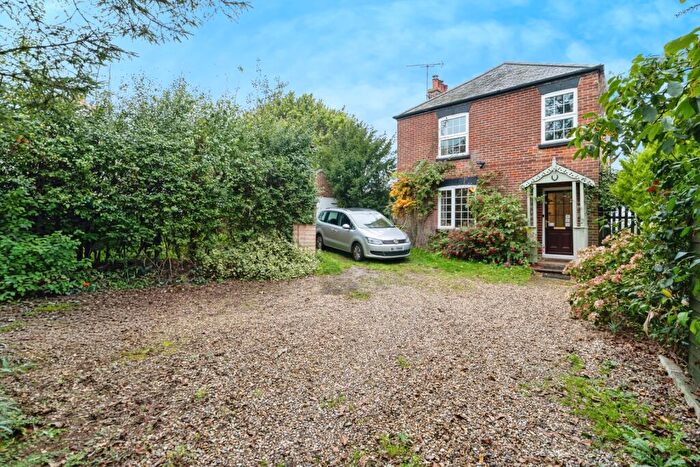
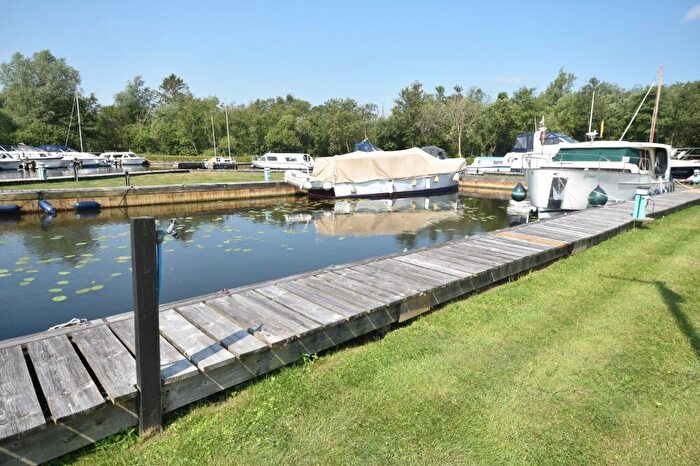
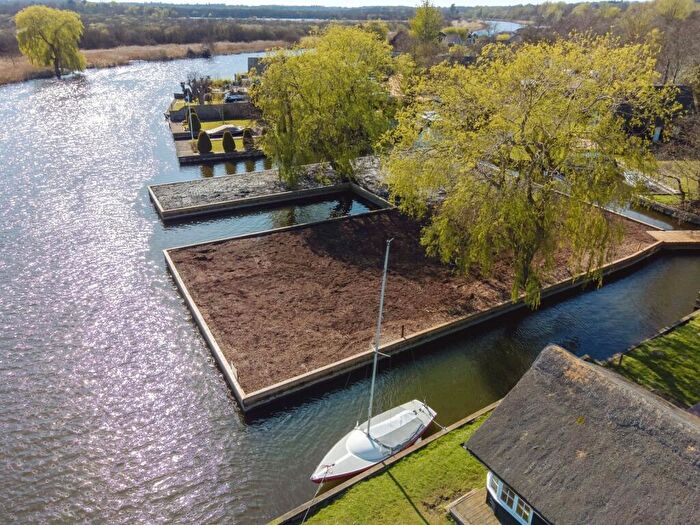
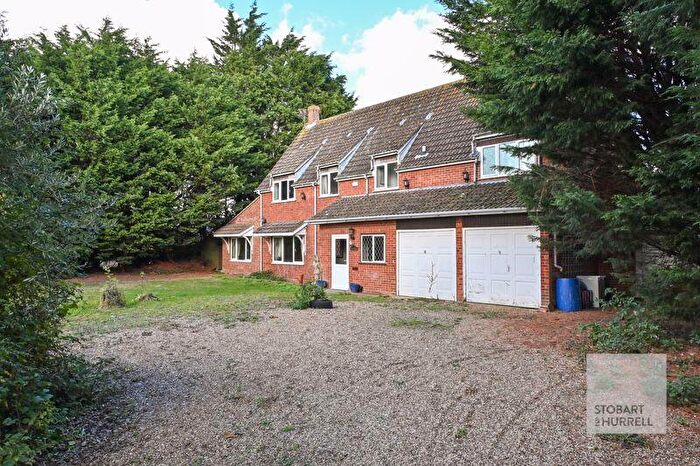
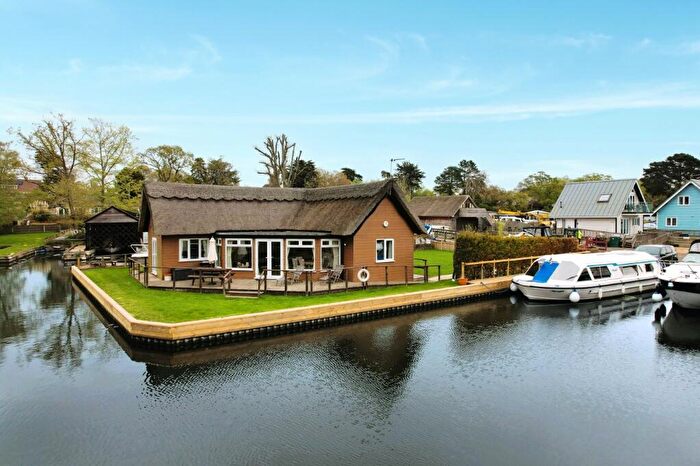
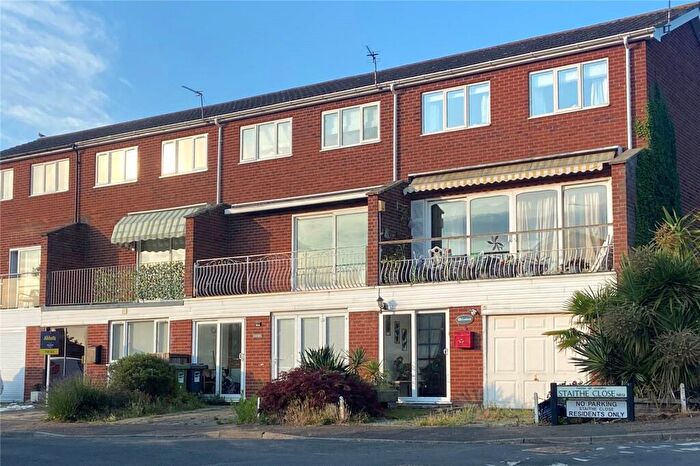
Houses for sale & to rent in St Benet, Norwich
House Prices in St Benet
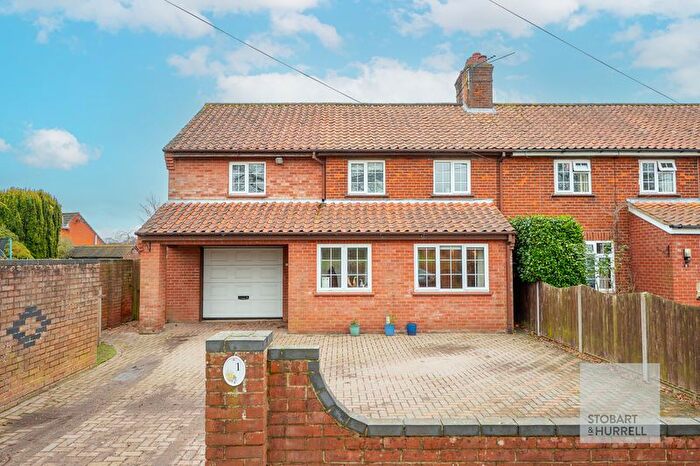
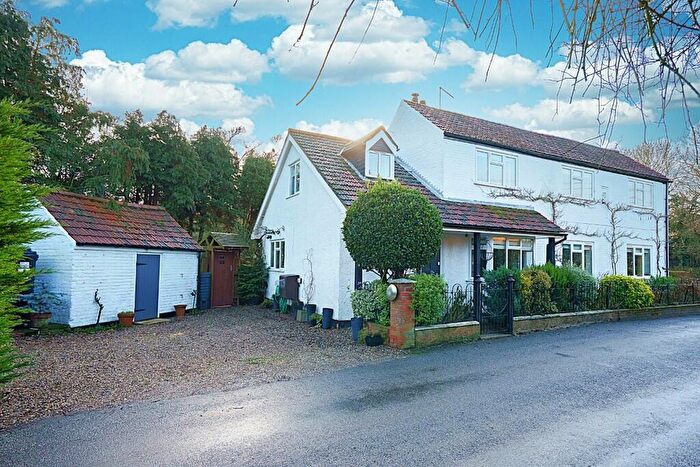
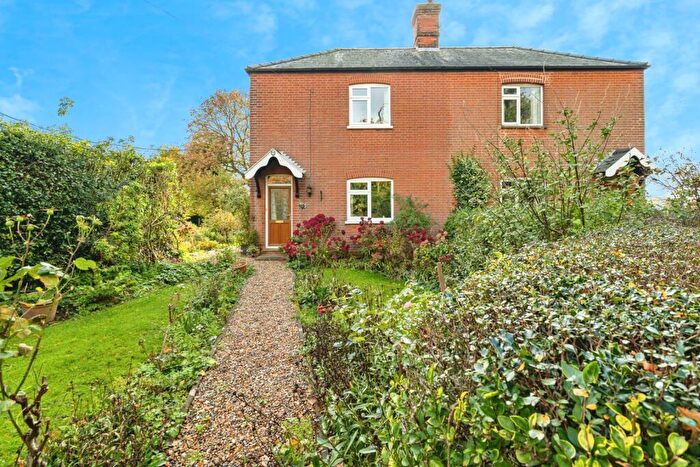
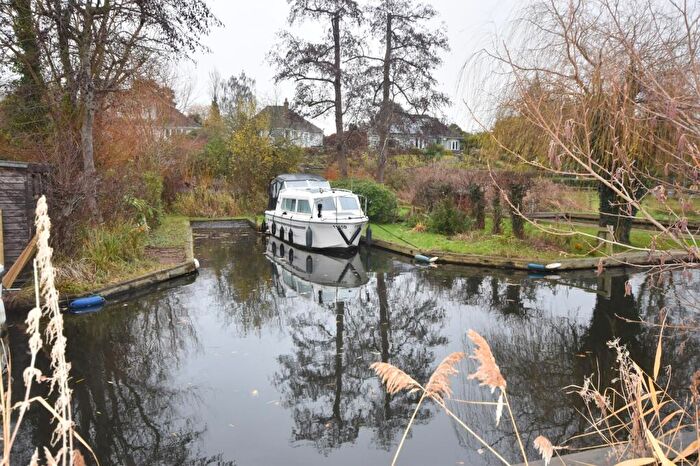
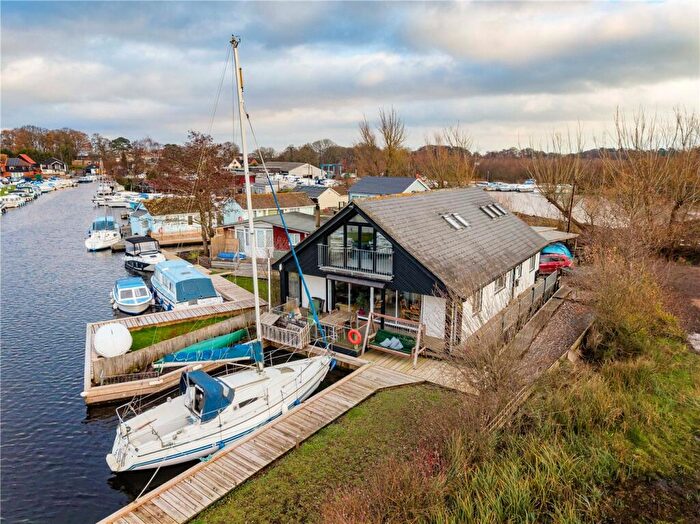
Properties in St Benet have an average house price of £471,728.00 and had 94 Property Transactions within the last 3 years¹.
St Benet is an area in Norwich, Norfolk with 948 households², where the most expensive property was sold for £2,100,000.00.
Properties for sale in St Benet
Roads and Postcodes in St Benet
Navigate through our locations to find the location of your next house in St Benet, Norwich for sale or to rent.
| Streets | Postcodes |
|---|---|
| Abbot Road | NR12 8PN |
| Benedict Road | NR12 8PH |
| Berry Hall Road | NR12 8BE |
| Bittern Crescent | NR12 8AY |
| Broadwater Way | NR12 8LG NR12 8PD |
| Butchers Common | NR12 8XH |
| Cangate | NR12 8YH |
| Chapel Corner | NR12 8YG |
| Chapel Road | NR12 8YF |
| Church Cottages | NR12 8NN |
| Church Road | NR12 8BT NR12 8PZ NR12 8YU |
| Common Road | NR12 8XY |
| Crabbetts Marsh | NR12 8JP |
| Falgate | NR12 8NH |
| Ferry Cott Lane | NR12 8PP |
| Ferry Road | NR12 8PS |
| Ferry View Estate | NR12 8PT |
| Grove Bungalows | NR12 8NF |
| Hall Lane | NR12 8NJ |
| Hall Road | NR12 8AR NR12 8XP NR12 8XX |
| Hill Top | NR12 8XQ |
| Hillside Road | NR12 8PG |
| Horning Road | NR12 8YE |
| Irstead Road | NR12 8BJ |
| Irstead Street | NR12 8XT |
| James Road | NR12 8PL |
| Kimberley Terrace | NR12 8LH |
| King Street | NR12 8BW |
| Leeds Way | NR12 8LU |
| Letheringtons Lane | NR12 8JT |
| Lower Street | NR12 8AA NR12 8PE NR12 8PF NR12 8PU |
| Mill Hill | NR12 8LF NR12 8LQ |
| Mill Loke | NR12 8AE NR12 8LL |
| Neatishead Road | NR12 8LB |
| Norwich Road | NR12 8LD NR12 8LW |
| Parker Way | NR12 8BF |
| Parkland Close | NR12 8PW |
| Parkland Crescent | NR12 8PJ |
| Pennygate | NR12 8BG NR12 8BQ |
| Petersfield Drive | NR12 8FB |
| Pinewood Drive | NR12 8LZ |
| Racing Reach | NR12 8JR |
| Ropes Hill | NR12 8PA NR12 8PB |
| Ropes Hill Dyke | NR12 8JS |
| School Lane | NR12 8EW NR12 8XE |
| School Road | NR12 8AT NR12 8BU NR12 8PX NR12 8XN NR12 8XW |
| Shoals Road | NR12 8XR |
| Smallburgh Road | NR12 8YT |
| Sows Loke | NR12 8BS |
| Staithe Close | NR12 8AF |
| Staithe Road | NR12 8AZ |
| Stanley Avenue | NR12 8XJ |
| The Avenue | NR12 8LR |
| The Common | NR12 8BA |
| The Shoal | NR12 8XS |
| The Street | NR12 8AD NR12 8BB NR12 8XG |
| Threehammer Common | NR12 8BP |
| Upper Street | NR12 8NE NR12 8NG NR12 8NL |
| Water Lane | NR12 8BL |
| NR12 8XU |
Transport near St Benet
-
Hoveton and Wroxham Station
-
Salhouse Station
-
Worstead Station
-
Acle Station
-
Lingwood Station
-
Brundall Gardens Station
-
Brundall Station
-
North Walsham Station
-
Buckenham Station
-
Norwich Station
- FAQ
- Price Paid By Year
- Property Type Price
Frequently asked questions about St Benet
What is the average price for a property for sale in St Benet?
The average price for a property for sale in St Benet is £471,728. This amount is 53% higher than the average price in Norwich. There are 412 property listings for sale in St Benet.
What streets have the most expensive properties for sale in St Benet?
The streets with the most expensive properties for sale in St Benet are Church Road at an average of £1,005,000, Shoals Road at an average of £975,000 and Ferry Cott Lane at an average of £886,666.
What streets have the most affordable properties for sale in St Benet?
The streets with the most affordable properties for sale in St Benet are Kimberley Terrace at an average of £214,500, Cangate at an average of £250,000 and Crabbetts Marsh at an average of £262,500.
Which train stations are available in or near St Benet?
Some of the train stations available in or near St Benet are Hoveton and Wroxham, Salhouse and Worstead.
Property Price Paid in St Benet by Year
The average sold property price by year was:
| Year | Average Sold Price | Price Change |
Sold Properties
|
|---|---|---|---|
| 2025 | £498,426 | 8% |
26 Properties |
| 2024 | £460,723 | -0,4% |
38 Properties |
| 2023 | £462,528 | -17% |
30 Properties |
| 2022 | £542,607 | 18% |
47 Properties |
| 2021 | £444,981 | 13% |
61 Properties |
| 2020 | £388,675 | -25% |
37 Properties |
| 2019 | £485,677 | 29% |
46 Properties |
| 2018 | £343,333 | 1% |
36 Properties |
| 2017 | £341,104 | 9% |
54 Properties |
| 2016 | £309,715 | 4% |
57 Properties |
| 2015 | £297,016 | 5% |
42 Properties |
| 2014 | £283,544 | -8% |
47 Properties |
| 2013 | £305,679 | 10% |
40 Properties |
| 2012 | £274,068 | -13% |
44 Properties |
| 2011 | £309,696 | 6% |
30 Properties |
| 2010 | £290,619 | 9% |
30 Properties |
| 2009 | £263,603 | -3% |
42 Properties |
| 2008 | £272,043 | -13% |
18 Properties |
| 2007 | £308,497 | 8% |
49 Properties |
| 2006 | £282,373 | 4% |
46 Properties |
| 2005 | £271,753 | 11% |
41 Properties |
| 2004 | £243,125 | 18% |
55 Properties |
| 2003 | £199,849 | 3% |
51 Properties |
| 2002 | £194,073 | 27% |
61 Properties |
| 2001 | £140,802 | 9% |
45 Properties |
| 2000 | £128,491 | 7% |
48 Properties |
| 1999 | £119,516 | -12% |
46 Properties |
| 1998 | £133,532 | 25% |
50 Properties |
| 1997 | £100,430 | 15% |
46 Properties |
| 1996 | £85,859 | -2% |
54 Properties |
| 1995 | £87,631 | - |
36 Properties |
Property Price per Property Type in St Benet
Here you can find historic sold price data in order to help with your property search.
The average Property Paid Price for specific property types in the last three years are:
| Property Type | Average Sold Price | Sold Properties |
|---|---|---|
| Semi Detached House | £333,541.00 | 12 Semi Detached Houses |
| Detached House | £527,961.00 | 66 Detached Houses |
| Terraced House | £352,966.00 | 15 Terraced Houses |
| Flat | £200,000.00 | 1 Flat |

