
Houses for sale in Worstead, Norwich
House Prices in Worstead
Properties in Worstead have an average house price of £415k and had 20 Property Transactions within the last 3 years¹.
Worstead is an area in Norwich, Norfolk with 397 households², where the most expensive property was sold for £875k.
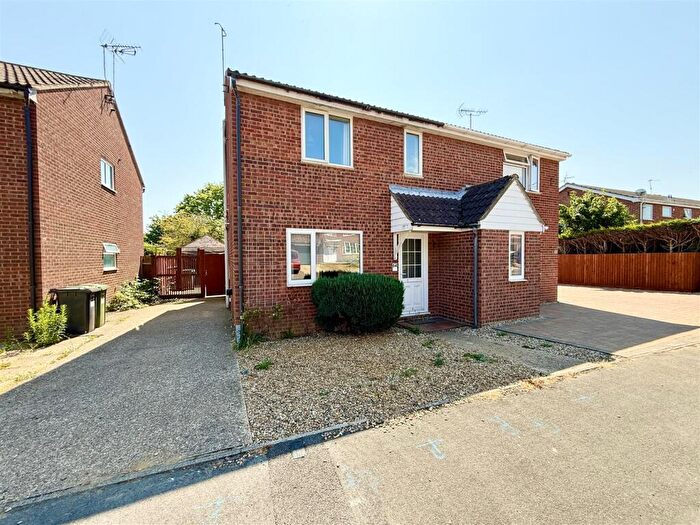
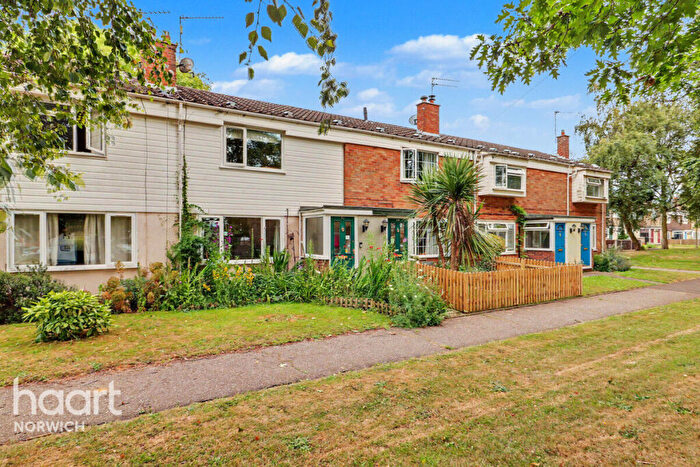
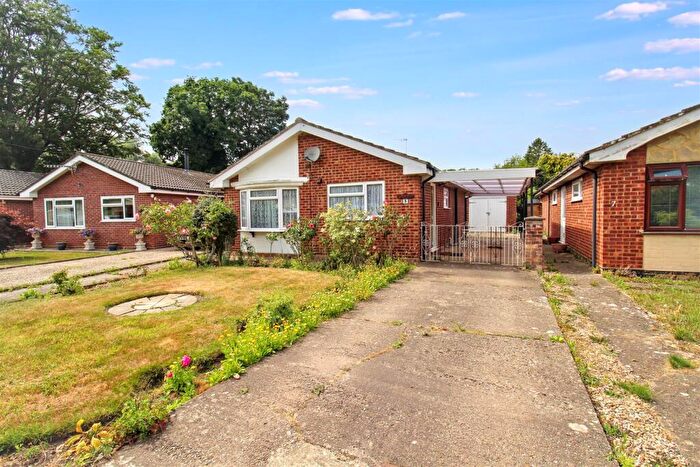
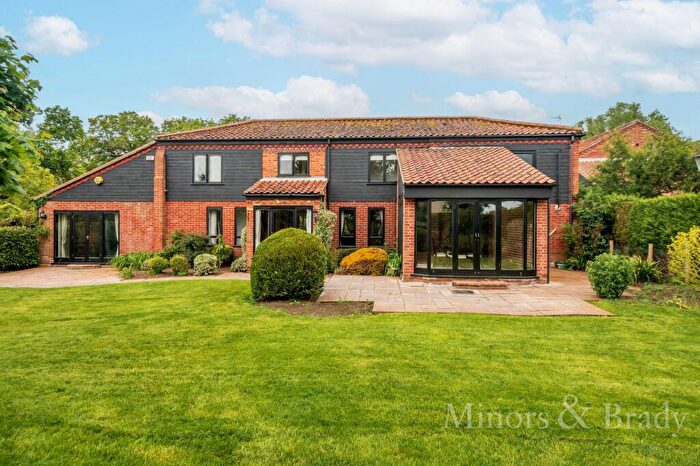
Properties for sale in Worstead
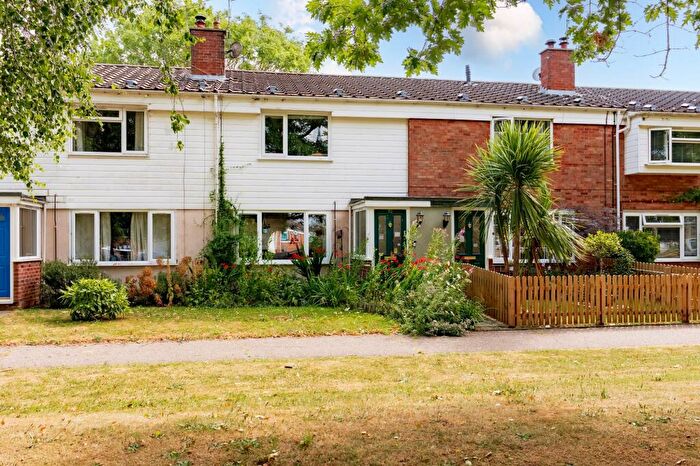
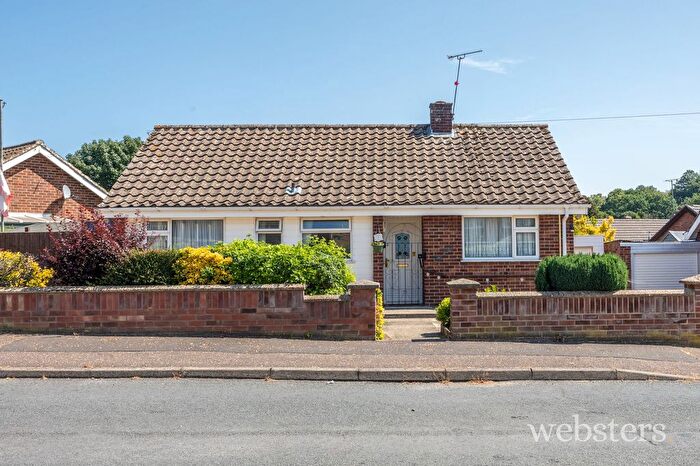
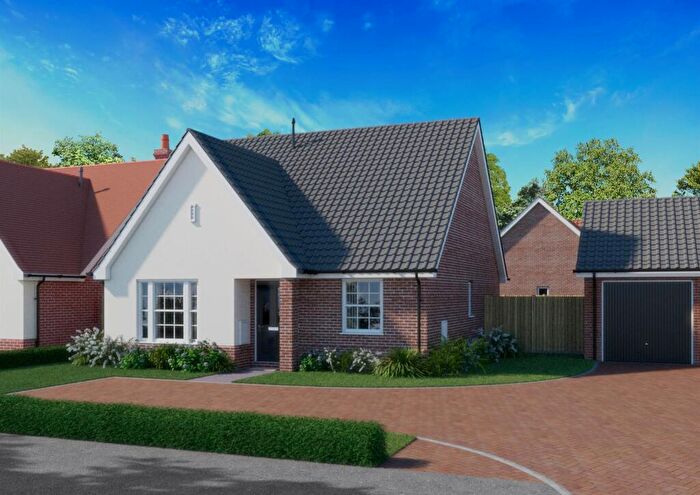
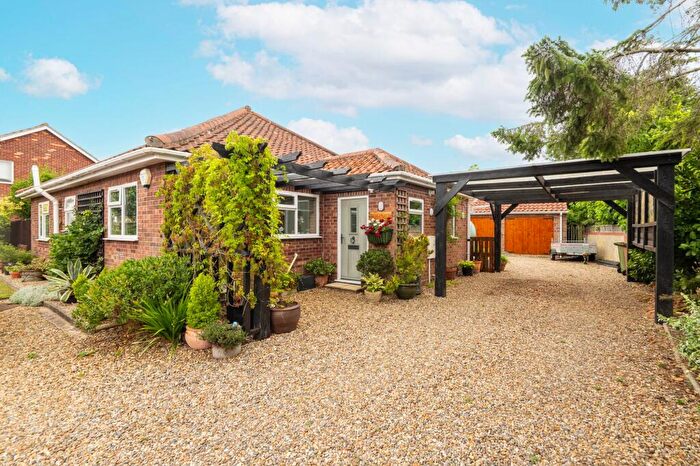
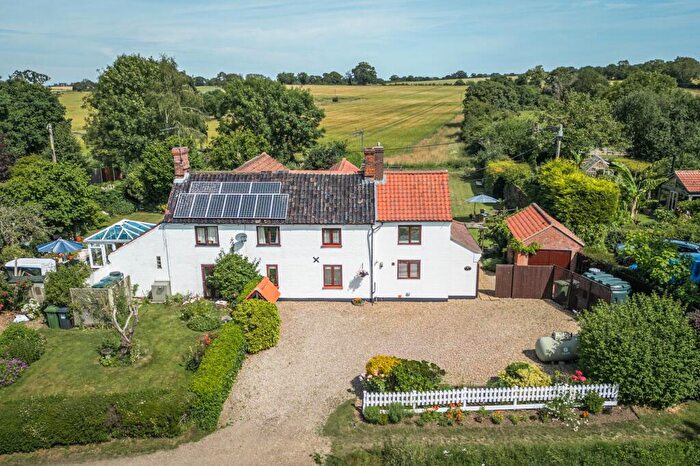
![]()
If you are looking to sell your house, let it out, or receive a property valuation, an expert can help you.
Click the button below to get started.
Roads and Postcodes in Worstead
Navigate through our locations to find the location of your next house in Worstead, Norwich for sale or to rent.
| Streets | Postcodes |
|---|---|
| Aylsham Road | NR10 5AH NR10 5DL |
| Black Horse Road | NR10 5DJ |
| Brick Kiln Lane | NR11 7EP |
| Church Road | NR10 5AX NR10 5AY NR10 5DF |
| Common Road | NR10 5BB |
| Cross Road | NR10 5DT |
| Elm Farm Bungalows | NR11 7EN |
| Felmingham Road | NR10 5AR NR10 5AS |
| Jaguar Drive | NR10 5GB |
| Lamas Road | NR10 5FB NR10 5LG |
| Leathercoat Lane | NR10 5BJ |
| Long Common | NR10 5BH |
| Long Common Lane | NR10 5DS |
| Long Road | NR10 5DH NR10 5ED |
| New Road | NR10 5AZ |
| North Walsham Road | NR10 5BZ NR10 5AW NR11 7AJ |
| Norwich Road | NR10 5AL NR10 5BG NR10 5BN NR10 5BT |
| Obelisk Lane | NR10 5BE |
| Old Norwich Road | NR10 5DB |
| Primrose Lane | NR10 5AN |
| Rectory Road | NR11 7EW |
| School Lane | NR10 5BA |
| School Road | NR10 5BL |
| Scottow Road | NR10 5GD |
| Scottow Row | NR10 5DE |
| Skeyton Corner | NR10 5AP |
| Stake Bridge Road | NR10 5DG |
| Swanton Abbot Road | NR10 5AU |
| Swanton Abbott Road | NR10 5DN NR10 5EB |
| The Hill | NR10 5BQ NR10 5EA |
| The Oaks | NR10 5DD |
| The Poplars | NR10 5DX |
| The Street | NR10 5DU NR11 7EQ |
| Tuttington Road | NR10 5TA |
| Youngmans Lane | NR10 5DZ |
| NR11 7EJ NR10 5AT NR10 5BP NR10 5BS NR10 5BU NR10 5BW NR10 5BX NR10 5DP NR10 5DW NR10 5DY NR11 7ER |
Property price trends in Worstead
According to the latest Land Registry data, the average home in Worstead sold for £308,750 in 2025. That figure comes from 325 sales logged over the past 30 years.
Prices have fallen back over the last three years. Compared with 2022, when the typical sale came in around £477,538, that's a fall of roughly 35.3%.
Looking back five years, average prices are down about 30.1% since 2020, a drop of around £133,260 in cash terms.
Zoom out to the past decade for the fuller picture. Back in 2015, homes here averaged £251,281, so the typical sold price has climbed about 22.9% since then, roughly 2.1% a year. Stretch the view to fifteen years and that annual pace eases back to about -1.8%.
Frequently asked questions about Worstead
What is the average price for a property for sale in Worstead?
The average price for a property for sale in Worstead is £415,025. This amount is 35% higher than the average price in Norwich. There are 1,864 property listings for sale in Worstead.
What streets have the most expensive properties for sale in Worstead?
The streets with the most expensive properties for sale in Worstead are Brick Kiln Lane at an average of £678,000, The Street at an average of £415,000 and Aylsham Road at an average of £393,750.
What streets have the most affordable properties for sale in Worstead?
The streets with the most affordable properties for sale in Worstead are Skeyton Corner at an average of £238,500, Elm Farm Bungalows at an average of £248,000 and The Hill at an average of £325,000.
Which train stations are available in or near Worstead?
Some of the train stations available in or near Worstead are Worstead, North Walsham and Gunton.
Property Price Paid in Worstead by Year
The average sold property price by year was:
| Year | Average Sold Price | Price Change |
Sold Properties
|
|---|---|---|---|
| 2025 | £308,750 | -24% |
6 Properties |
| 2024 | £382,571 | -41% |
7 Properties |
| 2023 | £538,571 | 11% |
7 Properties |
| 2022 | £477,538 | 28% |
13 Properties |
| 2021 | £341,937 | -29% |
8 Properties |
| 2020 | £442,010 | 22% |
5 Properties |
| 2019 | £346,940 | 6% |
10 Properties |
| 2018 | £324,777 | 2% |
9 Properties |
| 2017 | £316,693 | 23% |
8 Properties |
| 2016 | £242,814 | -3% |
7 Properties |
Property Price per Property Type in Worstead
Here you can find historic sold price data in order to help with your property search.
The average Property Paid Price for specific property types in the last three years are:
| Property Type | Average Sold Price | Sold Properties |
|---|---|---|
| Semi Detached House | £332,000.00 | 5 Semi Detached Houses |
| Detached House | £512,550.00 | 10 Detached Houses |
| Terraced House | £303,000.00 | 5 Terraced Houses |
