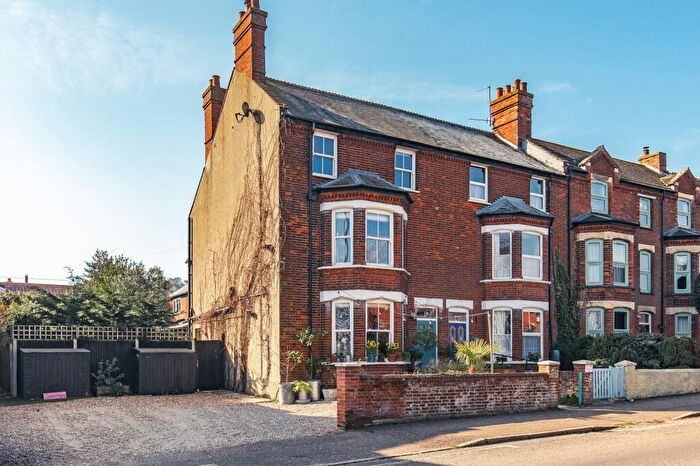
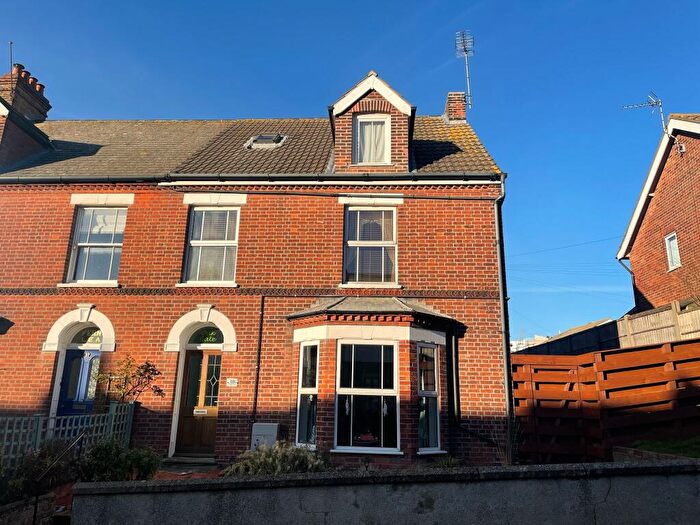
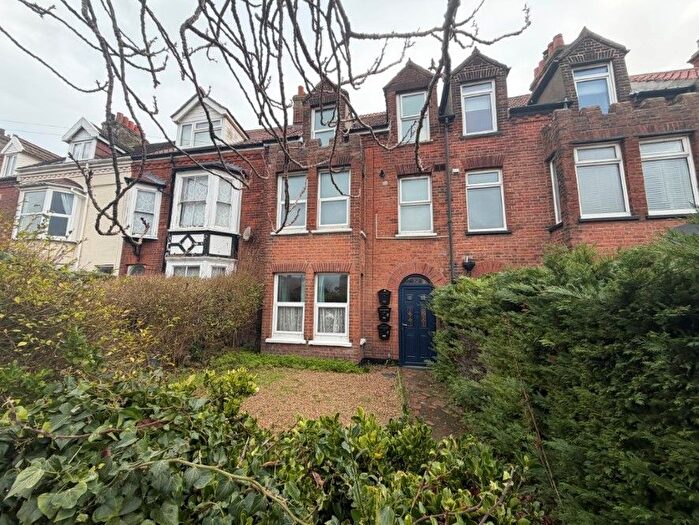
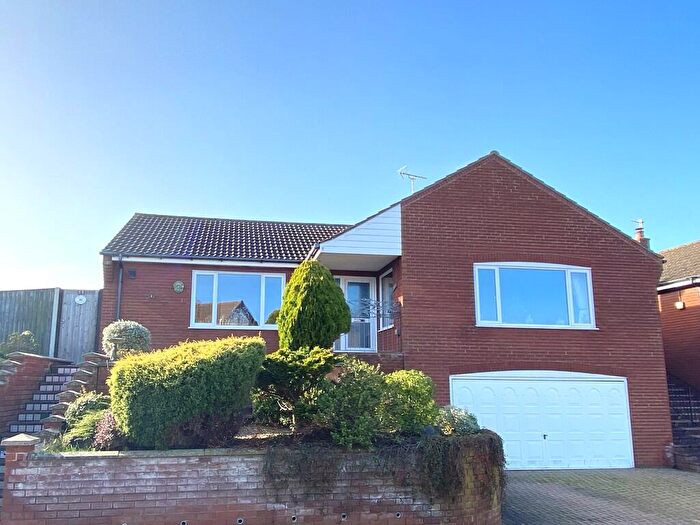
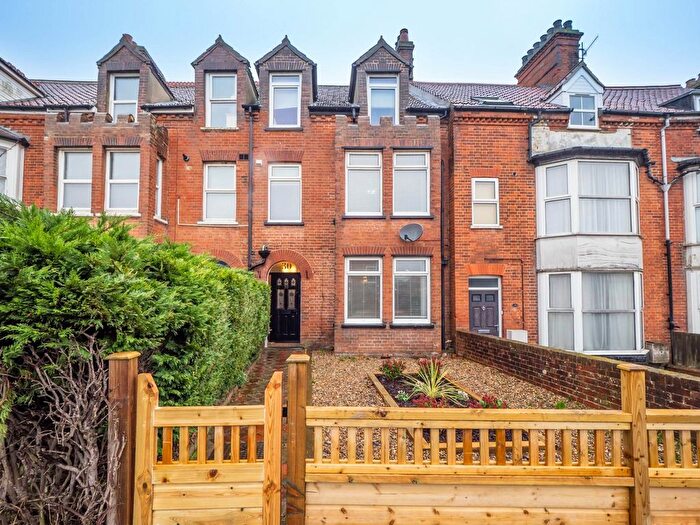
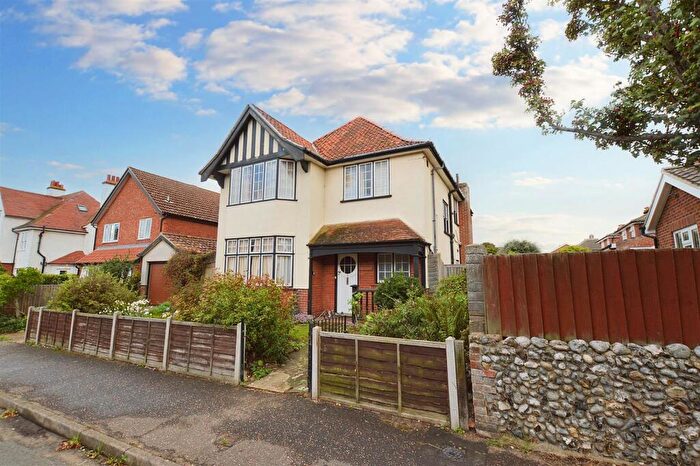
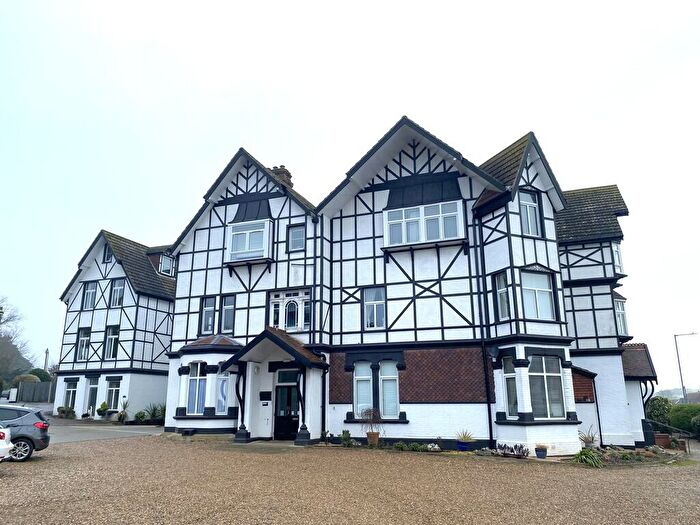
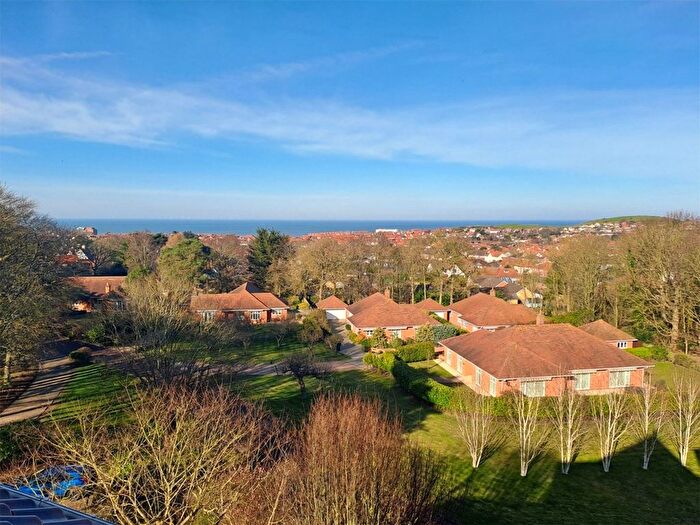
Houses for sale & to rent in Chaucer, Sheringham
House Prices in Chaucer
Properties in Chaucer have an average house price of £352,694.00 and had 43 Property Transactions within the last 3 years¹.
Chaucer is an area in Sheringham, Norfolk with 500 households², where the most expensive property was sold for £696,000.00.
Properties for sale in Chaucer
Roads and Postcodes in Chaucer
Navigate through our locations to find the location of your next house in Chaucer, Sheringham for sale or to rent.
| Streets | Postcodes |
|---|---|
| Abbey Park | NR26 8SP NR26 8SR NR26 8SS |
| Beeston Common | NR26 8EX |
| Blowlands Lane | NR26 8TQ |
| Britons Lane | NR26 8SJ NR26 8TP NR26 8TR |
| Britons Lane Close | NR26 8SH |
| Caxton Close | NR26 8SU |
| Caxton Park | NR26 8ST |
| Church Close | NR26 8UB |
| Church Lane | NR26 8EY NR26 8TF |
| Cranfield Road | NR26 8TH |
| Cromer Road | NR26 8SG NR26 8SQ |
| Hillside Road | NR26 8TT |
| Holt Road | NR26 8TN |
| Lodge Hill | NR26 8TJ |
| Marlinge Place | NR26 8YL |
| Old School Court | NR26 8UA |
| Park Road | NR26 8TD |
| Priory Close | NR26 8SL |
| Regis Avenue | NR26 8SN NR26 8SW |
| Sheringham Park | NR26 8TB |
| Sheringham Road | NR26 8TG |
| Sheringwood | NR26 8TS |
| The Green | NR26 8AE |
| The Street | NR26 8AD |
Transport near Chaucer
- FAQ
- Price Paid By Year
- Property Type Price
Frequently asked questions about Chaucer
What is the average price for a property for sale in Chaucer?
The average price for a property for sale in Chaucer is £352,694. This amount is 3% lower than the average price in Sheringham. There are 459 property listings for sale in Chaucer.
What streets have the most expensive properties for sale in Chaucer?
The streets with the most expensive properties for sale in Chaucer are Sheringwood at an average of £555,000, Blowlands Lane at an average of £499,000 and Old School Court at an average of £468,750.
What streets have the most affordable properties for sale in Chaucer?
The streets with the most affordable properties for sale in Chaucer are The Green at an average of £230,000, Church Lane at an average of £290,000 and The Street at an average of £295,000.
Which train stations are available in or near Chaucer?
Some of the train stations available in or near Chaucer are Sheringham, West Runton and Cromer.
Property Price Paid in Chaucer by Year
The average sold property price by year was:
| Year | Average Sold Price | Price Change |
Sold Properties
|
|---|---|---|---|
| 2025 | £367,573 | 4% |
12 Properties |
| 2024 | £351,285 | 4% |
21 Properties |
| 2023 | £337,800 | -7% |
10 Properties |
| 2022 | £361,607 | 5% |
14 Properties |
| 2021 | £344,865 | 11% |
26 Properties |
| 2020 | £306,475 | 7% |
19 Properties |
| 2019 | £285,264 | 7% |
24 Properties |
| 2018 | £265,722 | 2% |
18 Properties |
| 2017 | £261,479 | 8% |
29 Properties |
| 2016 | £239,811 | 0,3% |
18 Properties |
| 2015 | £239,176 | 3% |
25 Properties |
| 2014 | £231,032 | 9% |
32 Properties |
| 2013 | £209,870 | 4% |
20 Properties |
| 2012 | £201,357 | 7% |
21 Properties |
| 2011 | £186,675 | -12% |
14 Properties |
| 2010 | £208,376 | 11% |
24 Properties |
| 2009 | £186,040 | -10% |
22 Properties |
| 2008 | £204,800 | 9% |
18 Properties |
| 2007 | £186,665 | -3% |
20 Properties |
| 2006 | £191,890 | -31% |
36 Properties |
| 2005 | £251,214 | 26% |
7 Properties |
| 2004 | £186,609 | 22% |
22 Properties |
| 2003 | £144,889 | -3% |
14 Properties |
| 2002 | £149,590 | 26% |
26 Properties |
| 2001 | £111,347 | 18% |
23 Properties |
| 2000 | £91,622 | -39% |
24 Properties |
| 1999 | £127,538 | 41% |
18 Properties |
| 1998 | £75,752 | 14% |
20 Properties |
| 1997 | £65,462 | 13% |
32 Properties |
| 1996 | £56,855 | -0,3% |
27 Properties |
| 1995 | £57,023 | - |
15 Properties |
Property Price per Property Type in Chaucer
Here you can find historic sold price data in order to help with your property search.
The average Property Paid Price for specific property types in the last three years are:
| Property Type | Average Sold Price | Sold Properties |
|---|---|---|
| Semi Detached House | £336,666.00 | 3 Semi Detached Houses |
| Terraced House | £339,375.00 | 4 Terraced Houses |
| Detached House | £355,510.00 | 36 Detached Houses |

