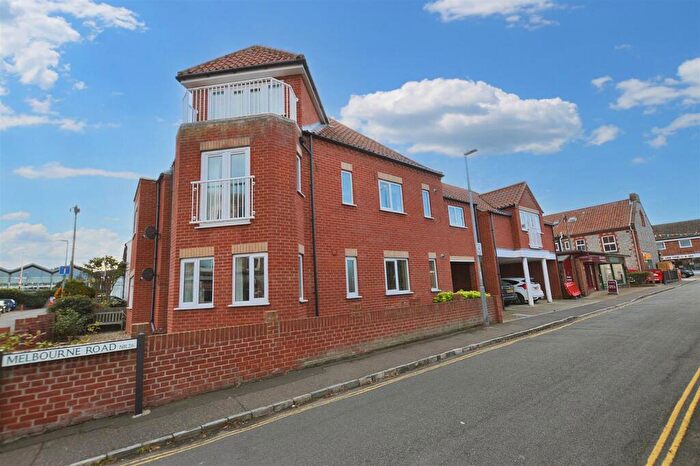
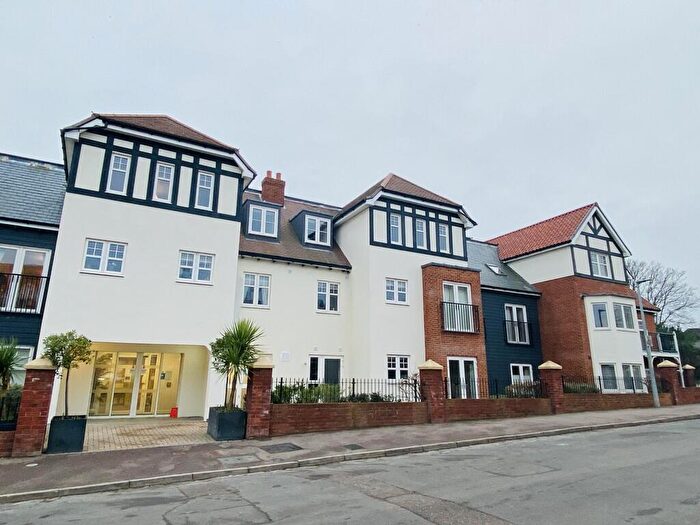
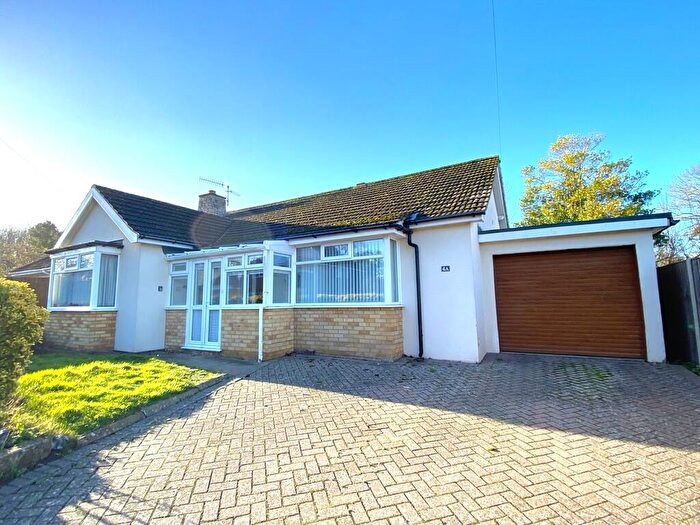
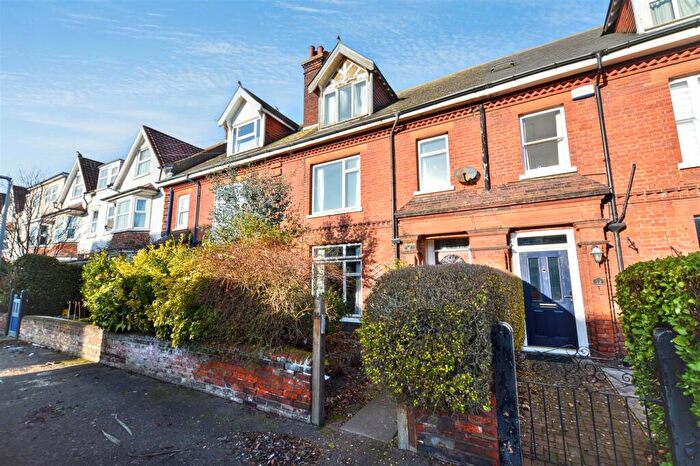
Houses for sale & to rent in Sheringham South, Sheringham
House Prices in Sheringham South
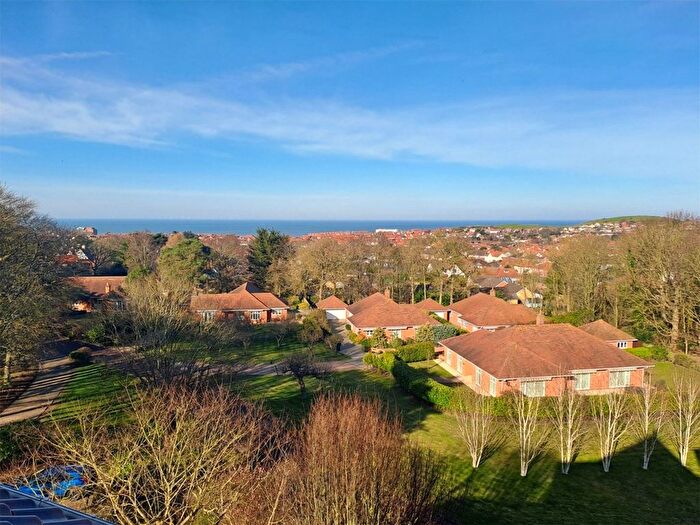
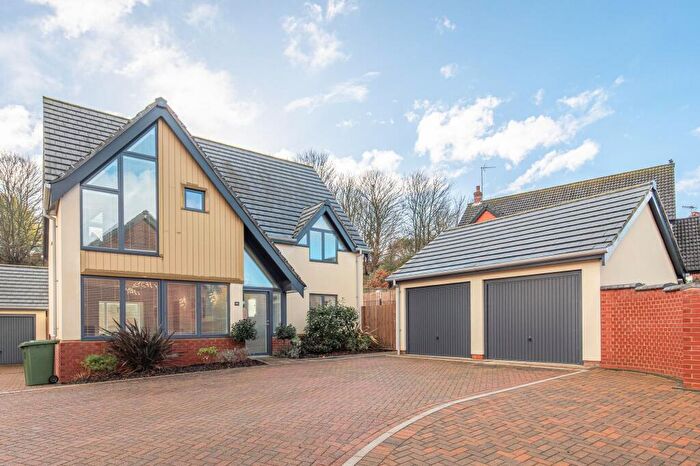
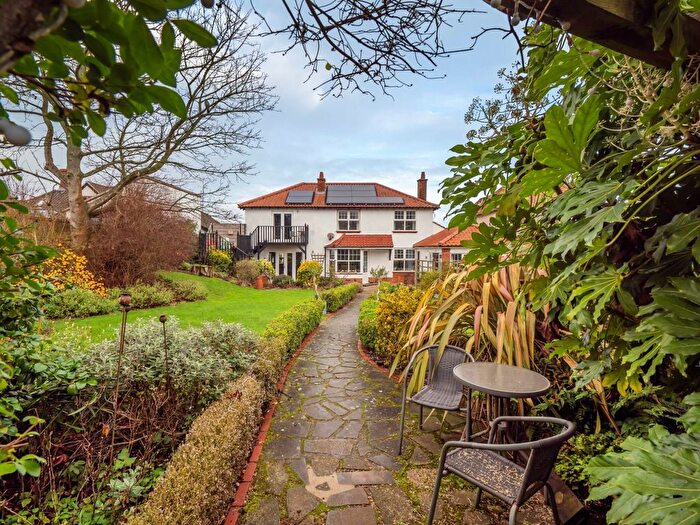
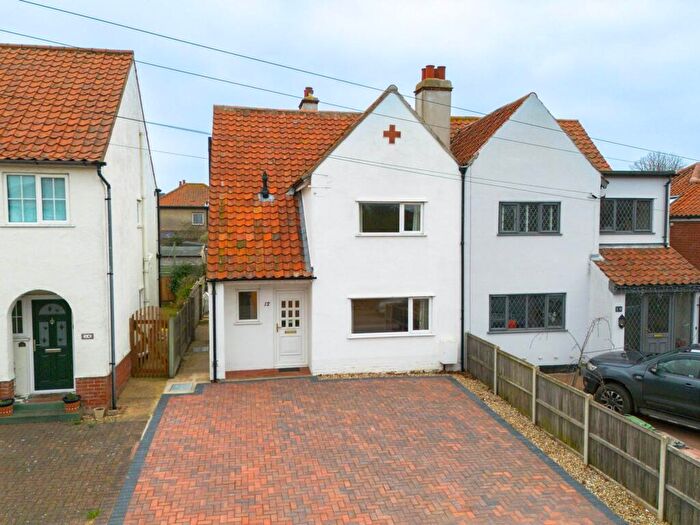
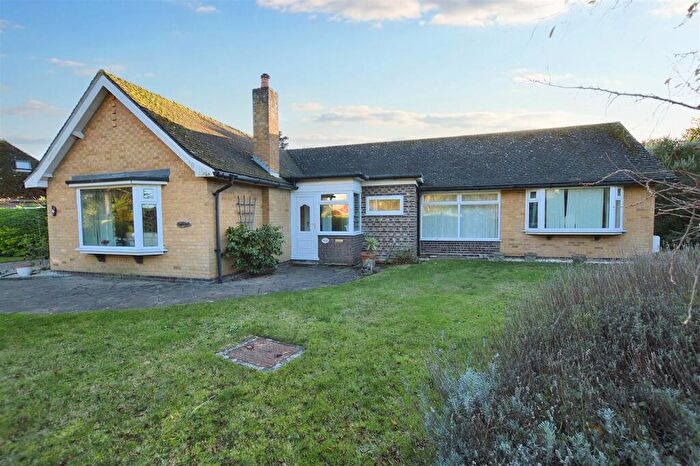
Properties in Sheringham South have an average house price of £411,961.00 and had 214 Property Transactions within the last 3 years¹.
Sheringham South is an area in Sheringham, Norfolk with 1,773 households², where the most expensive property was sold for £895,000.00.
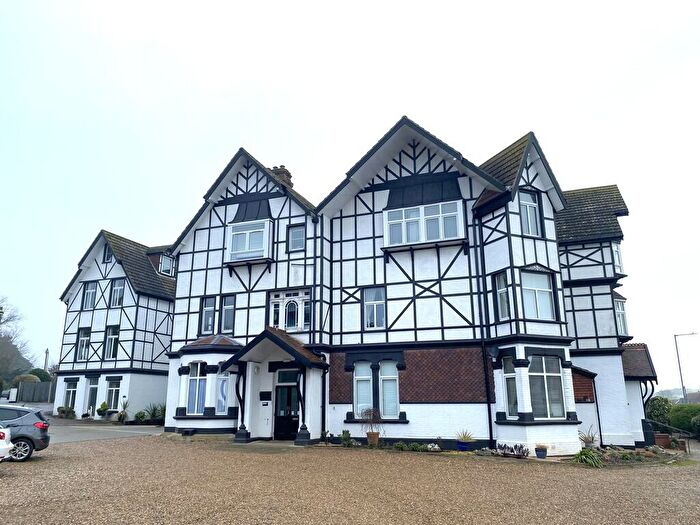
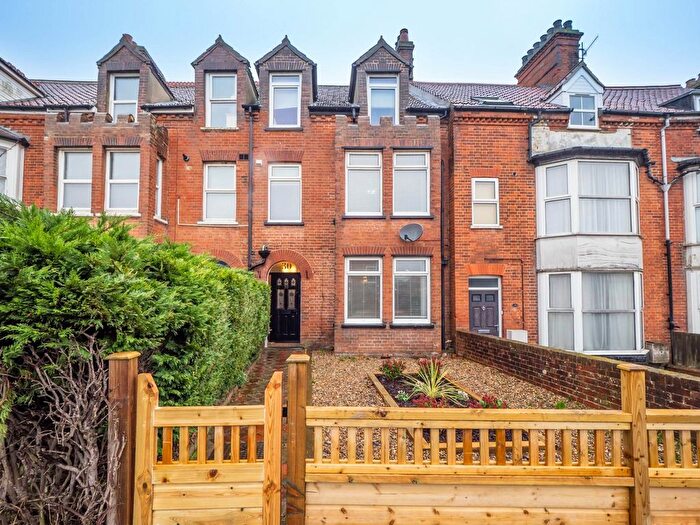
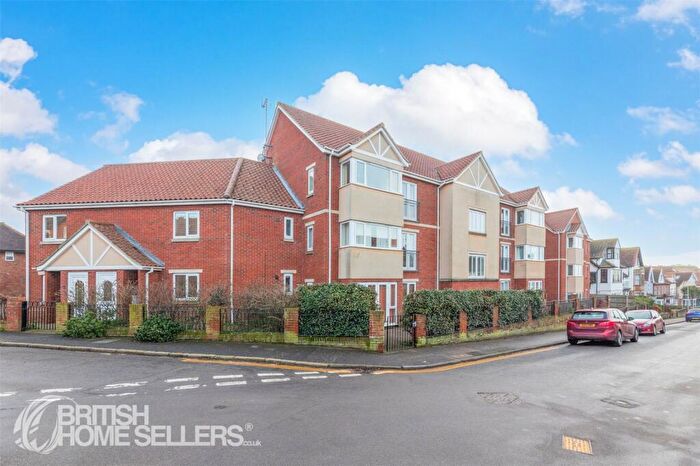
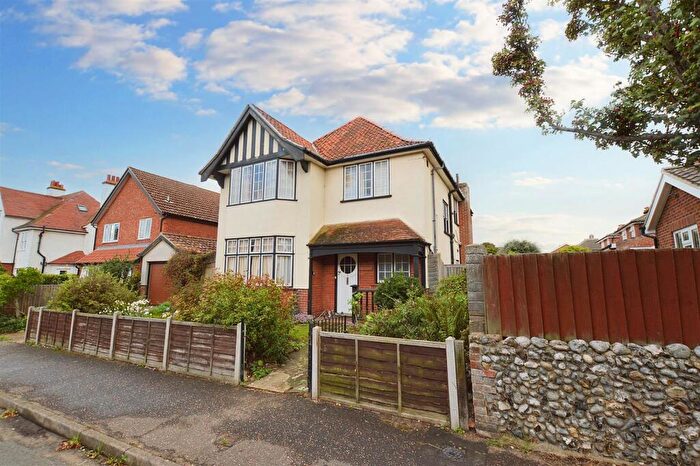
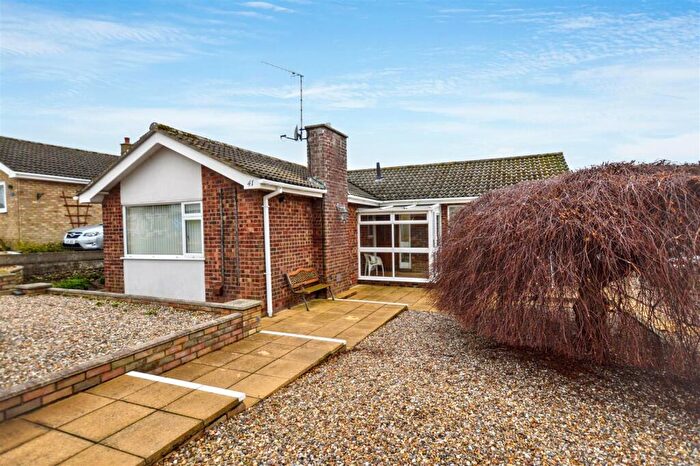
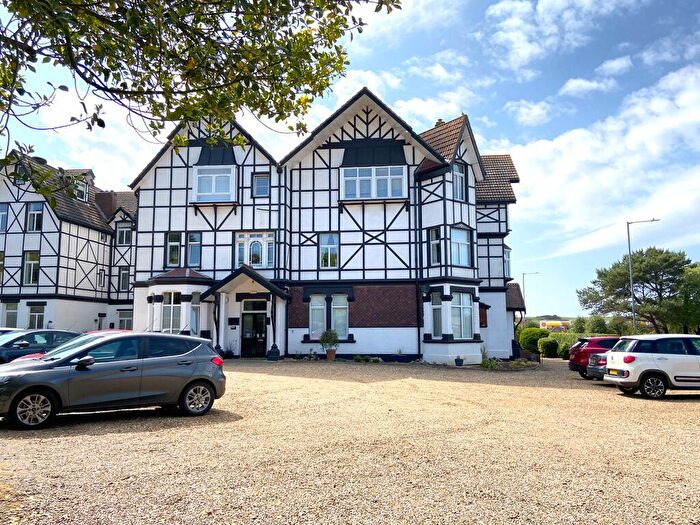
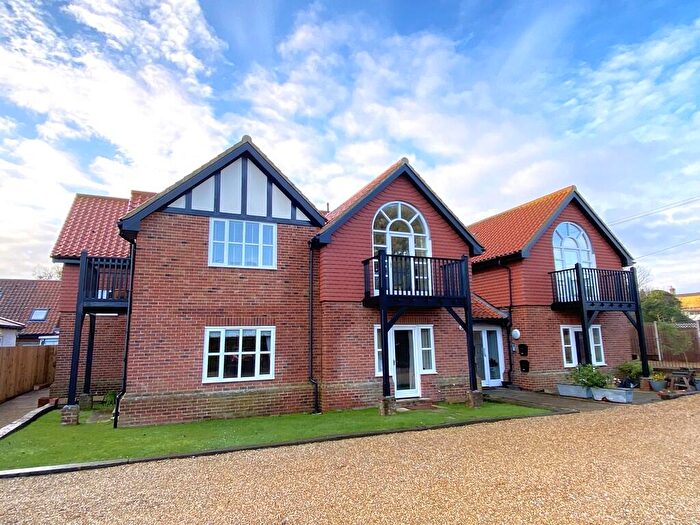
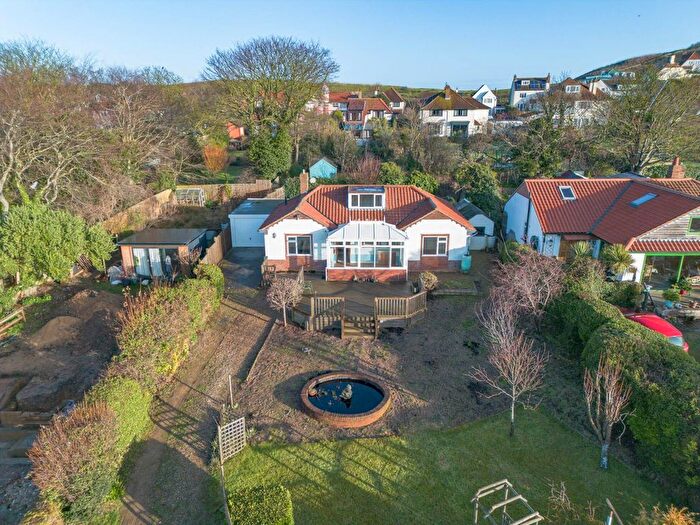
Properties for sale in Sheringham South
Roads and Postcodes in Sheringham South
Navigate through our locations to find the location of your next house in Sheringham South, Sheringham for sale or to rent.
| Streets | Postcodes |
|---|---|
| Abbey Close | NR26 8NW |
| Abbey Road | NR26 8HH NR26 8NN |
| Acacia Grove | NR26 8PA |
| Alexandra Road | NR26 8HU |
| Aran Drive | NR26 8UR |
| Ash Grove | NR26 8PT |
| Atkinson Way | NR26 8AJ |
| Bedford Mews | NR26 8HD |
| Beech Avenue | NR26 8NR NR26 8NS |
| Birch Grove | NR26 8NT |
| Bluebell Drive | NR26 8XE |
| Blyth Crescent | NR26 8JF |
| Bramble Drive | NR26 8XH |
| Campion Way | NR26 8UN |
| Cedar Grove | NR26 8PU |
| Celandine Lane | NR26 8UY |
| Charlock Drive | NR26 8UW |
| Chestnut Grove | NR26 8PH |
| Childs Way | NR26 8TX |
| Churchill Crescent | NR26 8NQ |
| Clover Drive | NR26 8UX |
| Coltsfoot Drive | NR26 8XG |
| Columbine Drive | NR26 8XQ |
| Cooper Road | NR26 8UH |
| Copland Drive | NR26 8JQ |
| Cowslip Lane | NR26 8XL |
| Craske Close | NR26 8TZ |
| Cremers Drift | NR26 8HX NR26 8HY NR26 8HZ NR26 8JJ |
| Cromer Road | NR26 8RX |
| Cypress Crescent | NR26 8NU |
| De Morley Garth | NR26 8JG |
| Edgebrook | NR26 8HA |
| Elm Grove | NR26 8PP |
| Emery Close | NR26 8YB |
| Fir Grove | NR26 8PQ |
| Foxglove Lane | NR26 8XW |
| Garden Road | NR26 8HT |
| Greenlands Way | NR26 8AT |
| Greenlands Way West | NR26 8XP |
| Grice Close | NR26 8UG |
| Hadley Road | NR26 8PZ |
| Hannah Close | NR26 8AY |
| Hanrae Close | NR26 8QJ |
| Hardingham Drive | NR26 8YE |
| Hazel Avenue | NR26 8PB |
| Heath Road | NR26 8JH |
| Holly Grove | NR26 8PJ |
| Holt Road | NR26 8NA NR26 8NB NR26 8ND NR26 8UL |
| Holway Road | NR26 8QH NR26 8HN NR26 8HP NR26 8HR NR26 8HW NR26 8JN NR26 8JW NR26 8NP |
| Hooks Hill Road | NR26 8NJ NR26 8NL |
| Huntley Crescent | NR26 8QQ |
| Jamie Wright Close | NR26 8JL |
| Juniper Grove | NR26 8LX |
| Knights Green | NR26 8UQ |
| Knowle Crescent | NR26 8PY |
| Knowle Road | NR26 8PX |
| Laburnum Grove | NR26 8NY |
| Lavender Drive | NR26 8XJ |
| Lilac Grove | NR26 8PE |
| Lime Grove | NR26 8NX |
| Linden Grove | NR26 8PD |
| Lodge Hill | NR26 8TL |
| Lusher Close | NR26 8XS |
| Margaret English Close | NR26 8UJ |
| Meadow Way | NR26 8NF |
| Meadowsweet Drive | NR26 8XA |
| Middleton Close | NR26 8UD |
| Morley Road | NR26 8JD NR26 8JE |
| Morley Road North | NR26 8JB |
| Norfolk Road | NR26 8HJ |
| Orchard Close | NR26 8SX |
| Orchid Drive | NR26 8UU |
| Pegg Road | NR26 8UE |
| Poplar Grove | NR26 8PS |
| Poppy Drive | NR26 8UZ |
| Pretty Corner | NR26 8TW |
| Primrose Lane | NR26 8UP |
| Repton Way | NR26 8UT |
| Rushmer Way | NR26 8YA |
| Sadlers Lane | NR26 8HS |
| Scira Lane | NR26 8TY |
| Scotter Rise | NR26 8YD |
| Seaview Crescent | NR26 8XR NR26 8XT |
| Shepherd Close | NR26 8AS |
| Snaefell Park | NR26 8GZ |
| Snowdrop Drive | NR26 8XD |
| St Josephs Road | NR26 8JA |
| Suffolk Road | NR26 8HL |
| Sycamore Grove | NR26 8PG |
| Teasel Rise | NR26 8XN |
| The Rise | NR26 8QA NR26 8QB |
| The Turning | NR26 8NG |
| Trentham Drive | NR26 8QZ |
| Uplands Park | NR26 8NE |
| Vicarage Road | NR26 8NH |
| Violet Drive | NR26 8XB |
| Weybourne Road | NR26 8HE NR26 8TA NR26 8TE NR26 8WB NR26 8WD |
| Weybourne Road Industrial Estate | NR26 8AF |
| Willow Grove | NR26 8LU |
| Wilson Mews | NR26 8AL |
| Woodhouse Close | NR26 8AX |
| Woodland Rise | NR26 8PR |
| Woodland Rise West | NR26 8NZ NR26 8PF NR26 8QL |
| Younger Drive | NR26 8AN |
Transport near Sheringham South
- FAQ
- Price Paid By Year
- Property Type Price
Frequently asked questions about Sheringham South
What is the average price for a property for sale in Sheringham South?
The average price for a property for sale in Sheringham South is £411,961. This amount is 13% higher than the average price in Sheringham. There are 446 property listings for sale in Sheringham South.
What streets have the most expensive properties for sale in Sheringham South?
The streets with the most expensive properties for sale in Sheringham South are Wilson Mews at an average of £730,000, Uplands Park at an average of £652,833 and Morley Road North at an average of £650,000.
What streets have the most affordable properties for sale in Sheringham South?
The streets with the most affordable properties for sale in Sheringham South are Bedford Mews at an average of £147,000, Birch Grove at an average of £195,000 and Emery Close at an average of £225,000.
Which train stations are available in or near Sheringham South?
Some of the train stations available in or near Sheringham South are Sheringham, West Runton and Cromer.
Property Price Paid in Sheringham South by Year
The average sold property price by year was:
| Year | Average Sold Price | Price Change |
Sold Properties
|
|---|---|---|---|
| 2025 | £383,039 | -8% |
52 Properties |
| 2024 | £415,034 | -4% |
94 Properties |
| 2023 | £429,830 | 6% |
68 Properties |
| 2022 | £402,182 | 11% |
72 Properties |
| 2021 | £359,093 | 3% |
110 Properties |
| 2020 | £348,433 | -5% |
84 Properties |
| 2019 | £365,838 | 16% |
89 Properties |
| 2018 | £307,914 | 2% |
88 Properties |
| 2017 | £301,788 | 3% |
87 Properties |
| 2016 | £293,905 | 7% |
80 Properties |
| 2015 | £272,400 | 9% |
115 Properties |
| 2014 | £248,734 | 8% |
92 Properties |
| 2013 | £228,920 | 5% |
86 Properties |
| 2012 | £216,770 | -11% |
70 Properties |
| 2011 | £239,686 | -5% |
76 Properties |
| 2010 | £250,734 | 10% |
88 Properties |
| 2009 | £225,705 | -1% |
82 Properties |
| 2008 | £227,604 | -6% |
59 Properties |
| 2007 | £241,990 | 4% |
134 Properties |
| 2006 | £231,289 | -2% |
108 Properties |
| 2005 | £235,577 | 7% |
100 Properties |
| 2004 | £219,059 | 12% |
115 Properties |
| 2003 | £191,824 | 16% |
87 Properties |
| 2002 | £160,833 | 17% |
105 Properties |
| 2001 | £132,850 | 24% |
109 Properties |
| 2000 | £100,992 | 14% |
83 Properties |
| 1999 | £86,916 | 7% |
125 Properties |
| 1998 | £81,214 | 9% |
107 Properties |
| 1997 | £74,307 | 8% |
129 Properties |
| 1996 | £68,693 | -4% |
123 Properties |
| 1995 | £71,523 | - |
102 Properties |
Property Price per Property Type in Sheringham South
Here you can find historic sold price data in order to help with your property search.
The average Property Paid Price for specific property types in the last three years are:
| Property Type | Average Sold Price | Sold Properties |
|---|---|---|
| Semi Detached House | £326,140.00 | 32 Semi Detached Houses |
| Detached House | £467,066.00 | 132 Detached Houses |
| Terraced House | £318,931.00 | 22 Terraced Houses |
| Flat | £323,357.00 | 28 Flats |

